Finance PowerPoint Templates, Presentation Slide Diagrams & PPT Graphics
- Sub Categories
-
- 30 60 90 Day Plan
- Advertising
- Agile Development
- Aims and Objectives
- Arrows
- Before and After
- Blockchain Bitcoin
- Boxes
- Business
- Calender
- Case Study
- Celebrations
- Certificates
- Challenges Opportunities
- Channel Distribution
- Children
- Communication
- Competitive Landscape
- Computer
- Concepts
- Construction Management
- Corporate
- Crowdfunding
- Current State Future State
- Custom PowerPoint Diagrams
- Digital Transformation
- Dos and Donts
- Economics
- Education
- Environment
- Events
- Festival
- Finance
- Financials
- Food
- Game
- Gap Analysis
- Generic
- Geographical
- Health
- Heatmaps
- Holidays
- Icons
- Input Process Output
- Internet
- Key Messages
- Key Wins
- Ladder
- Leadership
- Lists
- Lucky Draw
- Management
- Marketing
- Measuring
- Medical
- Music
- News
- Next Steps
- People Process Technology
- Pillars
- Planning
- Post-it-Notes
- Problem Statement
- Process
- Proposal Management
- Pros and Cons
- Puzzle
- Puzzles
- Recruitment Strategy
- Religion
- Research and Development
- Risk Mitigation Strategies
- Roadmap
- Selling
- Shapes
- Short Term Long Term
- Social
- Stairs
- Start Stop Continue
- Strategy
- Symbol
- Technology
- Thesis Defense Dissertation
- Timelines
- Traffic
- Transition Plan
- Transportation
- Vehicles
- Venture Capital Funding
- Warning
- Winners
- Word Cloud
-
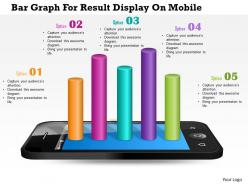 1114 bar graph for result display on mobile powerpoint template
We are proud to present our 1114 bar graph for result display on mobile powerpoint template. This Power Point template slide has been crafted with graphic of bar graph and mobile. This PPT slide contains the concept of result analysis. Use this Power Point template slide and build quality presentation for your viewers.
-
 1214 three numeric text box for data representation powerpoint template
We are proud to present our 1214 three numeric text box for data representation powerpoint template. Three numeric text boxes are used to develop this power point template. This PPT slide contains the concept of data representation. Display any kind of data in your presentation by using this exclusive template.
-
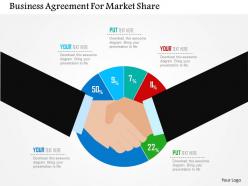 Business agreement for market share flat powerpoint design
We are proud to present our business agreement for market share flat powerpoint design. Concept of business agreement for market research and share has been displayed in this PPT diagram. This PPT diagram contains the graphic of handshake and pie graph. Use this PPT diagram for business and marketing related presentations.
-
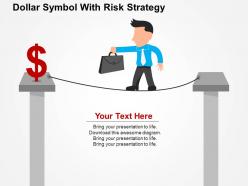 Dollar symbol with risk strategy flat powerpoint design
We are proud to present our dollar symbol with risk strategy flat powerpoint design. This power point template diagram has been crafted with graphic of dollar symbol. This PPT diagram contains the concept of financial risk strategy. Use this PPT diagram for business and finance related presentations.
-
 Circles with bar graph funnel financial growth flat powerpoint design
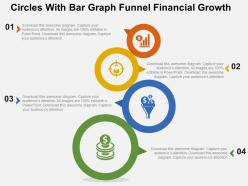
We are proud to present our circles with bar graph funnel financial growth flat powerpoint design. Graphic of circles and bar graph with funnel has been used to craft this power point template diagram. This PPT diagram contains the concept of financial growth . This PPT diagram can be used for business and finance related presentations.
-
 Great products low pricing ppt presentation
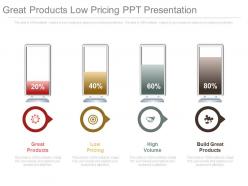
Presenting great products low pricing ppt presentation. This is a great products low pricing ppt presentation. This is a four stage process. The stages in this process are great products, low pricing, high volume, build great products.
-
 Opportunity cost balancing scale having dollar
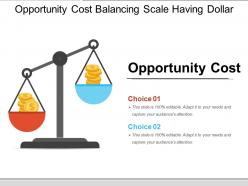
Presenting opportunity cost balancing scale having dollar. This is a opportunity cost balancing scale having dollar. This is a two stage process. The stages in this process are alternative cost, opportunity cost, alternative price, expected return.
-
 Opportunity cost three steps table chart
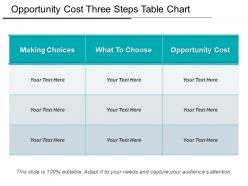
Presenting opportunity cost three steps table chart. This is a opportunity cost three steps table chart. This is a three stage process. The stages in this process are alternative cost, opportunity cost, alternative price, expected return.
-
 Cost model icon ppt slide
Presenting cost model icon ppt slide. This is a cost model icon ppt slide. This is a one stage process. The stages in this process are cost model, cost framework, price structure.
-
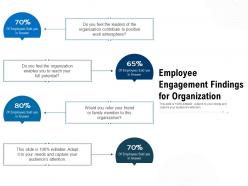 Employee engagement findings for organization
Presenting this set of slides with name Employee Engagement Findings For Organization. This is a four stage process. The stages in this process are Employee Engagement Findings For Organization. This is a completely editable PowerPoint presentation and is available for immediate download. Download now and impress your audience.
-
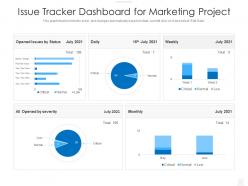 Issue tracker dashboard for marketing project
Presenting our well-structured Issue Tracker Dashboard For Marketing Project. The topics discussed in this slide are Issue Tracker Dashboard For Marketing Project. This is an instantly available PowerPoint presentation that can be edited conveniently. Download it right away and captivate your audience.
-
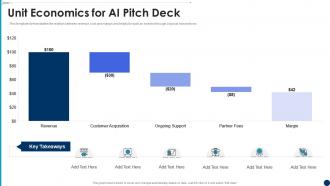 Artificial intelligence unit economics for ai pitch deck ppt powerpoint presentation ideas
This template demonstrates the relation between revenue, cost and margin and helpful to walk an investor through a typical transections. Present the topic in a bit more detail with this Artificial Intelligence Unit Economics For AI Pitch Deck Ppt Powerpoint Presentation Ideas. Use it as a tool for discussion and navigation on Revenue, Customer Acquisition, Ongoing Support, Partner Fees, Margin. This template is free to edit as deemed fit for your organization. Therefore download it now.
-
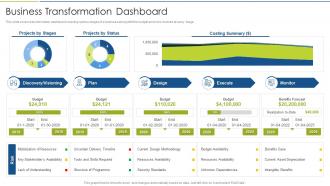 Accelerate Digital Journey Now Business Transformation Dashboard
This slide covers transformation dashboard covering various stages of a business along with the budget and risks involved at every stage. Present the topic in a bit more detail with this Accelerate Digital Journey Now Business Transformation Dashboard. Use it as a tool for discussion and navigation on Business Transformation Dashboard. This template is free to edit as deemed fit for your organization. Therefore download it now.
-
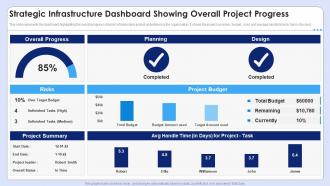 Strategic Infrastructure Dashboard Showing Overall Project Progress
This slide represents the dashboard highlighting the overall progress of public infrastructure project undertaken by the organisation. It shows the project summary, budget , risks and average handle time for tasks of project. Introducing our Strategic Infrastructure Dashboard Showing Overall Project Progress set of slides. The topics discussed in these slides are Overall Progress, Planning, Design, Project Budget, Project Summary, Risks. This is an immediately available PowerPoint presentation that can be conveniently customized. Download it and convince your audience.
-
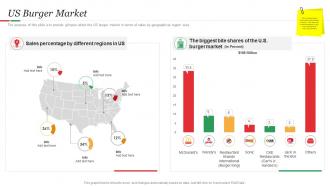 Hamburger Commerce Us Burger Market Ppt Demonstration
The purpose of this slide is to provide glimpse about the US burger market in terms of sales by geographical region wise. Present the topic in a bit more detail with this Hamburger Commerce Us Burger Market Ppt Demonstration. Use it as a tool for discussion and navigation on US Burger Market. This template is free to edit as deemed fit for your organization. Therefore download it now.
-
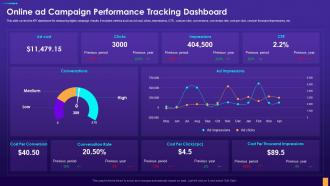 Online Ad Campaign Performance Tracking Dashboard Digital Consumer Touchpoint Strategy
This slide covers the KPI dashboard for measuring digital campaign results. It includes metrics such as Ad cost, clicks, impressions, CTR, cost per click, conversions, conversion rate, cost per click, cost per thousand impressions, etc. Present the topic in a bit more detail with this Online Ad Campaign Performance Tracking Dashboard Digital Consumer Touchpoint Strategy. Use it as a tool for discussion and navigation on Cost Per Conversion, Conversation Rate, Cost Per Click. This template is free to edit as deemed fit for your organization. Therefore download it now
-
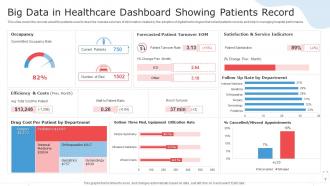 Big Data In Healthcare Dashboard Snapshot Showing Patients Record
This slide covers the records about the patients used to describe massive volumes of information created by the adoption of digital technologies that collect patients records and help in managing hospital performance. Introducing our Big Data In Healthcare Dashboard Snapshot Showing Patients Record set of slides. The topics discussed in these slides are Occupancy, Forecasted Patient Turnover, Service Indicators. This is an immediately available PowerPoint presentation that can be conveniently customized. Download it and convince your audience.
-
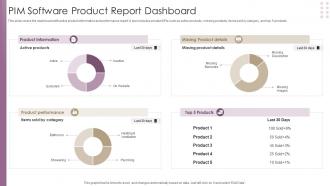 PIM Software Product Report Dashboard
This slide covers the dashboard with active product information and performance report. It also includes product KPIs such as active products, missing products, items sold by category, and top 5 products. Introducing our PIM Software Product Report Dashboard set of slides. The topics discussed in these slides are Product Information, Missing Product Details, Product Performance. This is an immediately available PowerPoint presentation that can be conveniently customized. Download it and convince your audience.
-
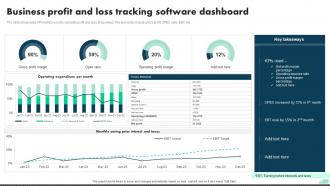 Business Profit And Loss Tracking Software Dashboard
The slide showcases KPI metrics used to calculate profit and loss of business. The elements include gross profit, OPEX ratio, EBT etc. Introducing our Business Profit And Loss Tracking Software Dashboard set of slides. The topics discussed in these slides are Business Profit, Loss Tracking, Software Dashboard. This is an immediately available PowerPoint presentation that can be conveniently customized. Download it and convince your audience.
-
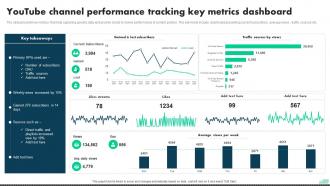 Youtube Channel Performance Tracking Key Metrics Dashboard
The slide presents key metrics that help capturing specific data and provide charts to review performance of content posted. The elements include dashboard presenting current subscribers, average views, traffic sources etc. Introducing our Youtube Channel Performance Tracking Key Metrics Dashboard set of slides. The topics discussed in these slides are Youtube Channel, Performance Tracking, Metrics Dashboard. This is an immediately available PowerPoint presentation that can be conveniently customized. Download it and convince your audience.
-
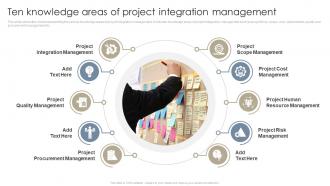 Ten Knowledge Areas Of Project Integration Management
This slide shows the model representing the various knowledge areas of project integration management. It includes knowledge areas of project integration management such as project time, scope, cost, stakeholders, quality and procurement management etc.Presenting our set of slides with Ten Knowledge Areas Of Project Integration Management. This exhibits information on ten stages of the process. This is an easy to edit and innovatively designed PowerPoint template. So download immediately and highlight information on Cost Management, Resource Management, Quality Management.
-
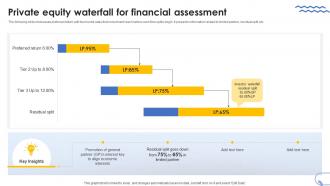 Private Equity Waterfall For Financial Assessment
The following slide showcases preferred return with two hurdle rates that investment reach before cash flow splits begin. It presents information related to limited partner, residual split, etc. Presenting our well structured Private Equity Waterfall For Financial Assessment. The topics discussed in this slide are Private Equity Waterfall, Financial Assessment. This is an instantly available PowerPoint presentation that can be edited conveniently. Download it right away and captivate your audience.
-
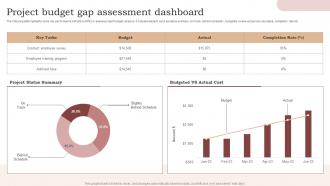 Project Budget Gap Assessment Dashboard
The following slide highlights some key performance indicators KPIs to assess project budget variance. It includes element such as status summary on track, behind schedule, budgeted verses actual cost, key tasks, completion rate etc. Introducing our Project Budget Gap Assessment Dashboard set of slides. The topics discussed in these slides are Employee Survey, Training Program, Project Status Summary. This is an immediately available PowerPoint presentation that can be conveniently customized. Download it and convince your audience.
-
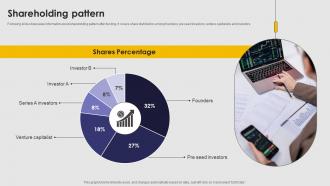 Shareholding Pattern Recruitment Solutions Agency Investment Ask Pitch Deck
Following slide showcases information about shareholding pattern after funding. It covers share distribution among founders, pre seed investors, venture capitalists and investors. Deliver an outstanding presentation on the topic using this Shareholding Pattern Recruitment Solutions Agency Investment Ask Pitch Deck Dispense information and present a thorough explanation of Shares Percentage, Venture Capitalist, Shareholding Pattern using the slides given. This template can be altered and personalized to fit your needs. It is also available for immediate download. So grab it now.
-
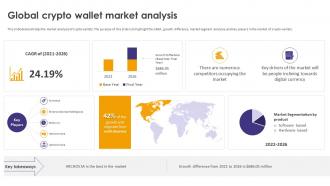 Crypto Wallets Types And Applications Global Crypto Wallet Market Analysis
This slide demonstrates the market analysis of crypto wallets. The purpose of this slide is to highlight the CAGR, growth difference, market segment analysis, and key players in the market of crypto wallets. Deliver an outstanding presentation on the topic using this Crypto Wallets Types And Applications Global Crypto Wallet Market Analysis. Dispense information and present a thorough explanation of Market Analysis Of Crypto Wallets, Market Segment Analysis, Market Segmentation By Product using the slides given. This template can be altered and personalized to fit your needs. It is also available for immediate download. So grab it now.
-
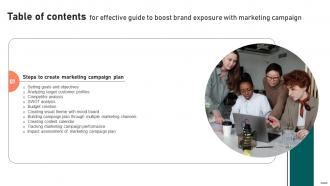 Y216 Effective Guide To Boost Brand Exposure With Marketing Campaign Table Of Contents Strategy SS V
Increase audience engagement and knowledge by dispensing information using Y216 Effective Guide To Boost Brand Exposure With Marketing Campaign Table Of Contents Strategy SS V. This template helps you present information on one stages. You can also present information on Create Marketing Campaign Plan using this PPT design. This layout is completely editable so personaize it now to meet your audiences expectations.
-
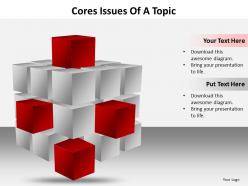 Business powerpoint templates cores issues of topic editable sales ppt slides
This PowerPoint Diagram shows the 3D bricks placed upon one another. It consists of some red bricks which represent the Core Issues of topic about which you want to Discuss. This Powerpoint Diagram will fit for Business Presentations.
-
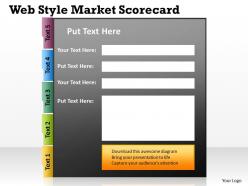 Web style market scorecard powerpoint slides presentation diagrams templates
We are proud to present our web style market scorecard powerpoint slides presentation diagrams templates. Emphatically define your message with our above template which contains a graphic of market scorecard. It is a graphical representation of the progress over time of some entity toward some specified goal or goals. The ideas and plans are on your finger tips. Now imprint them on the minds of your audience via our slides.
-
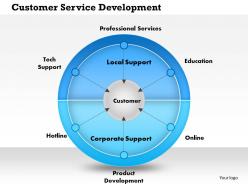 0514 customer service development powerpoint presentation
We are proud to present our 0514 customer service development powerpoint presentation. Use this template for customer service development process. Use our creative template to lay down your views. Go ahead and add charm to your presentations with high quality PPT slide.
-
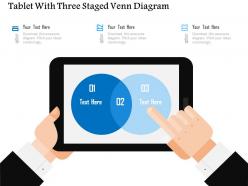 Tablet with three staged venn diagram flat powerpoint design
Proofing and editing can be done with ease in PPT design. Presentation slide is of utmost use to management professionals, big or small organizations and business startups. Smooth functioning is ensured by the presentation slide show on all software’s. When projected on the wide screen the PPT layout does not sacrifice on pixels or color resolution.
-
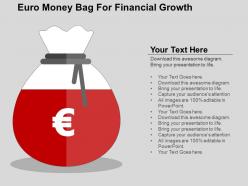 Euro money bag for financial growth flat powerpoint design
We are proud to present our euro money bag for financial growth flat powerpoint design. Graphic of euro money bag has been used to design this power point template diagram. This PPT diagram contains the concept of financial growth. Use this PPT diagram for business and finance related presentations.
-
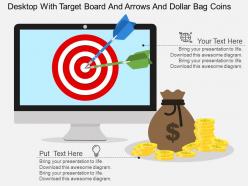 Wj desktop with target board and arrows and dollar bag coins flat powerpoint design
Presenting wj desktop with target board and arrows and dollar bag coins flat powerpoint design. This Power Point template diagram has been crafted with graphic of desktop, dollar bag and target board diagram. This PPT diagram contains the concept of target achievement and financial analysis Use this PPT diagram for business and finance related presentations.
-
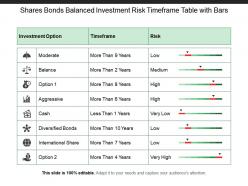 Shares bonds balanced investment risk timeframe table with bars
Presenting this set of slides with name - Shares Bonds Balanced Investment Risk Timeframe Table With Bars. This is a two stage process. The stages in this process are Investment Risk, Financial Risk, Risk Management.
-
 Stack of coins lying beside money bag
Presenting this set of slides with name - Stack Of Coins Lying Beside Money Bag. This is a two stage process. The stages in this process are Stack Of Coins, Queue Of Penny, Pile Of Coins.
-
 Businessman deposits money in bank icon
Presenting this set of slides with name Businessman Deposits Money In Bank Icon. This is a three stage process. The stages in this process are Businessman Deposits Money In Bank Icon. This is a completely editable PowerPoint presentation and is available for immediate download. Download now and impress your audience.
-
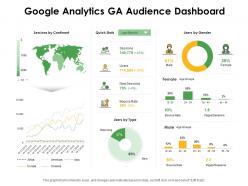 Google analytics ga audience dashboard ppt powerpoint presentation pictures format
Presenting this set of slides with name Google Analytics GA Audience Dashboard Ppt Powerpoint Presentation Pictures Format. The topics discussed in these slides are Sessions, Male, Female. This is a completely editable PowerPoint presentation and is available for immediate download. Download now and impress your audience.
-
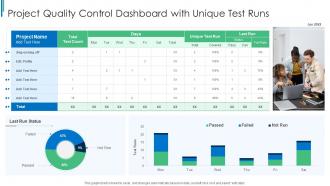 Project Quality Control Dashboard Snapshot With Unique Test Runs
This graph or chart is linked to excel, and changes automatically based on data. Just left click on it and select edit data. Presenting our well structured Project Quality Control Dashboard Snapshot With Unique Test Runs. The topics discussed in this slide are Total Test Count, Last Run Status, Test Runs. This is an instantly available PowerPoint presentation that can be edited conveniently. Download it right away and captivate your audience.
-
 Human Resource Management Dashboard With Employee Satisfaction Ratio
This slide shows the features of the HR management system software and the outcomes that could be extracted from it. It includes new hires and termination numbers, compensation , number of total employees , women ratio percent, etc. Introducing our Human Resource Management Dashboard With Employee Satisfaction Ratio set of slides. The topics discussed in these slides are Employees By Role, Number Of Employees By Location, New Hires And Terminations, Compensation. This is an immediately available PowerPoint presentation that can be conveniently customized. Download it and convince your audience.
-
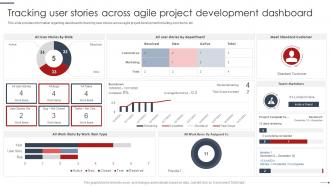 Agile Project Management Playbook Tracking User Stories Across Agile Project Development
This slide provides information regarding dashboard for tracking user stories across agile project development including work items, etc. Deliver an outstanding presentation on the topic using this Agile Project Management Playbook Tracking User Stories Across Agile Project Development. Dispense information and present a thorough explanation of Meet Standard Customer, Standard Customer, Team Members using the slides given. This template can be altered and personalized to fit your needs. It is also available for immediate download. So grab it now.
-
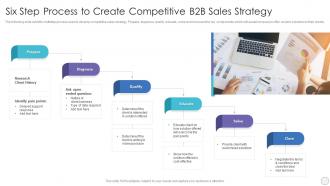 Six Step Process To Create Competitive B2B Sales Strategy
The following slide exhibits multistep process used to develop competitive sales strategy. Prepare, diagnose, qualify, educate, solve and close are the key components which will assist company to offer custom solutions to their clients. Introducing our premium set of slides with Six Step Process To Create Competitive B2B Sales Strategy. Ellicudate the six stages and present information using this PPT slide. This is a completely adaptable PowerPoint template design that can be used to interpret topics like Research, Client History, Qualify, Educate, Solve, Diagnose, Prepare. So download instantly and tailor it with your information.
-
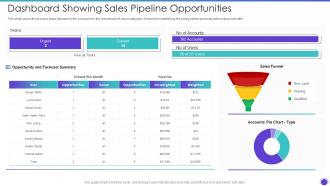 Dashboard Showing Sales Pipeline Opportunities Sales Pipeline Management Strategies
This slide shows the process steps followed by the company for the recruitment of new employees. It stars from Identifying the hiring needs and ends with employment offer Present the topic in a bit more detail with this Dashboard Showing Sales Pipeline Opportunities Sales Pipeline Management Strategies. Use it as a tool for discussion and navigation on Opportunities, Value, Opportunities, Weighted. This template is free to edit as deemed fit for your organization. Therefore download it now
-
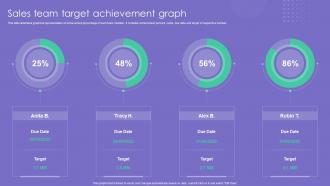 Sales Team Target Achievement Graph
This slide illustrates graphical representation of achievement percentage of each team member. It includes achievement percent, name, due date and target of respective member. Introducing our Sales Team Target Achievement Graph set of slides. The topics discussed in these slides are Sales, Team, Target Achievement Graph. This is an immediately available PowerPoint presentation that can be conveniently customized. Download it and convince your audience.
-
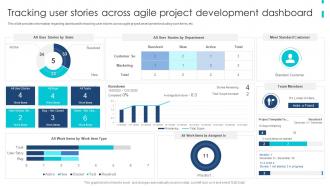 Agile Product Development Playbook Tracking User Stories Across Agile Project Development Dashboard
This slide provides information regarding dashboard for tracking user stories across agile project development including work items, etc. Present the topic in a bit more detail with this Agile Product Development Playbook Tracking User Stories Across Agile Project Development Dashboard. Use it as a tool for discussion and navigation on Meet Standard Customer, Standard Customer, Team Members. This template is free to edit as deemed fit for your organization. Therefore download it now.
-
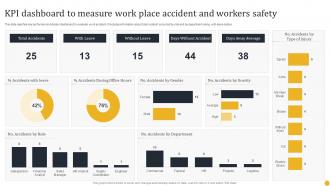 KPI Dashboard To Measure Work Place Accident And Workers Safety
This slide signifies key performance indicator dashboard to evaluate work accident. It includes information about total incident occurred by role and by department along with leave status. Presenting our well-structured KPI Dashboard To Measure Work Place Accident And Workers Safety. The topics discussed in this slide are KPI Dashboard, Measure Work Place, Accident, Workers Safety. This is an instantly available PowerPoint presentation that can be edited conveniently. Download it right away and captivate your audience.
-
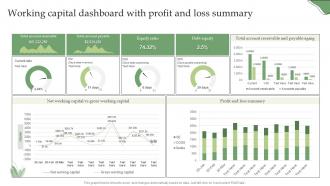 Working Capital Dashboard With Profit And Loss Summary
Presenting our well-structured Working Capital Dashboard With Profit And Loss Summary. The topics discussed in this slide are Working Capital Dashboard, Profit And Loss Summary. This is an instantly available PowerPoint presentation that can be edited conveniently. Download it right away and captivate your audience.
-
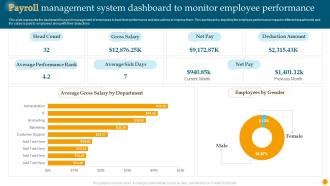 Payroll Management System Dashboard To Monitor Employee Performance
This slide represents the dashboard for payroll management of employees to track their performance and take actions to improve them. This dashboard is depicting the employee performance impact in different departments and the salary is paid to employees along with their deductions. Introducing our Payroll Management System Dashboard To Monitor Employee Performance set of slides. The topics discussed in these slides are Head Count, Gross Salary, Deduction Amount. This is an immediately available PowerPoint presentation that can be conveniently customized. Download it and convince your audience.
-
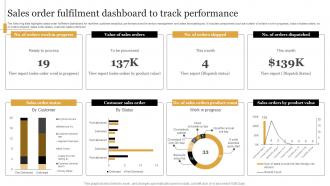 Sales Order Fulfilment Dashboard To Track Performance
The following slide highlights sales order fulfilment dashboard for real time customer analytics, performance and inventory management and sales forecasting etc. It includes components such as number of orders work in progress, value of sales orders, no. of orders shipped, sales order status, customer sales orders etc. Presenting our well structured Sales Order Fulfilment Dashboard To Track Performance. The topics discussed in this slide are Sales, Track, Performance. This is an instantly available PowerPoint presentation that can be edited conveniently. Download it right away and captivate your audience.
-
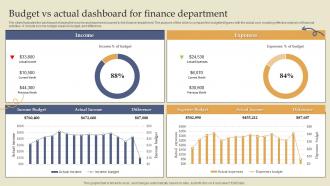 Budget Vs Actual Dashboard For Finance Department
The slide illustrates the dashboard showing the income and expenses incurred by the finance department. The purpose of this slide is compare the budgeted figures with the actual cost, enabling effective analysis of financial activities. It include income budget, expense budget, and difference. Introducing our Budget Vs Actual Dashboard For Finance Department set of slides. The topics discussed in these slides are Budget, Actual Dashboard, Finance Department. This is an immediately available PowerPoint presentation that can be conveniently customized. Download it and convince your audience.
-
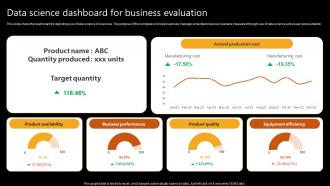 Data Science Dashboard For Business Evaluation
This slide shoes the dashboard for depicting use of data science in business. The purpose of this template is to help business manager understand various business measures through use of data science and visual representation. Introducing our Data Science Dashboard For Business Evaluation set of slides. The topics discussed in these slides are Business Performance, Equipment Efficiency. This is an immediately available PowerPoint presentation that can be conveniently customized. Download it and convince your audience.
-
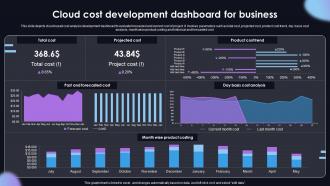 Cloud Cost Development Dashboard For Business
This slide depicts cloud based cost analysis development dashboard to evaluate forecasted and current cost of project. It involves parameters such as total cost, projected cost, product cost trend, day basis cost analysis, month wise product costing and historical and forecasted cost. Presenting our well structured Cloud Cost Development Dashboard For Business. The topics discussed in this slide are Projected Cost, Product Cost Trend.This is an instantly available PowerPoint presentation that can be edited conveniently. Download it right away and captivate your audience.
-
 Stars in circle line 3d shinning powerpoint slides and ppt templates db
These high quality, editable pre-designed powerpoint slides and powerpoint templates have been carefully created by our professional team to help you impress your audience. Each graphic in every powerpoint slide is vector based and is 100% editable in powerpoint.Each and every property of any slide - color, size, shading etc can be modified to build an effective powerpoint presentation. Use these slides to convey complex business concepts in a simplified manner. Any text can be entered at any point in the powerpoint slide. Simply DOWNLOAD, TYPE and PRESENT
-
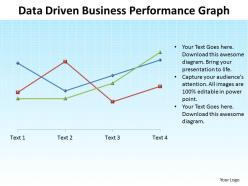 Data driven business performance line graph powerpoint templates 0712
It can really be used for displaying a running strip chart of any realtime data
-
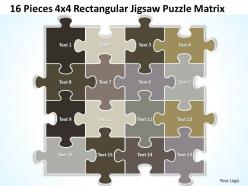 16 pieces 4x4 rectangular jigsaw puzzle matrix powerpoint templates 0812
This template is skillfully designed and is completely editable to suit all the needs and requirements of the user. The color of the font, its size, style, and all other elements can be customized according to the user's desire The text in the PPT placeholder can be replaced with the desired information making this template highly flexible and adaptable as well. This template is also compatible with various Microsoft versions and formats like Google Slides, JPG, PDF, etc so the user will face no issue in saving it in the format of his choice.
-
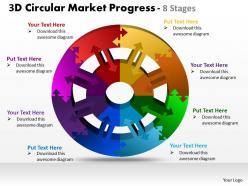 3d circular market progress 8 stages powerpoint templates graphics slides 0712
Use to show a progression or a sequence of stages, tasks, or events in a circular flow. Emphasizes the interconnected pieces.
-
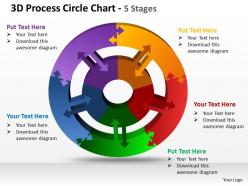 3d process circle chart 5 stages powerpoint templates graphics slides 0712
circle diagram shows an organized view of business services and processes.
-
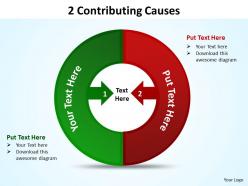 2 contributing causes powerpoint diagrams presentation slides graphics 0912
With the assistance of this Diagram, you can can uncover chains of causal links that will lead you to contributing factors of the problem and allow them to implement effective barriers and solutions.
-
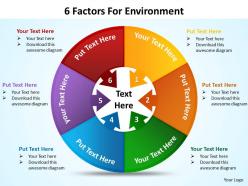 6 factors for environment powerpoint diagrams presentation slides graphics 0912
This diagram can be very helpful on business and meeting presentations where you need to discuss environmental factors
-
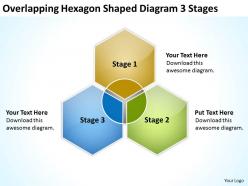 Business diagram examples overlapping hexagon shaped 3 stages powerpoint templates
We are proud to present our business diagram examples overlapping hexagon shaped 3 stages powerpoint templates. The above PowerPoint template displays hexagon shaped overlapping diagram. This diagram demonstrations relation between overlapping processes in production, commercial activity or in marketing sphere. You can change color, size and orientation of any icon to your liking.
-
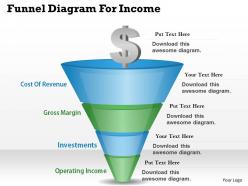 0314 business ppt diagram funnel diagram for income powerpoint template
Modify and personalize the presentation by including the company name and logo. Guidance for executing the changes has been provided for assistance. Fully inspired and editable PPT slide visual. Useful for sales executives, marketers, business professionals, analysts, strategists, students, teachers, etc. Easily and effortlessly modifiable by any user at any time without even having any specialized knowledge. Compatible with Microsoft office software and the Google slides. Available to be saved in jpg or pdf format.
-
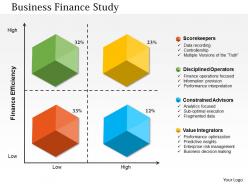 0714 business finance study powerpoint presentation slide template
Noteworthy top notch PPT visuals. Pictures don't pixelate when anticipated on wide screen. Aftereffect of inborn research and conceptualizing done by our specialists. Good with various programming and organization choices. 100 percent editable slide plan. Customize the substance with organization particular name and logo. Utilized by the little and broad scale associations, specialists, agents, and business visionaries exploration office, IT division, and advertisers.


