Finance PowerPoint Templates, Presentation Slide Diagrams & PPT Graphics
- Sub Categories
-
- 30 60 90 Day Plan
- Advertising
- Agile Development
- Aims and Objectives
- Arrows
- Before and After
- Blockchain Bitcoin
- Boxes
- Business
- Calender
- Case Study
- Celebrations
- Certificates
- Challenges Opportunities
- Channel Distribution
- Children
- Communication
- Competitive Landscape
- Computer
- Concepts
- Construction Management
- Corporate
- Crowdfunding
- Current State Future State
- Custom PowerPoint Diagrams
- Digital Transformation
- Dos and Donts
- Economics
- Education
- Environment
- Events
- Festival
- Finance
- Financials
- Food
- Game
- Gap Analysis
- Generic
- Geographical
- Health
- Heatmaps
- Holidays
- Icons
- Input Process Output
- Internet
- Key Messages
- Key Wins
- Ladder
- Leadership
- Lists
- Lucky Draw
- Management
- Marketing
- Measuring
- Medical
- Music
- News
- Next Steps
- People Process Technology
- Pillars
- Planning
- Post-it-Notes
- Problem Statement
- Process
- Proposal Management
- Pros and Cons
- Puzzle
- Puzzles
- Recruitment Strategy
- Religion
- Research and Development
- Risk Mitigation Strategies
- Roadmap
- Selling
- Shapes
- Short Term Long Term
- Social
- Stairs
- Start Stop Continue
- Strategy
- Symbol
- Technology
- Thesis Defense Dissertation
- Timelines
- Traffic
- Transition Plan
- Transportation
- Vehicles
- Venture Capital Funding
- Warning
- Winners
- Word Cloud
-
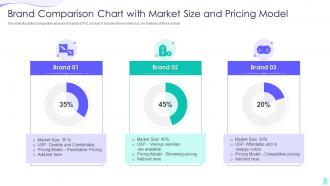 Brand Comparison Chart With Market Size And Pricing Model
This slide illustrates comparative analysis of brands of XYZ product. It includes their market size, key features of these brands. Present the topic in a bit more detail with this Brand Comparison Chart With Market Size And Pricing Model. Use it as a tool for discussion and navigation on Market Size, Pricing Model, Competitive Pricing. This template is free to edit as deemed fit for your organization. Therefore download it now.
-
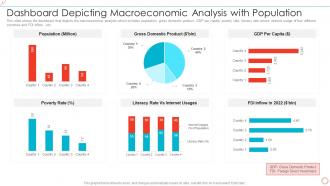 Dashboard Depicting Macroeconomic Analysis With Population
This slide shows the dashboard that depicts the macroeconomic analysis which includes population, gross domestic product, GDP per capita, poverty rate, literacy rate verses internet usage of four different countries and FDI inflow , etc. Introducing our Dashboard Depicting Macroeconomic Analysis With Population set of slides. The topics discussed in these slides are Population Million, Gross Domestic Product, GDP Per Capita, Poverty Rate, Literacy Rate Vs Internet Usages, FDI Inflow In 2022. This is an immediately available PowerPoint presentation that can be conveniently customized. Download it and convince your audience.
-
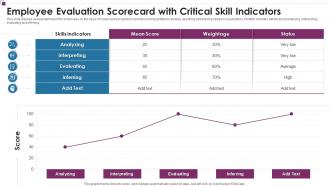 Employee Evaluation Scorecard With Critical Skill Indicators
This slide displays assessment report for employees on the basis of mean score acquired in problem solving abilities to analyze upskilling and training needs in organization. It further includes details about analyzing, interpreting, evaluating and inferring. Presenting our well structured Employee Evaluation Scorecard With Critical Skill Indicators. The topics discussed in this slide are Interpreting, Evaluating, Analyzing, Weightage. This is an instantly available PowerPoint presentation that can be edited conveniently. Download it right away and captivate your audience.
-
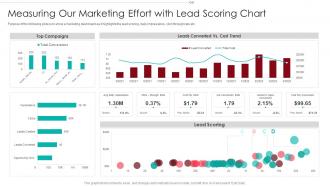 B2B Marketing Sales Qualification Process Measuring Our Marketing Effort With Lead Scoring Chart
Purpose of the following slide is to show a marketing dashboard as it highlights the lead scoring, daily impressions, click through rate etc. Present the topic in a bit more detail with this B2B Marketing Sales Qualification Process Measuring Our Marketing Effort With Lead Scoring Chart. Use it as a tool for discussion and navigation on Measuring Our Marketing Effort With Lead Scoring Chart. This template is free to edit as deemed fit for your organization. Therefore download it now.
-
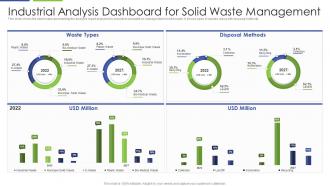 Industrial Analysis Dashboard For Solid Waste Management
This slide shows the dashboard representing the analysis report prepared by industrial specialist on management of solid waste. It shows types of wastes along with disposal methods. Introducing our Industrial Analysis Dashboard For Solid Waste Management set of slides. The topics discussed in these slides are Waste Types, Disposal Methods, USD Million. This is an immediately available PowerPoint presentation that can be conveniently customized. Download it and convince your audience.
-
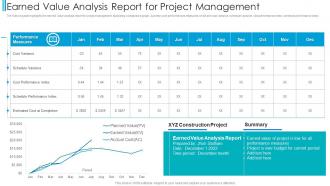 Earned Value Analysis Report For Project Management
The following slide highlights the earned value analysis report for project management illustrating comparative graph, summary and performances measures which are cost variance, schedule variance, cost performance index, schedule performance index. Introducing our Earned Value Analysis Report For Project Management set of slides. The topics discussed in these slides are Earned Value Analysis Report For Project Management. This is an immediately available PowerPoint presentation that can be conveniently customized. Download it and convince your audience.
-
 Financial Project Problems And Their Impact Icon
Presenting our set of slides with Financial Project Problems And Their Impact Icon. This exhibits information on four stages of the process. This is an easy to edit and innovatively designed PowerPoint template. So download immediately and highlight information on Financial Project Problems And Their Impact Icon.
-
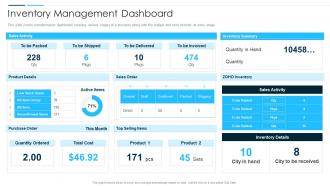 Digital Business Revolution Inventory Management Dashboard
This slide covers transformation dashboard covering various stages of a business along with the budget and risks involved at every stage. Deliver an outstanding presentation on the topic using this Digital Business Revolution Inventory Management Dashboard. Dispense information and present a thorough explanation of Inventory Management Dashboard using the slides given. This template can be altered and personalized to fit your needs. It is also available for immediate download. So grab it now.
-
 Online Retail Marketing Dashboards To Measure Performance Of Mobile Marketing
This following slide displays the key metrics that can help an organization to measure effectiveness of mobile marketing strategies. These can be top performing campaigns, devises used for transactions etc. Present the topic in a bit more detail with this Online Retail Marketing Dashboards To Measure Performance Of Mobile Marketing. Use it as a tool for discussion and navigation on Mobile Revenue, Abandonment Rate, Top Performing Campaigns. This template is free to edit as deemed fit for your organization. Therefore download it now.
-
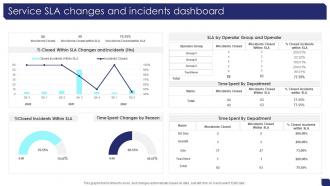 Service SLA Changes And Incidents Dashboard
Presenting our well structured Service SLA Changes And Incidents Dashboard. The topics discussed in this slide are Closed Within, Operator Group, Incidents Dashboard. This is an instantly available PowerPoint presentation that can be edited conveniently. Download it right away and captivate your audience.
-
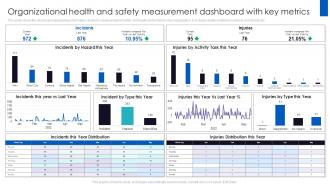 Organizational Health And Safety Measurement Dashboard With Key Metrics
This slide shows the dashboard representing information related to measurement of safety and health performance of an organization. It includes details related to incidents and injuries etc. Introducing our Organizational Health And Safety Measurement Dashboard With Key Metrics set of slides. The topics discussed in these slides are Organizational Health, Safety Measurement, Dashboard. This is an immediately available PowerPoint presentation that can be conveniently customized. Download it and convince your audience.
-
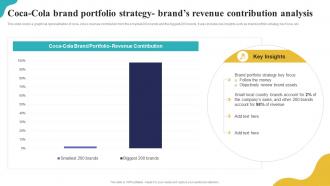 Coca Cola Brand Portfolio Strategy Brands Revenue Brand Portfolio Strategy Guide
This slide covers a graphical representation of coca- colas revenue contribution from the smallest 200 brands and the biggest 200 brands. It also includes key insights such as brand portfolio strategy key focus, etc. Deliver an outstanding presentation on the topic using this Coca Cola Brand Portfolio Strategy Brands Revenue Brand Portfolio Strategy Guide. Dispense information and present a thorough explanation of Coca Cola Brand, Portfolio Revenue Contribution, Brand Portfolio Strategy using the slides given. This template can be altered and personalized to fit your needs. It is also available for immediate download. So grab it now.
-
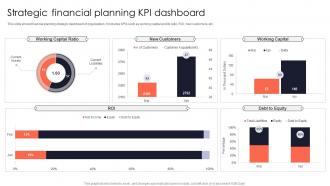 Strategic Financial Planning KPI Dashboard
This slide shows financial planning strategic dashboard of organization. It includes KPIs such as working capital and its ratio,ROI,new customers,etc. Introducing our Strategic Financial Planning KPI Dashboard set of slides. The topics discussed in these slides are Working Capital Ratio,New Customers,Working Capital,Debt To Equity. This is an immediately available PowerPoint presentation that can be conveniently customized. Download it and convince your audience.
-
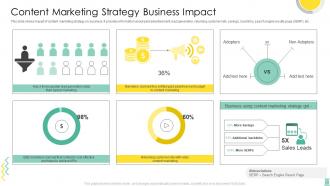 Content Marketing Strategy Business Impact
This slide shows impact of content marketing strategy on business. It provides information about paid advertisement, lead generation, returning customer rate, savings, backlinks, search engine results page SERP, etc. Presenting our well structured Content Marketing Strategy Business Impact. The topics discussed in this slide are Content Marketing, Strategy, Business Impact. This is an instantly available PowerPoint presentation that can be edited conveniently. Download it right away and captivate your audience.
-
 Employee Engagement Survey Result Analysis
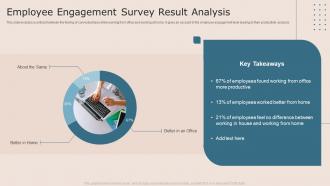
This slide includes a contrast between the feeling of connectedness while working from office and working at home. It gives an account of the employee engagement level leading to their productivity analysis. Presenting our well structured Employee Engagement Survey Result Analysis. The topics discussed in this slide are Employee Engagement, Survey, Result Analysis. This is an instantly available PowerPoint presentation that can be edited conveniently. Download it right away and captivate your audience.
-
 ERP Dashboard Highlighting Results Of Construction Quality Management
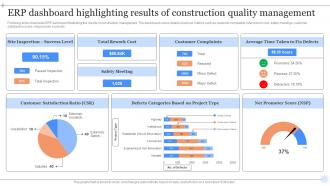
Following slide showcases ERP dashboard illustrating the results of construction management. The dashboard covers details of various metrics such as customer complaints, total rework cost, safety meetings, customer satisfaction score, net promotor score etc. Introducing our ERP Dashboard Highlighting Results Of Construction Quality Management set of slides. The topics discussed in these slides are Customer Satisfaction Ratio, Safety Meeting, Net Promoter Score. This is an immediately available PowerPoint presentation that can be conveniently customized. Download it and convince your audience.
-
 Website Performance Dashboard For Ecommerce Business Planning
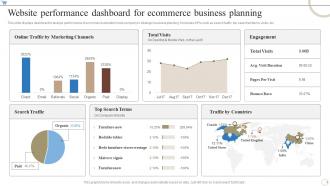
This slide displays dashboard to analyze performance of ecommerce website to help company in strategic business planning. It includes KPIs such as search traffic, top searched items, visits, etc. Introducing our Website Performance Dashboard For Ecommerce Business Planning set of slides. The topics discussed in these slides are Website Performance, Dashboard, Ecommerce Business Planning. This is an immediately available PowerPoint presentation that can be conveniently customized. Download it and convince your audience.
-
 Risk Landscape Dashboard With Cyber Attacks Analysis
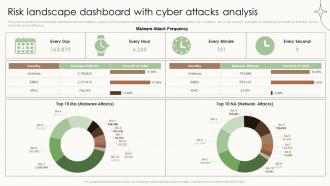
This slide illustrates risk landscape dashboard with cyber attacks analysis which contains malware attack frequency, country wise attacks, top 10 attacks, etc. It can assist IT managers in analyzing top threats so that they can be dealt with proper efficiency. Introducing our Risk Landscape Dashboard With Cyber Attacks Analysis set of slides. The topics discussed in these slides are Risk Landscape Icon, Financial Threat. This is an immediately available PowerPoint presentation that can be conveniently customized. Download it and convince your audience.
-
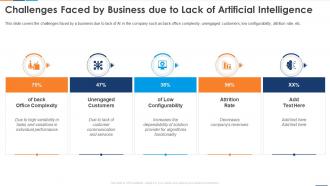 Reshaping Business With Artificial Challenges Faced By Business Due To Lack Of Artificial Intelligence
This slide covers the challenges faced by a business due to lack of AI in the company such as back office complexity, unengaged customers, low configurability, attrition rate, etc. Increase audience engagement and knowledge by dispensing information using Reshaping Business With Artificial Challenges Faced By Business Due To Lack Of Artificial Intelligence. This template helps you present information on five stages. You can also present information on Unengaged Customers, Low Configurability, Attrition Rate using this PPT design. This layout is completely editable so personalize it now to meet your audiences expectations
-
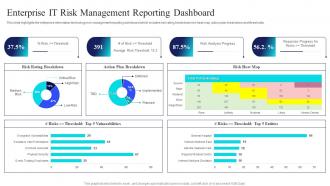 Enterprise IT Risk Management Risk Management Guide For Information Technology Systems
This slide highlights the enterprise information technology risk management reporting dashboard which includes risk rating breakdown risk heat map, action plan breakdown and thresholds. Present the topic in a bit more detail with this Enterprise IT Risk Management Risk Management Guide For Information Technology Systems. Use it as a tool for discussion and navigation on Risk Rating Breakdown, Action Plan Breakdown, Risk Heat Map. This template is free to edit as deemed fit for your organization. Therefore download it now.
-
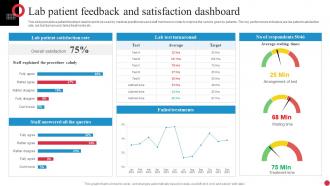 Lab Patient Feedback And Satisfaction Dashboard
This slide presents a patient feedback dashboard to be used by medical practitioners and staff members in order to improve the service given to patients. The key performance indicators are lab patient satisfaction rate, lab test turnaround, failed treatments etc. Introducing our Lab Patient Feedback And Satisfaction Dashboard set of slides. The topics discussed in these slides are Staff Answered, Lab Patient. This is an immediately available PowerPoint presentation that can be conveniently customized. Download it and convince your audience.
-
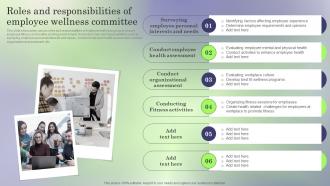 Roles And Responsibilities Of Creating Employee Value Proposition To Reduce Employee Turnover
This slide showcases various roles and responsibilities of employee wellness group to ensure employee fitness and healthy working environment. It includes roles and responsibilities such as surveying employee personal interests and needs , conduct employee health assessment, conduct organizational assessment, etc. Increase audience engagement and knowledge by dispensing information using Roles And Responsibilities Of Creating Employee Value Proposition To Reduce Employee Turnover. This template helps you present information on six stages. You can also present information on Employee, Organizational, Activities using this PPT design. This layout is completely editable so personaize it now to meet your audiences expectations.
-
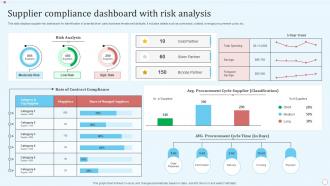 Supplier Compliance Dashboard With Risk Analysis
This slide displays supplier risk dashboard for identification of potential third party business threats and defaults. It includes details such as contracted, unlisted, average procurement cycle, etc. Presenting our well structured Supplier Compliance Dashboard With Risk Analysis. The topics discussed in this slide are Dashboard, Analysis, Supplier. This is an instantly available PowerPoint presentation that can be edited conveniently. Download it right away and captivate your audience.
-
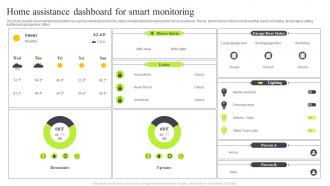 Home Assistance Dashboard For Smart Monitoring
This slide consists of a smart dashboard which is used by individuals to track the status of automated tools deployed for home assistance. The key performance metrics include weather report, lock status, temperature setting, lighting and garage door status Presenting our well structured Home Assistance Dashboard For Smart Monitoring. The topics discussed in this slide are Monitoring, Locks, Status. This is an instantly available PowerPoint presentation that can be edited conveniently. Download it right away and captivate your audience.
-
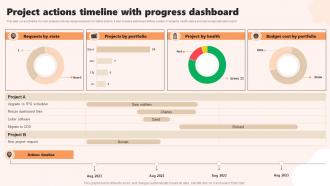 Project Actions Timeline With Progress Dashboard
This slide covers timeline for multi projects with key assigned person for stated actions. It also includes dashboard stating number of projects, health status and total budget allocated report. Presenting our well structured Project Actions Timeline With Progress Dashboard. The topics discussed in this slide are Dashboard, Progress, Timeline. This is an instantly available PowerPoint presentation that can be edited conveniently. Download it right away and captivate your audience.
-
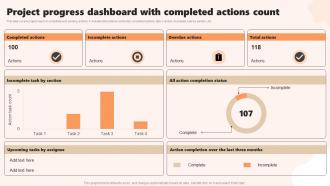 Project Progress Dashboard With Completed Actions Count
This slide covers project report on completed and pending actions. It includes total actions conducted, completed actions, task overdue, incomplete task by section ,etc. Presenting our well structured Project Progress Dashboard With Completed Actions Count. The topics discussed in this slide are Completed Actions, Incomplete Actions, Overdue Actions. This is an instantly available PowerPoint presentation that can be edited conveniently. Download it right away and captivate your audience.
-
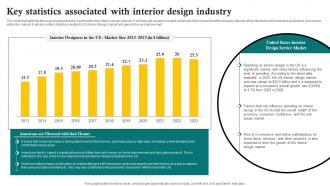 Key Statistics Associated With Interior Design Industry Sustainable Interior Design BP SS
This slide highlights the thorough assessment of a market within the interior design industry. It will help get valuable insights and project the success that the company expects while introducing its brand and products to consumers within the market. It will also reflect statistics related to US interior design market and general home improvement. Present the topic in a bit more detail with this Key Statistics Associated With Interior Design Industry Sustainable Interior Design BP SS. Use it as a tool for discussion and navigation on Key Statistics Associated, Interior Design Industry, Market Size. This template is free to edit as deemed fit for your organization. Therefore download it now.
-
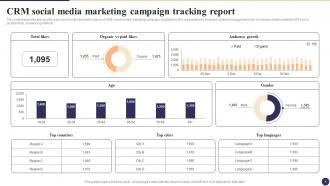 CRM Social Media Marketing Campaign Tracking Report CRM Marketing System Guide MKT SS V
This slide represents the report to track and monitor the performance of CRM social media marketing campaign organized by the organization to increase customer engagement rate. It includes details related to KPIs such as total likes, audience growth etc. Present the topic in a bit more detail with this CRM Social Media Marketing Campaign Tracking Report CRM Marketing System Guide MKT SS V. Use it as a tool for discussion and navigation on Audience Growth, Social Media Marketing, Campaign Tracking Report. This template is free to edit as deemed fit for your organization. Therefore download it now.
-
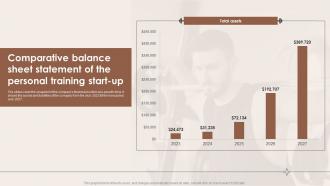 Comparative Balance Sheet Statement Of The Personal Training Specialized Training Business BP SS
The slides cover the snapshot of the companys financial position at a specific time. It shows the assets and liabilities of the company from the year 2023 till the forecasted year 2027. Present the topic in a bit more detail with this Comparative Balance Sheet Statement Of The Personal Training Specialized Training Business BP SS. Use it as a tool for discussion and navigation on Comparative Balance, Sheet Statement, Training Start Up. This template is free to edit as deemed fit for your organization. Therefore download it now.
-
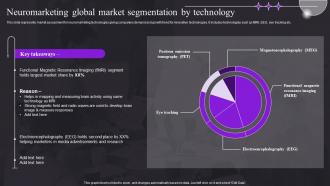 Neuromarketing Global Market Segmentation By Technology Study For Customer Behavior MKT SS V
This slide represents market assessment for neuromarketing technologies giving companies demand and growth trend for innovative technologies. It includes technologies such as fMRI, EEG, eye tracking etc. Deliver an outstanding presentation on the topic using this Neuromarketing Global Market Segmentation By Technology Study For Customer Behavior MKT SS V. Dispense information and present a thorough explanation of Positron Emission Tomography, Eye Tracking, Resonance Imaging using the slides given. This template can be altered and personalized to fit your needs. It is also available for immediate download. So grab it now.
-
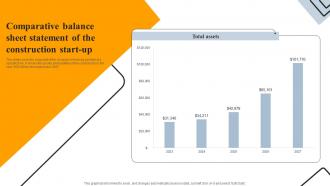 Comparative Balance Sheet Statement Engineering And Construction Business Plan BP SS
The slides cover the snapshot of the companys financial position at a specific time. It shows the assets and liabilities of the company from the year 2023 till the forecasted year 2027. Deliver an outstanding presentation on the topic using this Comparative Balance Sheet Statement Engineering And Construction Business Plan BP SS. Dispense information and present a thorough explanation of Balance, Comparative, Construction using the slides given. This template can be altered and personalized to fit your needs. It is also available for immediate download. So grab it now.
-
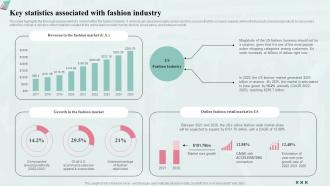 Key Statistics Associated With Fashion Industry Fashion Industry Business Plan BP SS
This slide highlights the thorough assessment of a market within the fashion industry. It will help get valuable insights and project the success that the company expects while introducing its brand and products to consumers within the market. It will also reflect statistics related to the online fashion retail market, fashion accessories, and footwear market. Deliver an outstanding presentation on the topic using this Key Statistics Associated With Fashion Industry Fashion Industry Business Plan BP SS. Dispense information and present a thorough explanation of Statistics, Revenue, Market using the slides given. This template can be altered and personalized to fit your needs. It is also available for immediate download. So grab it now.
-
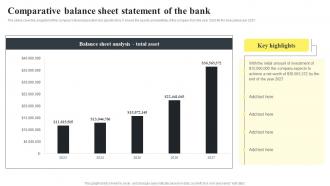 Comparative Balance Sheet Statement Of The Bank Banking Start Up B Plan BP SS
The slides cover the snapshot of the companys financial position at a specific time. It shows the assets and liabilities of the company from the year 2023 till the forecasted year 2027. Deliver an outstanding presentation on the topic using this Comparative Balance Sheet Statement Of The Bank Banking Start Up B Plan BP SS. Dispense information and present a thorough explanation of Comparative, Balance, Statement using the slides given. This template can be altered and personalized to fit your needs. It is also available for immediate download. So grab it now.
-
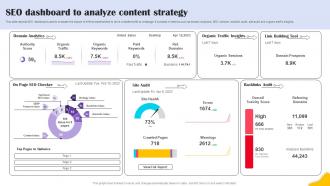 SEO Dashboard To Analyze Content Strategy Brands Content Strategy Blueprint MKT SS V
This slide depicts SEO dashboard used to evaluate the impact of efforts implemented to drive website traffic to webpage. It consists of metrics such as domain analytics, SEO checker, backlink audit, site audit and organic traffic insights. Deliver an outstanding presentation on the topic using this SEO Dashboard To Analyze Content Strategy Brands Content Strategy Blueprint MKT SS V. Dispense information and present a thorough explanation of Analyze, Content, Strategy using the slides given. This template can be altered and personalized to fit your needs. It is also available for immediate download. So grab it now.
-
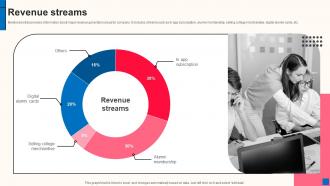 Revenue Streams Professional Career Advancement Investor Funding Elevator Pitch Deck
Mentioned slide provides information about major revenue generation areas for company. It includes streams such as In app subscription, alumni membership, selling college merchandise, digital alumni cards, etc. Present the topic in a bit more detail with this Revenue Streams Professional Career Advancement Investor Funding Elevator Pitch Deck. Use it as a tool for discussion and navigation on Digital Alumni Cards, Alumni Membership. This template is free to edit as deemed fit for your organization. Therefore download it now.
-
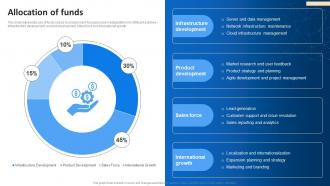 Allocation Of Funds Linkedin Series B Investor Funding Elevator Pitch Deck
This slide represents use of funds raised by employment-focused social media platform for different activities - infrastructure development, product development, sales force and international growth. Present the topic in a bit more detail with this Allocation Of Funds Linkedin Series B Investor Funding Elevator Pitch Deck. Use it as a tool for discussion and navigation on Infrastructure Development, Sales Force. This template is free to edit as deemed fit for your organization. Therefore download it now.
-
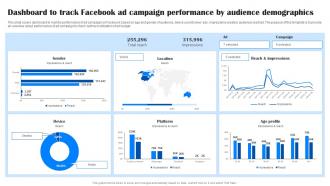 Comprehensive Guide To Facebook Dashboard To Track Facebook Ad Campaign Performance MKT SS
This slide covers dashboard to monitor performance of ad campaign on Facebook based on age and gender of audience, device used to view ads, impressions created, audience reached. The purpose of this template is to provide an overview about performance of ad campaign to check optimum utilization of ad budget. Present the topic in a bit more detail with this Comprehensive Guide To Facebook Dashboard To Track Facebook Ad Campaign Performance MKT SS. Use it as a tool for discussion and navigation on Platform, Reach And Impressions. This template is free to edit as deemed fit for your organization. Therefore download it now.
-
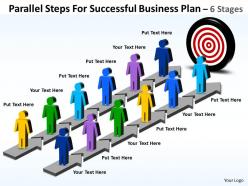 Business powerpoint templates parallel steps for successful plan sales ppt slides
This PowerPoint Diagram consists of the two parallel steps to reach the goal that is board. It portrays practice, procedure, proceeding, progress, progression, red tape, routine, rule, stage, step, suit, system, technique, transaction, trial, unfolding, way, wise, working.
-
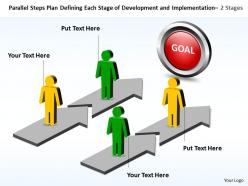 Business powerpoint templates parallel steps plan defining each stage of development and implementation sales ppt slides
This PowerPoint Diagram consists of two parallel processes each having two stages to reach the end point. This PowerPoint Diagram imitates the concept of action, advance, case, channels, red tape, routine, rule, development, evolution, fashion.
-
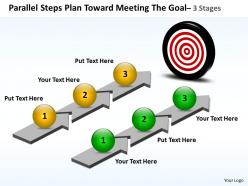 Business powerpoint templates parallel steps plan toward meeting the goal sales ppt slides
This PowerPoint Diagram shows the steps towards meeting the goal. This PowerPoint Diagram represents fortune, gain, good luck, good times, grand slam, and lap of luxury, laughter, maturation, profit, progress, prosperity, realization, reward, triumph, and victory.
-
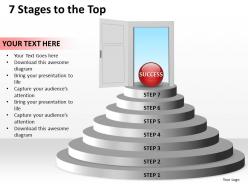 7 stages to the top powerpoint slides templates
Use this Interconnected PowerPoint Diagram to represent hierarchical relationship. This Diagram shows Staircase to reach the door of Success. It Consists of seven steps to reach the Destination. It signifies ancestry, breed, circle, company, condition, connection, coterie, cultural level, degree, derivation, extraction etc.
-
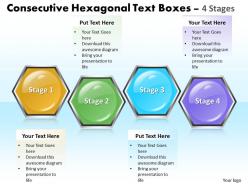 Business powerpoint templates consecutive hexagonal text boxes 4 stages sales ppt slides
This compelling graphics can be used showing relations and interfaces among various marketing activities.
-
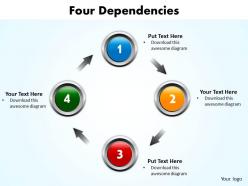 Four dependencies ppt slides presentation diagrams templates infographics images 21
Use this Recycle based PowerPoint Diagram to elaborate four interconnected issues which performs their actions in cycle. It shows interconnection through Arrows.
-
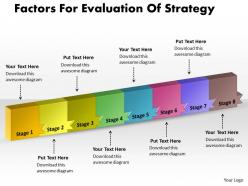 Ppt factors for evaluation of strategy business powerpoint templates 8 stages
This pre-designed and appealing process and workflow graphics for Microsoft PowerPoint offer an optimized possibility to illustrate your business strategy. Your audience will easily understand all key benefits. This template is editable and can be easily adjusted.
-
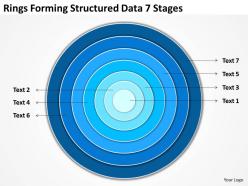 Business diagram examples rings forming structured data 7 stages powerpoint slides
We are proud to present our business diagram examples rings forming structured data 7 stages powerpoint slides. Develop competitive advantage with our above template. This diagram slideshows seven stages of concentric circles forming the data, project results and data comparisons. The structure of our templates allows you to effectively highlight the key issues concerning the growth of your business.
-
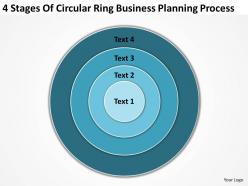 Business flow diagram example of circular ring planning process powerpoint templates
We are proud to present our business flow diagram example of circular ring planning process powerpoint templates. The above template displays a diagram of circular ring process. Use this diagram for depicting factors which influence on a final product or result. Show your audience the dependencies among parts of an organization or process.
-
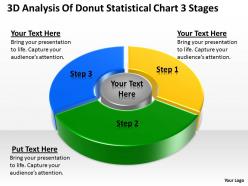 Business context diagrams 3d analysis of donut statistical chart stages powerpoint templates
We are proud to present our business context diagrams 3d analysis of donut statistical chart stages powerpoint templates. Donut Charts are identical to pie charts. Deliver unique Microsoft office PPT Presentations with our above diagram. This diagram display proportions and distributions. Use this diagram for business presentations on corporate structure, business strategies, and strategic business management.
-
 0115 graphic of pound with loading symbol of profit powerpoint template
We are proud to present our 0115 graphic of pound with loading symbol of profit powerpoint template. Graphic of pound with loading symbol has been used to craft this power point template. This PPT contains the concept of profit in finance. This PPT is suitable for business and finance related presentations.
-
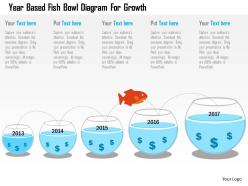 Year based fish bowl diagram for growth flat powerpoint design
We are proud to present our year based fish bowl diagram for growth flat powerpoint design. This power point template diagram has been crafted with graphic of fish bowl. This PPT diagram contains the concept of growth. Use this PPT diagram for year based business growth and build quality presentation.
-
 Ei money bag full with dollars flat powerpoint design
Presenting ei money bag full with dollars flat powerpoint design. This Power Point template diagram has been crafted with graphic of money bag and dollars . This PPT diagram contains the concept of financial investment analysis .Use this PPT diagram for business and finance related presentations.
-
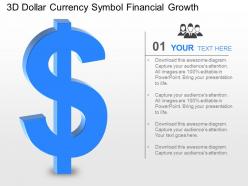 Jg 3d dollar currency symbol financial growth powerpoint template
Presenting jg 3d dollar currency symbol financial growth powerpoint template. This Power Point template diagram has been crafted with graphic of 3d dollar currency symbol diagram. This PPT diagram contains the concept of financial growth and money issues representation. Use this PPT diagram for business and marketing related presentations.
-
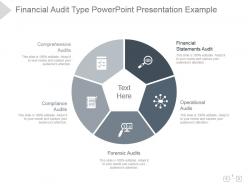 Financial audit type powerpoint presentation example
Presenting financial audit type powerpoint presentation example. Presenting financial audit type powerpoint presentation example. This is a financial audit type powerpoint presentation example. This is a five stage process. The stages in this process are financial statements audit, operational audis, forensic audits, compliance audits, comprehensive audits.
-
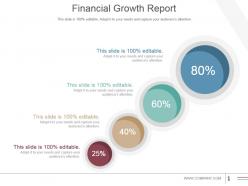 Financial growth report powerpoint slide background picture
Presenting financial growth report powerpoint slide background picture. This is a financial growth report powerpoint slide background picture. This is a four stage process. The stages in this process are business, percentage, finance, strategy, growth, success.
-
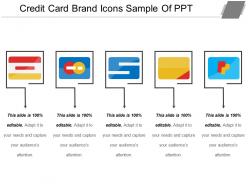 Credit card brand icons sample of ppt
Presenting credit card brand icons sample of PPT slide which is 100% editable. This PPT template is crafted with attractive display and unique components. This PPT slide is easy to customize and enables you to personalize it as per your own criteria. The presentation slide is fully compatible with Google slides, multiple format and software options. In case of any assistance, kindly take instructions from our presentation design services and it is easy to download in a very short span of time. The images, layouts, designs are of high quality and ensures quality in widescreen.
-
 Credit card icons design ppt sample download
Presenting credit card icon design PPT sample download. PPT is fully editable. Information regarding important aspects of the credit card and business may easily be inserted into the text placeholders provided in PPT diagram. All PowerPoint components are 100% editable to suit the user’s needs and preferences. PPT can be downloaded and converted into JPEG and PDF formats. The slideshow is completely compatible with Google Slides and PowerPoint.
-
 Zero based budget process activity and output ppt icon
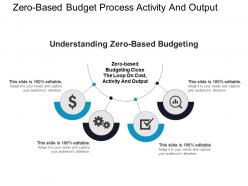
Presenting zero based budget process activity and output PPT icon PPT slide. Get this slide which is completely editable. Download it in various format including JPG and PDF formats. It can be viewed on 2 screen sizes i.e. standard screen and widescreen. The user can add the related content in text placeholder of this zero based budgeting process template. Its compatibility with Google Slides makes it accessible at once. Make changes in its color, font style and font size as per your requirement.
-
 Methods to increase revenue powerpoint presentation
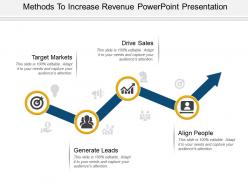
Presenting methods to increase revenue powerpoint presentation. This is a methods to increase revenue powerpoint presentation. This is a four stage process. The stages in this process are increase revenue, increase sales, growth.
-
 Five point account payable infographic powerpoint slide show
Presenting five point account payable infographic PowerPoint slideshow PowerPoint shape which is 100% editable. This PPT slide is easy to customize and enables you to personalize it as per your own criteria. The presentation slide is fully compatible with Google slides, multiple format and software options. In case of any assistance, kindly take instructions from our presentation design services and it is easy to download in a very short span of time. The images, layouts, designs are of high quality and ensures quality in widescreen.
-
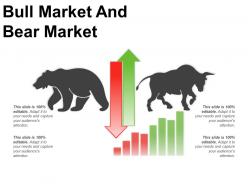 Bull market and bear market good ppt example
Presenting Bull Market And Bear Market Good PPT Example. This is a fully customizable template that is entirely under your control. You can change anything in this slide and make it apt your presentation. Modify the colors, the font type, and the font size as per your choice. We offer you high-resolution graphics that can be transformed into JPG and PDF formats. This is completely adaptable with the Google Slides. Download this slide in standard screen and widescreen.
-
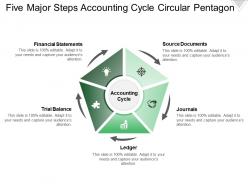 Five major steps accounting cycle circular pentagon
Presenting this set of slides with name - Five Major Steps Accounting Cycle Circular Pentagon. This is a five stage process. The stages in this process are Accounting Process, Accounting Cycle, Accounting Management.


