Finance PowerPoint Templates, Presentation Slide Diagrams & PPT Graphics
- Sub Categories
-
- 30 60 90 Day Plan
- Advertising
- Agile Development
- Aims and Objectives
- Arrows
- Before and After
- Blockchain Bitcoin
- Boxes
- Business
- Calender
- Case Study
- Celebrations
- Certificates
- Challenges Opportunities
- Channel Distribution
- Children
- Communication
- Competitive Landscape
- Computer
- Concepts
- Construction Management
- Corporate
- Crowdfunding
- Current State Future State
- Custom PowerPoint Diagrams
- Digital Transformation
- Dos and Donts
- Economics
- Education
- Environment
- Events
- Festival
- Finance
- Financials
- Food
- Game
- Gap Analysis
- Generic
- Geographical
- Health
- Heatmaps
- Holidays
- Icons
- Input Process Output
- Internet
- Key Messages
- Key Wins
- Ladder
- Leadership
- Lists
- Lucky Draw
- Management
- Marketing
- Measuring
- Medical
- Music
- News
- Next Steps
- People Process Technology
- Pillars
- Planning
- Post-it-Notes
- Problem Statement
- Process
- Proposal Management
- Pros and Cons
- Puzzle
- Puzzles
- Recruitment Strategy
- Religion
- Research and Development
- Risk Mitigation Strategies
- Roadmap
- Selling
- Shapes
- Short Term Long Term
- Social
- Stairs
- Start Stop Continue
- Strategy
- Symbol
- Technology
- Thesis Defense Dissertation
- Timelines
- Traffic
- Transition Plan
- Transportation
- Vehicles
- Venture Capital Funding
- Warning
- Winners
- Word Cloud
-
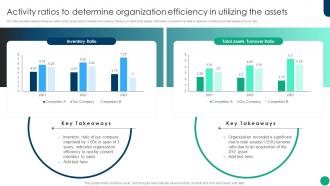 Financial Planning And Analysis Best Practices Activity Ratios To Determine Organization Efficiency
The following slide outlines efficiency ratios which can be used to indicate the company efficiency in utilizing the assets. Information covered in this slide is related to inventory and total assets turnover ratio. Present the topic in a bit more detail with this Financial Planning And Analysis Best Practices Activity Ratios To Determine Organization Efficiency. Use it as a tool for discussion and navigation on Inventory Ratio, Total Assets Turnover Ratio, Determine Organization Efficiency. This template is free to edit as deemed fit for your organization. Therefore download it now.
-
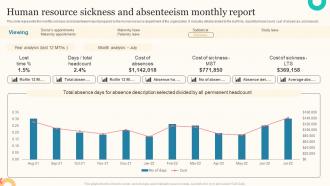 Human Resource Sickness And Absenteeism Monthly Report
This slide represents the monthly sickness and absenteeism report prepared by the human resource department of the organization. It includes details related to the lost time, days total head count, cost of absences, sickness etc. Presenting our well structured Human Resource Sickness And Absenteeism Monthly Report. The topics discussed in this slide are Human Resource Sickness, Absenteeism Monthly Report, Cost Of Sickness. This is an instantly available PowerPoint presentation that can be edited conveniently. Download it right away and captivate your audience.
-
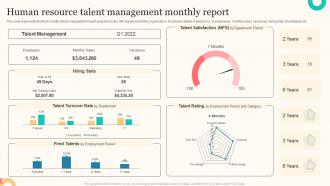 Human Resource Talent Management Monthly Report
This slide represents the three months talent management report prepared by the HR department of the organization. It includes details related to no. of employees, monthly salary, vacancies, hiring stats, fired talents etc. Introducing our Human Resource Talent Management Monthly Report set of slides. The topics discussed in these slides are Talent Management, Hiring Stats, Talent Turnover Rate. This is an immediately available PowerPoint presentation that can be conveniently customized. Download it and convince your audience.
-
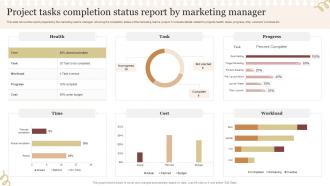 Project Tasks Completion Status Report By Marketing Manager
This slide shows the report prepared by the marketing teams manager showing the completion status of the marketing teams project. It includes details related to projects health, tasks, progress, time, cost and workload etc. Presenting our well structured Project Tasks Completion Status Report By Marketing Manager. The topics discussed in this slide are Project Tasks Completion Status, Report By Marketing Manager, Workload. This is an instantly available PowerPoint presentation that can be edited conveniently. Download it right away and captivate your audience.
-
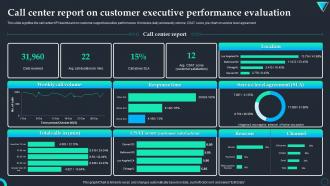 Call Center Report On Customer Executive Performance Evaluation
This slide signifies the call center KPI dashboard on customer support executive performance. It includes daily and weekly volume, CSAT score, pie chart on service level agreement. Presenting our well structured Call Center Report On Customer Executive Performance Evaluation. The topics discussed in this slide are Weekly Call Volume, Response Time, Service Level Agreement. This is an instantly available PowerPoint presentation that can be edited conveniently. Download it right away and captivate your audience.
-
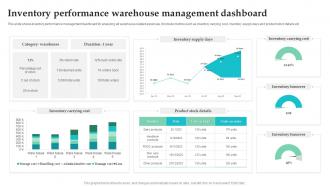 Inventory Performance Warehouse Management Dashboard
This slide shows inventory performance management dashboard for analyzing all warehouse related expenses. It include metrics such as inventory carrying cost, inventory supply days and product stock details etc. Presenting our well structured Inventory Performance Warehouse Management Dashboard. The topics discussed in this slide are Category Warehouse, Inventory Carrying Cost, Product Stock Details. This is an instantly available PowerPoint presentation that can be edited conveniently. Download it right away and captivate your audience.
-
 Employee Demographics And Designation Analysis Dashboard
The purpose of this template is to explain the analysis of employee demographics and designation dashboard. The slide provides information about gender, ethnicity, location and structure. Introducing our Employee Demographics And Designation Analysis Dashboard set of slides. The topics discussed in these slides are Top Locations, Employee Structure, Job Functions. This is an immediately available PowerPoint presentation that can be conveniently customized. Download it and convince your audience.
-
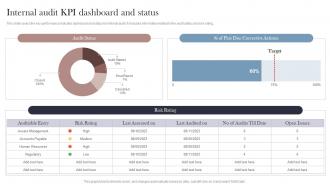 Internal Audit KPI Dashboard Snapshot And Status
This slide covers the key performance indicator dashboard snapshot and status for internal audit. It includes information related to the audit status and risk rating. Presenting our well structured Internal Audit KPI Dashboard And Status. The topics discussed in this slide are Auditable Entry, Risk Rating, Corrective Actions. This is an instantly available PowerPoint presentation that can be edited conveniently. Download it right away and captivate your audience.
-
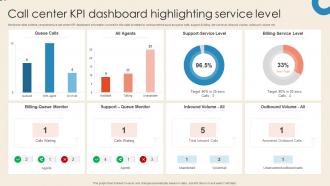 Call Center KPI Dashboard Highlighting Service Level
Mentioned slide outlines comprehensive call center KPI dashboard. Information covered in this slide is related to various metrics such as queue calls, support and billing service level, inbound volume, outbound volume etc. Introducing our Call Center KPI Dashboard Highlighting Service Level set of slides. The topics discussed in these slides are Support Service Level, Billing Service Level, Billing Queue Monitor. This is an immediately available PowerPoint presentation that can be conveniently customized. Download it and convince your audience.
-
 Call Center KPI Dashboard With Cost Per Contact
Mentioned slide outlines KPI dashboard which allows the business to monitor the efficiency of call center. The metrics covered in the slide are first call resolution, average speed of answer, customer satisfaction, cost per contact etc. Introducing our Call Center KPI Dashboard With Cost Per Contact set of slides. The topics discussed in these slides are Customer Satisfaction, Call Volume, Key Metrics. This is an immediately available PowerPoint presentation that can be conveniently customized. Download it and convince your audience.
-
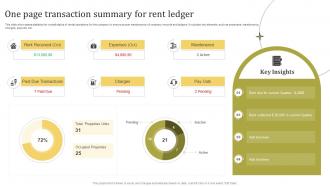 One Page Transaction Summary For Rent Ledger
This slide showcases statistics for overall status of rental operations for the company to ensure proper maintenance of company records and ledgers. It includes key elements such as expenses, maintenance, charges, payouts, etc. Introducing our One Page Transaction Summary For Rent Ledger set of slides. The topics discussed in these slides are Rent Received, Past Due Transactions, Charges. This is an immediately available PowerPoint presentation that can be conveniently customized. Download it and convince your audience.
-
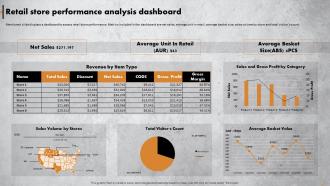 Retail Store Performance Analysis Dashboard Achieving Operational Excellence In Retail
Mentioned slide displays a dashboard to assess retail store performance. Metrics included in the dashboard are net sales, average unit in retail, average basket size, sales volume by store and total visitors count. Deliver an outstanding presentation on the topic using this Retail Store Performance Analysis Dashboard Achieving Operational Excellence In Retail. Dispense information and present a thorough explanation of Retail Store, Performance, Analysis, Dashboard using the slides given. This template can be altered and personalized to fit your needs. It is also available for immediate download. So grab it now.
-
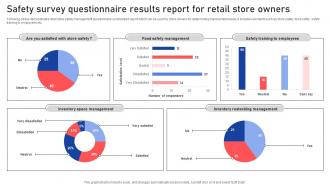 Safety Survey Questionnaire Results Report For Retail Store Owners Survey SS
Following slides demonstrates retail store safety management questionnaire summarized report which can be used by store owners for determining improvement areas. It includes elements such as store safety, food safety, safety training to employees etc. Introducing our Safety Survey Questionnaire Results Report For Retail Store Owners Survey SS set of slides. The topics discussed in these slides are Survey, Safety, Report. This is an immediately available PowerPoint presentation that can be conveniently customized. Download it and convince your audience.
-
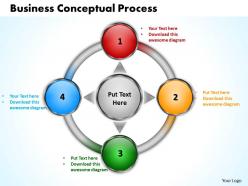 Business conceptual process powerpoint templates graphics slides 0712
The business conceptual diagram is used to understand what the key areas of ... Business Roles perfom Business Processes
-
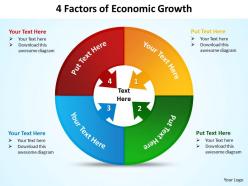 4 factors of economic growth powerpoint diagrams presentation slides graphics 0912
This is a powerful diagrams that can be used for creating presentations and for visual communication with your audience.
-
 Circular balanced layout 7 stages powerpoint diagrams presentation slides graphics 0912
use this chart for an effective way of displaying information you can edit text, color, shade and style as per you need.
-
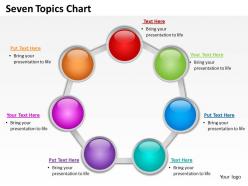 Seven topics chart powerpoint diagrams presentation slides graphics 0912
Use these circle charts to make your team understand different topics.
-
 Three way circular chart powerpoint diagrams presentation slides graphics 0912
This chart is an effective way of displaying information you can edit text, color, shade and style as per you need.
-
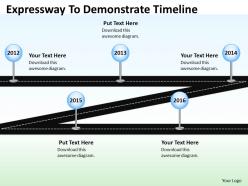 Flow chart business expressway to demonstrate timeline powerpoint slides
We are proud to present our flow chart business expressway to demonstrate timeline powerpoint slides. Visually support your Microsoft office PPT Presentation with our above template illustrating a timeline layout. You have analysed many global markets and come up with possibilities. Highlight the pros and cons of other likely business opportunities
-
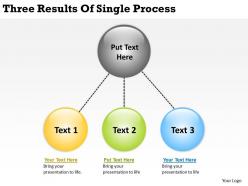 Three results of single process ppt powerpoint slides
We are proud to present our three results of single process ppt powerpoint slides. This diagram can be used in Ripple effect, Chain reactions and Trigger effect. It can also be used to depict action, reaction relationship. It features an image of one cause and three results or outcomes.
-
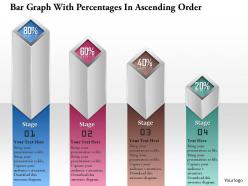 0914 business plan bar graph with percentages in ascending order powerpoint template
We are proud to present our 0914 business plan bar graph with percentages in ascending order powerpoint template. This image slide displays bar graph with icons. This image slide may be used in your presentations to depict business planning process. Use this innovative image slide in business, marketing and social presentations. You may change color, size and orientation of any icon to your liking. This image slide will enhance the quality of your presentations.
-
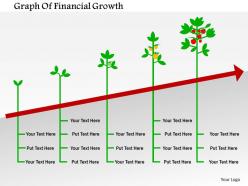 0115 graph of financial growth powerpoint template
We are proud to present our 0115 graph of financial growth powerpoint template. Tree design bar graph has been used to craft this power point template diagram. This PPT contains the concept of financial growth. Use this PPT diagram for finance and business related presentations.
-
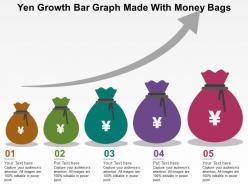 Yen growth bar graph made with money bags flat powerpoint design
We are proud to present our yen growth bar graph made with money bags flat powerpoint design. This power point template diagram has been crafted with graphic of yen and money bag. This PPT diagram contains the concept of money growth. Use this PPT diagram for finance and marketing related presentations.
-
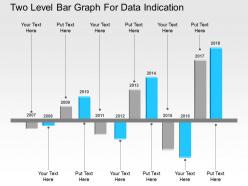 Two level bar graph for data indication flat powerpoint design
We are proud to present our two level bar graph for data indication flat powerpoint design. Concept of business data indication has been displayed in this power point template diagram. This PPT diagram contains the graphic of two level bar graph. Use this PPT diagram for business and marketing related presentations.
-
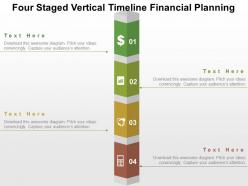 Four staged vertical timeline financial planning flat powerpoint design
We are proud to present our four staged vertical timeline financial planning flat powerpoint design. This power point template diagram has been crafted with graphic of four staged vertical timeline diagram. This PPT diagram contains the concept of financial planning. Use this PPT diagram for business and finance related presentations.
-
 Financial investment graduation expanses flat powerpoint design
We are proud to present our financial investment graduation expanses flat powerpoint design. Concept of financial investment and graduation expanses has been defined in this power point template diagram. This PPT diagram contains the graphic of growth analysis chart. Use this PPT diagram for business and finance related presentations.
-
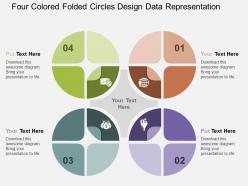 Four colored folded circles design data representation flat powerpoint design
We are proud to present our four colored folded circles design data representation flat powerpoint design. This power point template diagram has been crafted with graphic of four colored folded circles. This PPT diagram contains the concept of business data representation. Use this PPT diagram for business and marketing related presentations.
-
 Dw seven staged option tags and icons for business portfolio flat powerpoint design
Presenting dw seven staged option tags and icons for business portfolio flat powerpoint design. This Power Point template slide has been designed with graphic of seven staged option tags and icons. This PPT diagram contains the concept of business strategy representation. Use this PPT slide for business and finance related presentations.
-
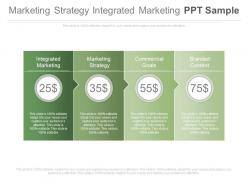 Marketing strategy integrated marketing ppt sample
High resolution splendid visuals. Impactful PPT images which don’t blur with wide screen projection. Compatible with multiple formats like JPEG, JPG or PDF. Harmonious with various online and offline software options. Personalize it with your company name and logo. 100 percent editable slide background. Edit the PPT icon, color, shade, design and orientation as per individual choice. Used worldwide by experts and professionals, students and teachers. The stages in this process are business, finance, strategy, management.
-
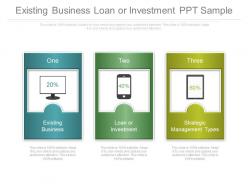 Existing business loan or investment ppt sample
Presenting existing business loan or investment ppt sample. This is a existing business loan or investment ppt sample. This is a three stage process. The stages in this process are business, finance, strategy.
-
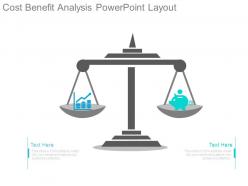 Cost benefit analysis powerpoint layout
Presenting cost benefit analysis powerpoint layout. This is a cost benefit analysis powerpoint layout. This is a two stage process. The stages in this process are business, finance, strategy, management, marketing, compare.
-
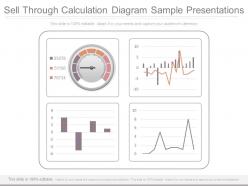 Sell through calculation diagram sample presentations
Presenting sell through calculation diagram sample presentations. This is a sell through calculation diagram sample presentations. This is a four stage process. The stages in this process are buiness, marketing, success, finance, management.
-
 Revenue model ppt example file
Presenting revenue model ppt example file. This is a revenue model ppt example file. This is five stage process. The stages in this process are business, currency, finance, strategy, icons, success, investment.
-
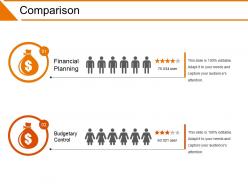 Comparison powerpoint slide backgrounds
Presenting comparison powerpoint slide backgrounds. This is a comparison powerpoint slide backgrounds. This is a four stage process. The stages in this process are financial planning, budgetary control.
-
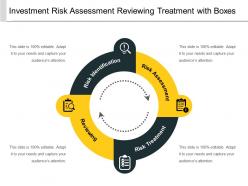 Investment risk assessment reviewing treatment with boxes
Presenting investment risk assessment reviewing treatment with boxes. This is a investment risk assessment reviewing treatment with boxes. This is a four stage process. The stages in this process are investment risk, risk management, financial risk.
-
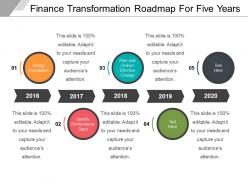 Finance transformation roadmap for five years
Presenting finance transformation roadmap for five years. Presenting finance transformation roadmap for five years. This is a finance transformation roadmap for five years. This is a five stage process. The stages in this process are finance transformation, money transformation, finance service.
-
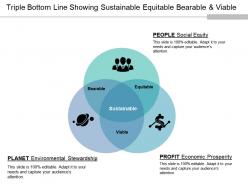 Triple bottom line showing sustainable equitable bearable and viable
Presenting this set of slides with name - Triple Bottom Line Showing Sustainable Equitable Bearable And Viable. This is a three stage process. The stages in this process are Triple Bottom Line, Accounting Framework, Financial Bottom Line.
-
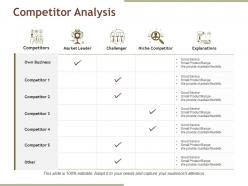 Competitor analysis powerpoint slide designs
Presenting this set of slides with name - Competitor Analysis Powerpoint Slide Designs. This is a five stage process. The stages in this process are Competitors, Market Leader, Challenger, Explanations, Niche Competitor.
-
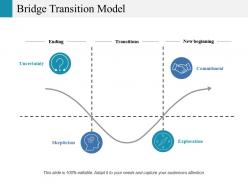 Bridge transition model ppt portfolio guidelines
Presenting this set of slides with name - Bridge Transition Model Ppt Portfolio Guidelines. This is a four stage process. The stages in this process are Ending, Transitions, Uncertainty, Commitment, Exploration.
-
 Financial ppt portfolio ideas
Presenting this set of slides with name - Financial Ppt Portfolio Ideas. This is a four stage process. The stages in this process are Icons, Strategy, Business, Financial, Percentage.
-
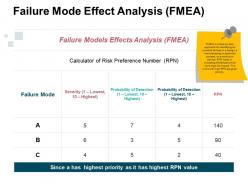 Failure mode effect analysis ppt examples professional
The visuals available in the FMEA PowerPoint leave a long term impact on viewers. The users of PPT can change the color theme, text and font. Presentation is compatible with software options, formats and Google slides. The visuals used are of high resolution and do not deter in quality irrespective of the screen size. Link is easy to download. This PPT is of much use to management students, teachers and business professionals.
-
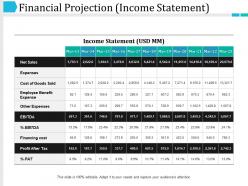 Financial projection presentation images
Presenting financial projection presentation images PPT slide. The financial projection presentation slide designed professionally by the team of SlideTeam to make viewers familiar with business financial analysis. The financial projections spreadsheet PPT template is customizable in PowerPoint along with that it is also compatible with Google Slides so a user can explain how to make essential decisions in business to viewers via the internet. A user can make changes in the font size, font type, color as well as dimensions of the financial projections business plan PowerPoint template as per the requirement.
-
 Two way exchange process icon
Presenting this set of slides with name Two Way Exchange Process Icon. This is a two stage process. The stages in this process are Marketing, Strategy, Dollar, Finance. This is a completely editable PowerPoint presentation and is available for immediate download. Download now and impress your audience.
-
 Financial capital raising strategy image
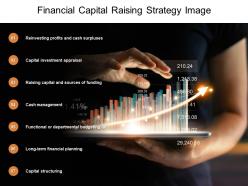
Presenting this set of slides with name Financial Capital Raising Strategy Image. This is a seven stage process. The stages in this process are Financial Strategy, Business Strategy, Cash Management. This is a completely editable PowerPoint presentation and is available for immediate download. Download now and impress your audience.
-
 Financial strategy with chess board image
Presenting this set of slides with name Financial Strategy With Chess Board Image. This is a seven stage process. The stages in this process are Financial Strategy, Business Strategy, Cash Management. This is a completely editable PowerPoint presentation and is available for immediate download. Download now and impress your audience.
-
 Commercial banks industry trends with online banking
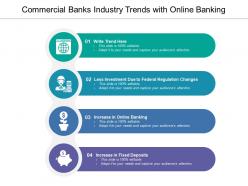
Presenting this set of slides with name Commercial Banks Industry Trends With Online Banking. This is a four stage process. The stages in this process are Industry Trends, Online Banking, Centralized Network. This is a completely editable PowerPoint presentation and is available for immediate download. Download now and impress your audience.
-
 Short mid and long term financial goal
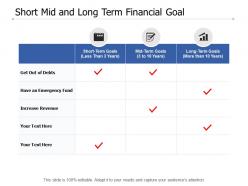
Presenting this set of slides with name Short Mid And Long Term Financial Goal. The topics discussed in these slides are Financial Goal, Arrow Target Dollar, Increased Revenue. This is a completely editable PowerPoint presentation and is available for immediate download. Download now and impress your audience.
-
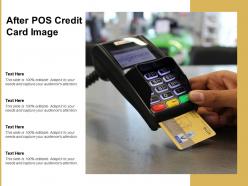 After pos credit card image
Presenting this set of slides with name After Pos Credit Card Image. This is a one process. The stages in this process are stages Credit Card, Bank Card Icon, Debit Card Icon. This is a completely editable PowerPoint presentation and is available for immediate download. Download now and impress your audience.
-
 Online shopping through credit card image
Presenting this set of slides with name Online Shopping Through Credit Card Image. This is a one process. The stages in this process are stages Credit Card, Bank Card Icon, Debit Card Icon. This is a completely editable PowerPoint presentation and is available for immediate download. Download now and impress your audience.
-
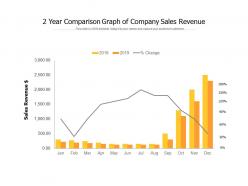 2 year comparison graph of company sales revenue
Presenting this set of slides with name 2 Year Comparison Graph Of Company Sales Revenue. The topics discussed in these slides are Year Comparison, Marking Strategy, Sales Profit. This is a completely editable PowerPoint presentation and is available for immediate download. Download now and impress your audience.
-
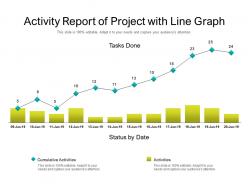 Activity report of project with line graph
Presenting this set of slides with name Activity Report Of Project With Line Graph. The topics discussed in these slides are Cumulative Activities, Activities. This is a completely editable PowerPoint presentation and is available for immediate download. Download now and impress your audience.
-
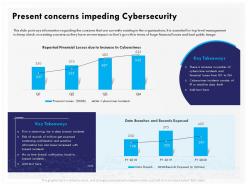 Present concerns impeding cybersecurity financial ppt gallery
This slide portrays information regarding the concerns that are currently existing in the organizations. It is essential for top level management to keep check on existing concerns as they have severe impact on firms growth in terms of huge financial losses and bad public image. Presenting this set of slides with name Present Concerns Impeding Cybersecurity Financial Ppt Gallery. The topics discussed in these slides are Present Concerns Impeding Cybersecurity. This is a completely editable PowerPoint presentation and is available for immediate download. Download now and impress your audience.
-
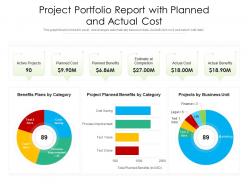 Project portfolio report with planned and actual cost
This graph or chart is linked to excel, and changes automatically based on data. Just left click on it and select edit data. Presenting our well-structured Project Portfolio Report With Planned And Actual Cost. The topics discussed in this slide are Planned Cost, Planned Benefits, Actual Cost. This is an instantly available PowerPoint presentation that can be edited conveniently. Download it right away and captivate your audience.
-
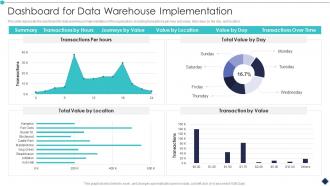 Dashboard Snapshot For Data Warehouse Implementation Analytic Application Ppt Mockup
This slide represents the dashboard snapshot for data warehouse implementation in the organization, including transactions per hour and value, total value by the day, and location. Deliver an outstanding presentation on the topic using this Dashboard For Data Warehouse Implementation Analytic Application Ppt Mockup. Dispense information and present a thorough explanation of Transactions, Summary, Data Warehouse Implementation using the slides given. This template can be altered and personalized to fit your needs. It is also available for immediate download. So grab it now.
-
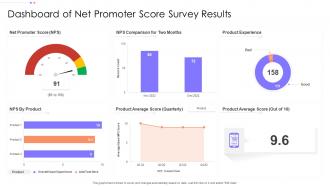 Dashboard Of Net Promoter Score Survey Results
This graph or chart is linked to excel, and changes automatically based on data. Just left click on it and select Edit Data. Presenting our well structured Dashboard Of Net Promoter Score Survey Results. The topics discussed in this slide are Net Promoter Score, Product Experience, Product Average Score, NPS By Product. This is an instantly available PowerPoint presentation that can be edited conveniently. Download it right away and captivate your audience.
-
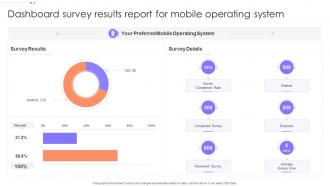 Dashboard Snapshot Survey Results Report For Mobile Operating System
This graph or chart is linked to excel, and changes automatically based on data. Just left click on it and select Edit Data. Introducing our Dashboard Snapshot Survey Results Report For Mobile Operating System set of slides. The topics discussed in these slides are Survey Results, Survey Details, Completed Survey, Reviewed Survey. This is an immediately available PowerPoint presentation that can be conveniently customized. Download it and convince your audience.
-
 Immigration Stats Dashboard From Survey Results
This graph or chart is linked to excel, and changes automatically based on data. Just left click on it and select Edit Data. Presenting our well structured Immigration Stats Dashboard From Survey Results. The topics discussed in this slide are Attitude To Immigration, Respondent Profile, Average Age, Immigrants. This is an instantly available PowerPoint presentation that can be edited conveniently. Download it right away and captivate your audience.
-
 HR Recruitment Dashboard To Monitor Job Interview Status
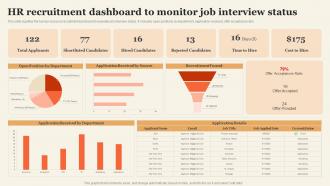
This slide signifies the human resource recruitment dashboard to evaluate job interview status. It includes open positions by department, application received, offer acceptance ratio. Introducing our HR Recruitment Dashboard To Monitor Job Interview Status set of slides. The topics discussed in these slides are Total Applicants, Shortlisted Candidates, Hired Candidates. This is an immediately available PowerPoint presentation that can be conveniently customized. Download it and convince your audience.
-
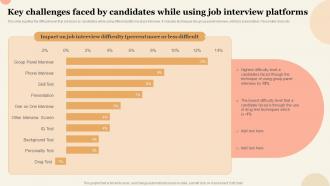 Key Challenges Faced By Candidates While Using Job Interview Platforms
This slide signifies the difficulty level that are faced by candidates while using different platforms at job interview. It includes techniques like group panel interview, skill test, presentation, Personality check etc. Presenting our well structured Key Challenges Faced By Candidates While Using Job Interview Platforms. The topics discussed in this slide are Group Panel Interview, Phone Interview, Skill Test. This is an instantly available PowerPoint presentation that can be edited conveniently. Download it right away and captivate your audience.
-
 Dashboard For Competitor Price Analysis To Compare Product Performance
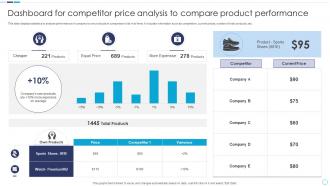
This slide displays statistics to analyse performance of companys own products in comparison to its rival firms. It includes information such as competitors, current prices, number of total products, etc. Introducing our Dashboard For Competitor Price Analysis To Compare Product Performance set of slides. The topics discussed in these slides are Cheaper, Equal Price, More Expensive, Products. This is an immediately available PowerPoint presentation that can be conveniently customized. Download it and convince your audience.


