- Sub Categories
-
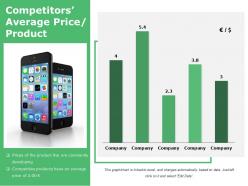 Competitors average price product powerpoint templates
Presenting this set of slides with name - Competitors Average Price Product Powerpoint Templates. This is a five stage process. The stages in this process are Finance, Marketing, Strategy, Business, Growth, Analysis.
-
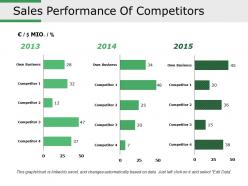 Sales performance of competitors presentation portfolio
Presenting this set of slides with name - Sales Performance Of Competitors Presentation Portfolio. This is a three stage process. The stages in this process are Business, Finance, Marketing, Strategy, Analysis.
-
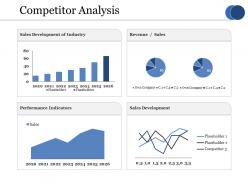 Competitor analysis ppt slides graphics example
Presenting this set of slides with name - Competitor Analysis Ppt Slides Graphics Example. This is a four stage process. The stages in this process are Sales Development Of Industry, Revenue, Sales Development, Performance Indicators, Sales.
-
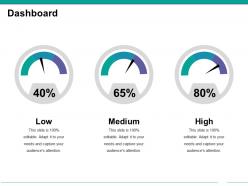 Dashboard snapshot ppt design
Presenting this set of slides with name - Dashboard Snapshot Ppt Design. This is a three stage process. The stages in this process are Low, Medium, High.
-
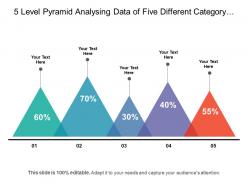 5 level pyramid analysing data of five different category in percent
Presenting this set of slides with name - 5 Level Pyramid Analysing Data Of Five Different Category In Percent. This is a five stage process. The stages in this process are 5 Level Pyramid, 5 Step Pyramid, 5 Part Pyramid.
-
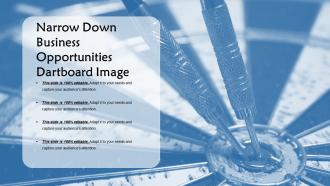 Narrow down business opportunities dartboard image
Presenting this set of slides with name - Narrow Down Business Opportunities Dartboard Image. This is a two stage process. The stages in this process are Narrow Down, Filtering, Choosing.
-
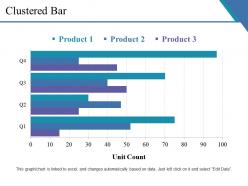 Clustered bar ppt themes
Presenting this set of slides with name - Clustered Bar Ppt Themes. This is a three stage process. The stages in this process are Unit Count, Finance, Business, Marketing, Strategy.
-
 Balance image of a scale with a meter pointer in the middle
Presenting this set of slides with name - Balance Image Of A Scale With A Meter Pointer In The Middle. This is a two stage process. The stages in this process are Balance, Stability, Equilibrium.
-
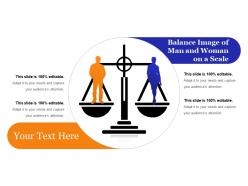 Balance image of man and woman on a scale
Presenting this set of slides with name - Balance Image Of Man And Woman On A Scale. This is a two stage process. The stages in this process are Balance, Stability, Equilibrium.
-
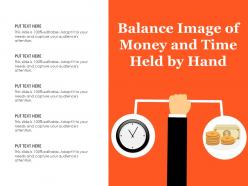 Balance image of money and time held by hand
Presenting this set of slides with name - Balance Image Of Money And Time Held By Hand. This is a two stage process. The stages in this process are Balance, Stability, Equilibrium.
-
 Oil and circular gas meter icon with pin
Presenting this set of slides with name - Oil And Circular Gas Meter Icon With Pin. This is a three stage process. The stages in this process are Oil And Gas Icons, Gasoline Icon, Petroleum Icon.
-
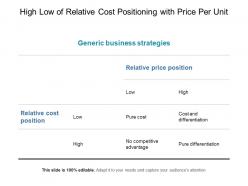 High low of relative cost positioning with price per unit
Presenting this set of slides with name - High Low Of Relative Cost Positioning With Price Per Unit. This is a three stage process. The stages in this process are Relative Cost Positioning, Product Positioning, Market Positioning.
-
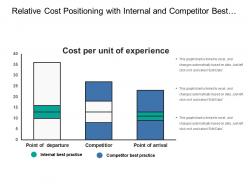 Relative cost positioning with internal and competitor best practice
Presenting this set of slides with name - Relative Cost Positioning With Internal And Competitor Best Practice. This is a three stage process. The stages in this process are Relative Cost Positioning, Product Positioning, Market Positioning.
-
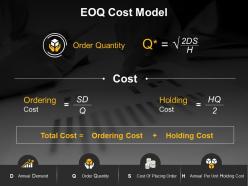 Eoq cost model ppt background designs
Presenting this set of slides with name - Eoq Cost Model Ppt Background Designs. This is a two stage process. The stages in this process are Ordering Cost, Holding Cost, Order Quantity.
-
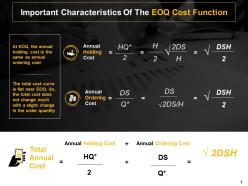 Important characteristics of the eoq cost function ppt deck
Presenting this set of slides with name - Important Characteristics Of The Eoq Cost Function Ppt Deck. This is a two stage process. The stages in this process are Finance, Marketing, Strategy, Analysis, Business, Investment.
-
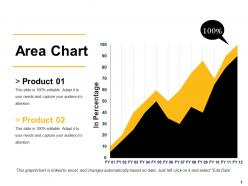 Area chart ppt files
Presenting this set of slides with name - Area Chart Ppt Files. This is a two stage process. The stages in this process are Area Chart, Finance, Analysis, Growth, Strategy, Business.
-
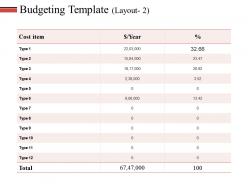 Budgeting template ppt slides structure
Presenting this set of slides with name - Budgeting Template Ppt Slides Structure. This is a three stage process. The stages in this process are Cost Item, Year, Percentage, Business, Marketing.
-
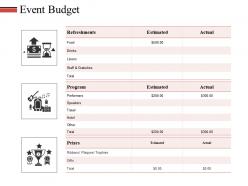 Event budget ppt slides graphics example
Presenting this set of slides with name - Event Budget Ppt Slides Graphics Example. This is a three stage process. The stages in this process are Refreshments, Estimated, Actual, Program, Business.
-
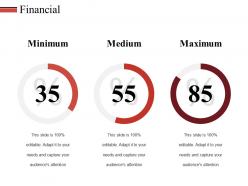 Financial ppt styles files
Presenting this set of slides with name - Financial Ppt Styles Files. This is a three stage process. The stages in this process are Minimum, Financial, Medium, Maximum, Business.
-
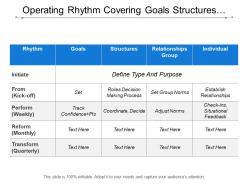 Operating rhythm covering goals structures relationship and individual
Presenting this set of slides with name - Operating Rhythm Covering Goals Structures Relationship And Individual. This is a four stage process. The stages in this process are Operating Rhythm, Six Sigma, Business Rhythm.
-
 About us ppt information
Presenting this set of slides with name - About Us Ppt Information. This is a three stage process. The stages in this process are Business, Management, Planning, Marketing, About Us.
-
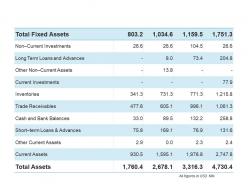 Balance sheet kpis tabular form ppt graphics
Presenting this set of slides with name - Balance Sheet Kpis Tabular Form Ppt Graphics. This is a five stage process. The stages in this process are Long Term Loans And Advances, Current Investments, Inventories, Trade Receivables, Cash And Bank Balances.
-
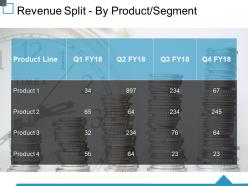 Revenue split by product segment ppt visual aids outline
Presenting this set of slides with name - Revenue Split By Product Segment Ppt Visual Aids Outline. This is a four stage process. The stages in this process are Business, Marketing, Strategy, Planning, Table.
-
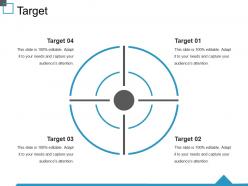 Target ppt visual aids example file
Presenting this set of slides with name - Target Ppt Visual Aids Example File. This is a four stage process. The stages in this process are Target, Marketing, Planning, Business, Our Goal.
-
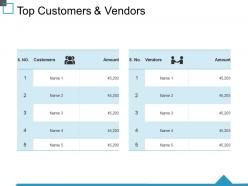 Top customers and vendors ppt visual aids deck
Presenting this set of slides with name - Top Customers And Vendors Ppt Visual Aids Deck. This is a two stage process. The stages in this process are Customers, Amount, Vendors, Business, Marketing.
-
 Company xyz monthly business review showing revenue split by product
Presenting this set of slides with name - Company Xyz Monthly Business Review Showing Revenue Split By Product. This is a four stage process. The stages in this process are Monthly Business Review, Monthly Business Report, Monthly Company Review.
-
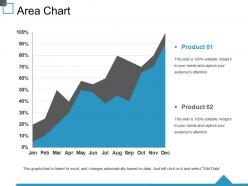 Area chart ppt summary vector
Presenting this set of slides with name - Area Chart Ppt Summary Vector. This is a two stage process. The stages in this process are Chart, Finance, Business, Marketing, Strategy, Percentage.
-
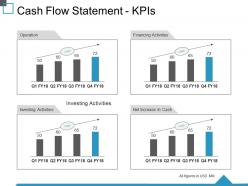 Cash flow statement kpis ppt summary smartart
Presenting this set of slides with name - Cash Flow Statement Kpis Ppt Summary Smartart. This is a four stage process. The stages in this process are Operation, Investing Activities, Financing Activities, Net Increase In Cash, Business.
-
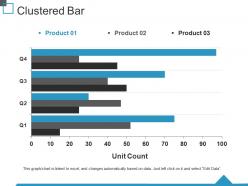 Clustered bar ppt summary slideshow
Presenting this set of slides with name - Clustered Bar Ppt Summary Slideshow. This is a three stage process. The stages in this process are Unit Count, Business, Marketing, Finance, Graph.
-
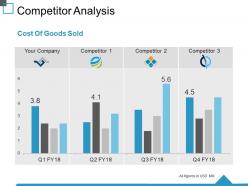 Competitor analysis ppt summary portrait
Presenting this set of slides with name - Competitor Analysis Ppt Summary Portrait. This is a four stage process. The stages in this process are Analysis, Business, Marketing, Finance, Cost Of Goods Sold.
-
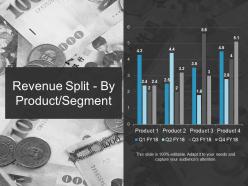 Revenue split by product segment ppt summary icons
Presenting this set of slides with name - Revenue Split By Product Segment Ppt Summary Icons. This is a four stage process. The stages in this process are Business, Marketing, Finance, Graph, Strategy.
-
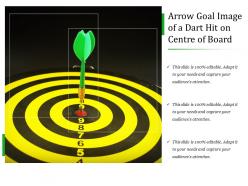 Arrow goal image of a dart hit on centre of board
Presenting this set of slides with name - Arrow Goal Image Of A Dart Hit On Centre Of Board. This is a one stage process. The stages in this process are Arrow Goals, Arrow Objectives, Arrow Targets.
-
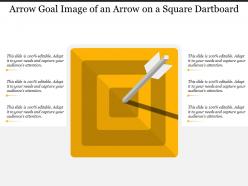 Arrow goal image of an arrow on a square dartboard
Presenting this set of slides with name - Arrow Goal Image Of An Arrow On A Square Dartboard. This is a one stage process. The stages in this process are Arrow Goals, Arrow Objectives, Arrow Targets.
-
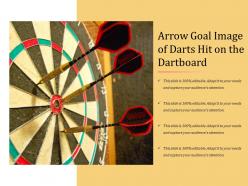 Arrow goal image of darts hit on the dartboard
Presenting this set of slides with name - Arrow Goal Image Of Darts Hit On The Dartboard. This is a one stage process. The stages in this process are Arrow Goals, Arrow Objectives, Arrow Targets.
-
 Arrow goal shooting arrow in the center on a painted target
Presenting this set of slides with name - Arrow Goal Shooting Arrow In The Center On A Painted Target. This is a one stage process. The stages in this process are Arrow Goals, Arrow Objectives, Arrow Targets.
-
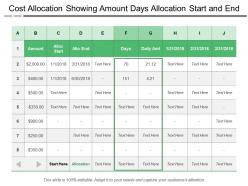 Cost allocation showing amount days allocation start and end
Presenting this set of slides with name - Cost Allocation Showing Amount Days Allocation Start And End. This is a eight stage process. The stages in this process are Cost Allocation, Assigning Costs, Costs Management.
-
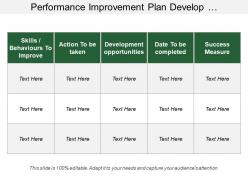 Performance improvement plan develop opportunities and success measure
Presenting this set of slides with name - Performance Improvement Plan Develop Opportunities And Success Measure. This is a five stage process. The stages in this process are Performance Improvement Plan, Performance Improvement Strategies, Performance Improvement Approaches.
-
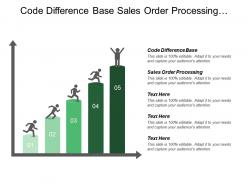 Code difference base sales order processing strategy planning
Presenting this set of slides with name - Code Difference Base Sales Order Processing Strategy Planning. This is an editable five stages graphic that deals with topics like Code Difference Base Sales Order Processing to help convey your message better graphically. This product is a premium product available for immediate download, and is 100 percent editable in Powerpoint. Download this now and use it in your presentations to impress your audience.
-
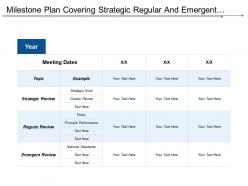 Milestone plan covering strategic regular and emergent review
Presenting this set of slides with name - Milestone Plan Covering Strategic Regular And Emergent Review. This is a three stage process. The stages in this process are Milestone Plan, Milestone Strategy, Milestone Approach.
-
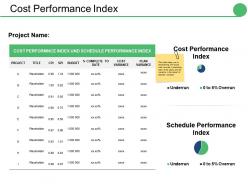 Cost performance index ppt infographic template themes
Presenting this set of slides with name - Cost Performance Index Ppt Infographic Template Themes. This is a two stage process. The stages in this process are Cost Performance Index, Overrun, Underrun, Concern, Delay.
-
 Self presentation icon powerpoint presentation examples
Presenting this set of slides with name - Self Presentation Icon Powerpoint Presentation Examples. This is a one stage process. The stages in this process are Self Introduction, Introduce Yourself, Self Presentation.
-
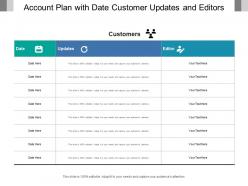 Account plan with date customer updates and editors
Presenting this set of slides with name - Account Plan With Date Customer Updates And Editors. This is a three stage process. The stages in this process are Account Plan, Account Strategy, Sales Planning.
-
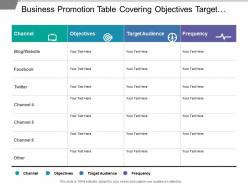 Business promotion table covering objectives target audience and frequency
Presenting this set of slides with name - Business Promotion Table Covering Objectives Target Audience And Frequency. This is a four stage process. The stages in this process are Business Promotion, Business Marketing, Business Branding.
-
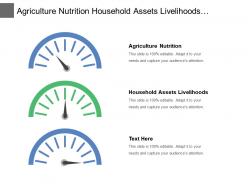 Agriculture nutrition household assets livelihoods agricultural livelihoods food production
Presenting this set of slides with name - Agriculture Nutrition Household Assets Livelihoods Agricultural Livelihoods Food Production. This is an editable three stages graphic that deals with topics like Agriculture Nutrition, Household Assets Livelihoods, Agricultural Livelihoods, Food Production to help convey your message better graphically. This product is a premium product available for immediate download, and is 100 percent editable in Powerpoint. Download this now and use it in your presentations to impress your audience.
-
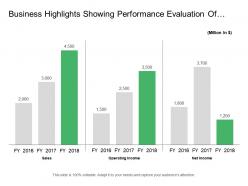 Business highlights showing performance evaluation of sales operating income and net income
Presenting this set of slides with name - Business Highlights Showing Performance Evaluation Of Sales Operating Income And Net Income. This is a three stage process. The stages in this process are Business Highlights, Company Highlights, Business Key Points.
-
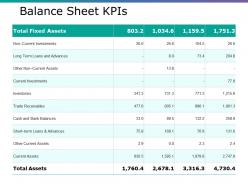 Balance sheet kpis ppt gallery graphics
Presenting this set of slides with name - Balance Sheet Kpis Ppt Gallery Graphics. This is a four stage process. The stages in this process are Current Investments, Inventories, Trade Receivables, Current Assets, Total Assets.
-
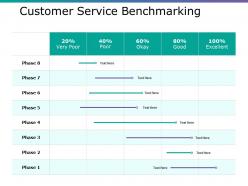 Customer service benchmarking ppt layouts example topics
Presenting this set of slides with name - Customer Service Benchmarking Ppt Layouts Example Topics. This is a eight stage process. The stages in this process are Phase, Good Excellent, Business, Management.
-
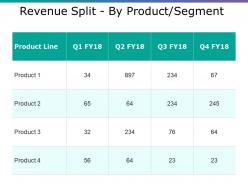 Revenue split by product segment ppt inspiration designs
Presenting this set of slides with name - Revenue Split By Product Segment Ppt Inspiration Designs. This is a four stage process. The stages in this process are Product, Product Line, Table, Management.
-
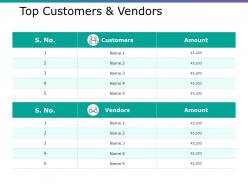 Top customers and vendors ppt infographics layout
Presenting this set of slides with name - Top Customers And Vendors Ppt Infographics Layout. This is a two stage process. The stages in this process are Customers, Amount, Vendors.
-
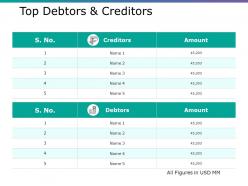 Top debtors and creditors ppt gallery picture
Presenting this set of slides with name - Top Debtors And Creditors Ppt Gallery Picture. This is a two stage process. The stages in this process are Creditors, Debtors, Amount.
-
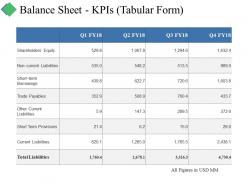 Balance sheet kpis tabular form ppt summary graphics example
Presenting this set of slides with name - Balance Sheet Kpis Tabular Form Ppt Summary Graphics Example. This is a four stage process. The stages in this process are Trade Payables, Other Current Liabilities, Short Term Provisions, Current Liabilities, Business.
-
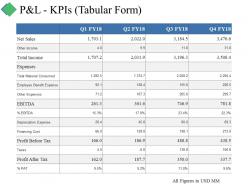 P and l kpis tabular form ppt summary sample
Presenting this set of slides with name - P And L Kpis Tabular Form Ppt Summary Sample. This is a four stage process. The stages in this process are Expenses, Other Expenses, Depreciation Expense, Financing Cost, Taxes.
-
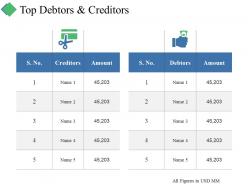 Top debtors and creditors ppt summary inspiration
Presenting this set of slides with name - Top Debtors And Creditors Ppt Summary Inspiration. This is a two stage process. The stages in this process are Business, Marketing, Creditors, Amount, Debtors.
-
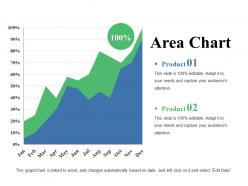 Area chart ppt summary guide
Presenting this set of slides with name - Area Chart Ppt Summary Guide. This is a two stage process. The stages in this process are Financials, Chart, Percentage, Business, Marketing.
-
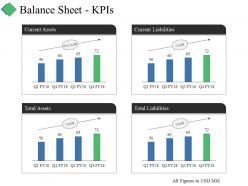 Balance sheet kpis ppt summary graphics
Presenting this set of slides with name - Balance Sheet Kpis Ppt Summary Graphics. This is a four stage process. The stages in this process are Business, Marketing, Current Assets, Total Assets, Current Liabilities, Total Liabilities.
-
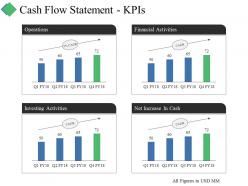 Cash flow statement kpis ppt summary example
Presenting this set of slides with name - Cash Flow Statement Kpis Ppt Summary Example. This is a four stage process. The stages in this process are Business, Operations, Investing Activities, Financial Activities, Net Increase In Cash.
-
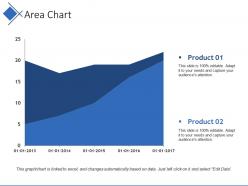 Area chart powerpoint presentation examples
Presenting this set of slides with name - Area Chart Powerpoint Presentation Examples. This is a two stage process. The stages in this process are Chart, Business, Marketing, Strategy, Finance.
-
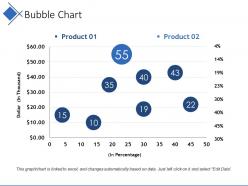 Bubble chart powerpoint slide backgrounds
Presenting this set of slides with name - Bubble Chart Powerpoint Slide Backgrounds. This is a two stage process. The stages in this process are Business, Marketing, Finance, Dollar, In Percentage, Bubble.
-
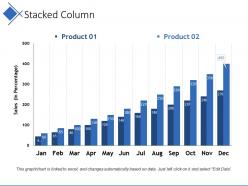 Stacked column powerpoint slide themes
Presenting this set of slides with name - Stacked Column Powerpoint Slide Themes. This is a two stage process. The stages in this process are Business, Marketing, Sales, Graph, Strategy.
-
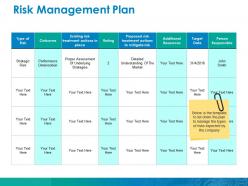 Risk management plan ppt icon aids
Presenting this set of slides with name - Risk Management Plan Ppt Icon Aids. This is a four stage process. The stages in this process are Type Of Risk, Outcome, Rating, Target Date, Person Responsible.


