-
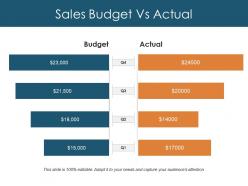 Sales budget vs actual ppt design templates
Presenting this set of slides with name - Sales Budget Vs Actual Ppt Design Templates. This is a four stage process. The stages in this process are Business, Budget, Actual, Marketing, Graph.
-
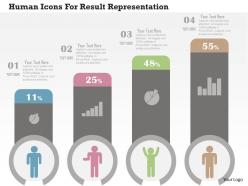 Human icons for result representation flat powerpoint design
We are proud to present our human icons for result representation flat powerpoint design. This power point template diagram has been crafted with graphic of human icon. This PPT diagram contains the concept of result representation. Use this PPT diagram can be used for business and management related presentations.
-
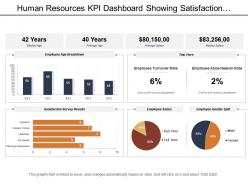 Human resources kpi dashboard showing satisfaction survey result age breakdown
Presenting human resources KPI dashboard showing satisfaction survey result age breakdown data driven PowerPoint slide. Fit to be used with the Google slides. Replace the visuals, text and the content in the slide design. Change the size, style and orientation of the slides. Use your company’s name or brand name to make it your own presentation template. Beneficial for managers, professors, marketers, etc. Flexible option for conversion in PDF or JPG formats. Available in Widescreen format also. Useful for making business plan and strategies.
-
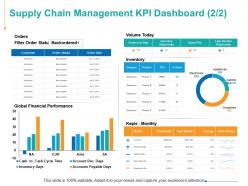 Supply chain management kpi dashboard finance ppt powerpoint presentation files
Presenting this set of slides with name - Supply Chain Management KPI Dashboard Finance Ppt Powerpoint Presentation Files. This is a four stage process. The stages in this process are Customer, Inventory, Marketing, Strategy, Planning.
-
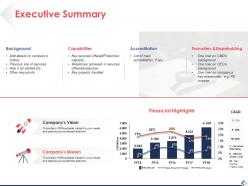 Executive summary background ppt pictures slide download
Presenting this set of slides with name - Executive Summary Background Ppt Pictures Slide Download. This is a four stage process. The stages in this process are Background, Capabilities, Accreditation, Promoters, Shareholding.
-
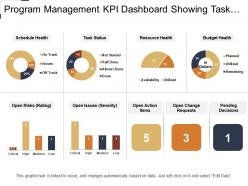 Program management kpi dashboard showing task status and budget health
Presenting Program Management KPI Dashboard Showing Task Status And Budget Health PPT slide. The task status dashboard PowerPoint template designed professionally by the team of SlideTeam to present the current status of the project. The different icons such as pie chart, semi-circle, square box, line chart and many other which include text in the Budget health dashboard slide are customizable in PowerPoint. A user can populate the pie chart and line chart values by editing the excel table and it is also compatible with Google Slide. A user can alter the font size, font type, color and dimensions of the line chart and pie chart to show the desired values.
-
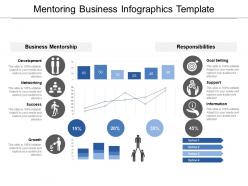 Mentoring business infographics template
Presenting this set of slides with name - Mentoring Business Infographics Template. This is a four stage process. The stages in this process are Mentoring, Advise, Trainee.
-
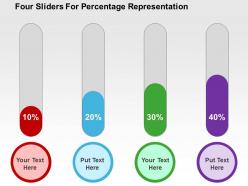 Four sliders for percentage representation flat powerpoint design
We are proud to present our four sliders for percentage representation flat powerpoint design. This power point template diagram has been crafted with graphic of four sliders and percentage. This PPT diagram contains the concept of financial analysis. Use this PPT diagram for business and finance related presentations.
-
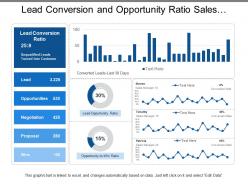 Lead conversion and opportunity ratio sales dashboards
Presenting this set of slides with name - Lead Conversion And Opportunity Ratio Sales Dashboards. This is a four stage process. The stages in this process are Sales Dashboard, Sales Kpis, Sales Performance.
-
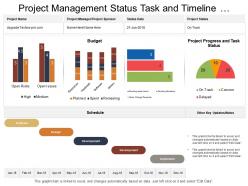 Project management status task and timeline dashboard
PPT design comes with access to include or exclude content as per the business need. Presentation template is available in both standard as well as in widescreen slide. PowerPoint slide provides a professional perspective to presentation. Harmonious with various formats like JPEG and PDF as well as with Google slides. Entirely editable and personalization of PPT graphic is enabled for your use. Matching PowerPoint slides are available with different nodes and stages.
-
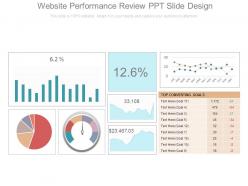 Website performance review ppt slide design
Presenting website performance review ppt slide design. This is a website performance review ppt slide design. This is a four stage process. The stages in this process are business, strategy, finance, management, marketing.
-
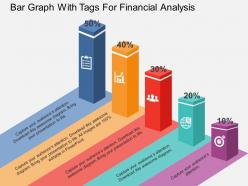 Bar graph with tags for financial analysis flat powerpoint design
Skillfully crafted bar graph with financial analysis PowerPoint slide. Amendable color, text, layout as per the preference and industry requirement. PPT illustration accessible in standard and widescreen display view. Quick download and easy to alter into other formats available such as JPG and PDF. Access to add business information i.e. name, sign, logo etc.
-
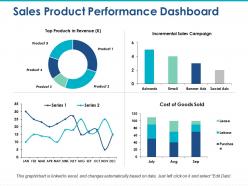 Sales product performance dashboard incremental sales campaign
Providing sales product performance dashboard incremental sales campaign presentation template with editing preference as images, icons, colors, text and layout can be edit as required. PowerPoint design can be downloaded and save into JPG and PDF format. High resolution ensures no pixel break. PPT diagram downloadable in standard and widescreen view. Fully adjustable slide as works well with Google slides. Easy to adjust and present when required. Quick to share message effectively.
-
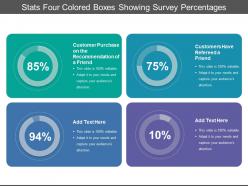 Stats four colored boxes showing survey percentages
Presenting this set of slides with name - Stats Four Colored Boxes Showing Survey Percentages. This is a four stage process. The stages in this process are Stats, Statistics, Data.
-
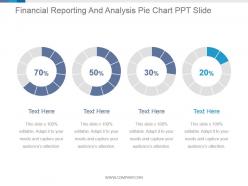 Financial reporting and analysis pie chart ppt slide
Presenting financial reporting and analysis pie chart ppt slide. This is a financial reporting and analysis pie chart ppt slide. This is a four stage process. The stages in this process are finance, marketing, percentage, process, success.
-
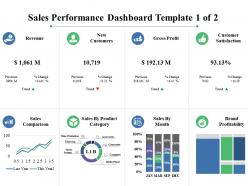 Sales performance dashboard revenue new customers
Providing sales performance dashboard revenue new customers PowerPoint template. PPT graphic can be shared in standard and widescreen view. High resolution picture quality ensures no pixel break up even when shared with large set of audience. Presentation slide is adaptable with Google slides. Magnificent to share business communication effectively. PPT slide is available with different nodes and stages. PowerPoint design can be edited as needed and change into JPG and PDF format.
-
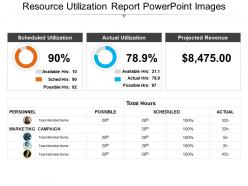 Resource utilization report powerpoint images
Presenting resource utilization report PowerPoint images PPT slide. This is a self-explanatory and intellectual slide design. There is the use of visually impressive colors and stunning picture quality. High-resolution images do not pixelate when projected on a wide screen. PPT is compatible with numerous software and format options. 100 percent editable slide design components. Modify the presentation elements as per the need of the hour. Personalize the PPT with your company name and logo. Used by entrepreneurs, marketers, managerial department, stakeholders and students.
-
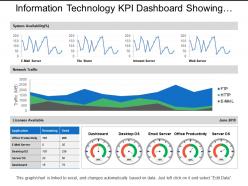 Information technology kpi dashboard showing network traffic system availability
Presenting information technology KPI dashboard showing network traffic system PowerPoint template. Choice to view PowerPoint design in standard and widescreen view. Fully editable Presentation dashboards that can be edited as needed. Easy to download and insert in the ongoing presentation. Convertible into Jpeg and Pdf document. Suitable for managers, leaders, sales and marketing people, analysts, etc. Slides are designed using latest management tools and techniques. The high-resolution view is altogether an experience with a brilliant impact.
-
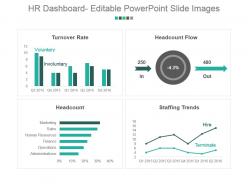 Hr dashboard editable powerpoint slide images
Stunning HR dashboard editable PPT slideshow. Loaded with incomparable benefits. Readymade PPT graphic helps in saving time and effort. Can be personalized by adding company trademark, logo, brand and symbols. Can be utilized for displaying both simple and complex information. Include or exclude slide content as per your individual need. Colors and text can be easily changed as the PPT slide is completely editable. Useful for every business leader and professional, project management team, business analysts, etc.
-
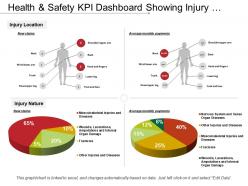 Health and safety kpi dashboard showing injury location and injury nature
Presenting the KPI dashboard PPT slide. This PPT template is fully editable and is designed by professionals looking for a professional presentation. You can edit the objects in the slide like font size and font color easily. This presentation slide is fully compatible with Google Slide and can be saved in JPG or PDF file format easily. Click on the download button below.
-
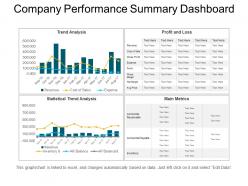 Company performance summary dashboard ppt slide examples
Presenting company performance summary dashboard PPT design. They are 100% expertly crafted Presentation graphics. They are quite compatible with all software’s and Google Slides. They have a feature to redesign all the available shapes, patterns, and matters etc. They have an authentic and relevant PPT images with limber data options and can easily add company name or logo.
-
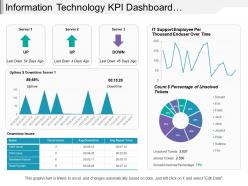 Information technology kpi dashboard showing downtime issues unsolved tickets
Presenting this set of slides with name - Information Technology Kpi Dashboard Showing Downtime Issues Unsolved Tickets. This is a four stage process. The stages in this process are Information Technology, It, Iot.
-
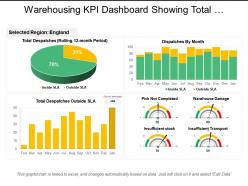 Warehousing kpi dashboard showing total dispatches
This highly versatile PPT design is completely editable; you can modify and personalize the design according to your business needs. You can use excel linked chart to display your business related and figures in presentation. PPT slides are easily downloadable as JPEG or PDF formats. Design can be opened both in standard and wide screen view; no change on design quality on full screen view.
-
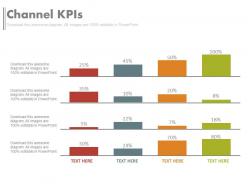 Ppts channel percentage kpis key performance indicator evaluate success powerpoint slides
This PPT Template can be used by professionals for representing their business and management ideas by the means of Percentage Kpis Key Performance Indicator Evaluate presentations. You can change the color of the elements shown in the figure and also edit the text to write a short brief about your company's matters. This PPT slide is also available in full screen mode.
-
 Business management dashboard diagram power point graphics
Presenting business management dashboard diagram power point graphics. This is a business management dashboard diagram power point graphics. This is a four stage process. The stages in this process are property system, crm system, asset system, finance system.
-
 Hr analytics dashboard template ppt sample file
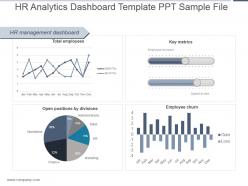
Presenting hr analytics dashboard template ppt sample file. This is a hr analytics dashboard template ppt sample file. This is a four stage process. The stages in this process are hr management dashboard, total employees, key metrics, employee turnover, speed to hire, ftes, jan, feb, mar, apr, may, june, july, aug, sep, oct, nov, dec, open positions by divisions, operations, administrations, sales, hr, marketing, finance, gain, loss, employee churn.
-
 Wealth Management Various Client Obligations In Wealth Management Fin SS
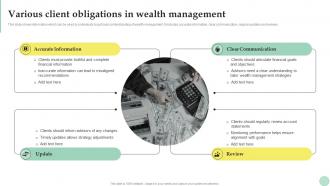
This slide shows information which can be used by individuals to get basic understanding of wealth management. It includes accurate information, clear communication, regular updates and reviews. Introducing Wealth Management Various Client Obligations In Wealth Management Fin SS to increase your presentation threshold. Encompassed with Four stages, this template is a great option to educate and entice your audience. Dispence information on Accurate Information, Update, Review using this template. Grab it now to reap its full benefits.
-
 Pie chart comparison with four different percentage
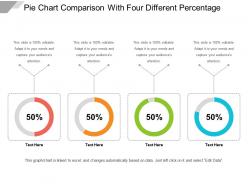
Presenting Pie Chart Comparison With Four Different Percentage. Made up of high-resolution graphics. Easy to download and can be saved in a variety of formats. Access to open on a widescreen preview. Compatible with the Google Slides and PowerPoint software. Alter the style, size, and the background of the slide icons as per your needs. Useful for business owners, students, and managers. Can be viewed on standard screen and widescreen without any fear of pixelation.
-
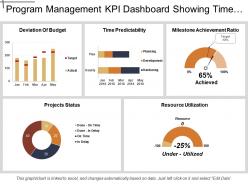 Program management kpi dashboard showing time predictability and resource utilization
Presenting Program Management KPI Dashboard Showing Time Predictability And Resource Utilization PPT slide. The graphical Program Management dashboard PowerPoint template designed by the professional team of SlideTeam to present the different parameters that are essential for any project. The different charts such as line and pie chart, along with that the text in the KPI dashboard slide are editable in PowerPoint. Moreover, this slide is compatible with Google Slide. An individual can edit the font size, font type, color and dimensions of the different figures according to the requirement.
-
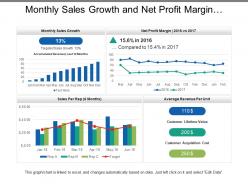 Monthly sales growth and net profit margin dashboard
Presenting this set of slides with name - Monthly Sales Growth And Net Profit Margin Dashboard. This is a four stage process. The stages in this process are Sales Dashboard, Sales Kpis, Sales Performance.
-
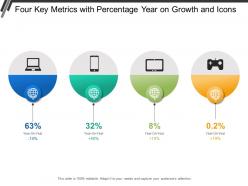 Four key metrics with percentage year on growth and icons
The design template is easy to edit by anyone; you can change design style, shape, font type, size, color, background, image etc. and customize it according to your business needs. Slides can be opened and edited with Google Slides and MS PowerPoint software. You can include business logo, name and your business-related data into text place holders to customize the design. Swift and instant downloading available; designs can be downloaded as JPEG or PDF format.
-
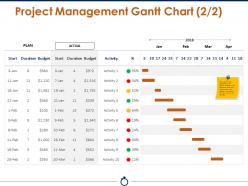 Project management gantt chart ppt background images
Presentation slide can be amended easily as access to change color, text and layout. Astonishing picture quality as pixels don’t break when viewed in widescreen view. Well Assorted with online software programs such as JPG and PDF. Extraordinary quality of resolutions used in PowerPoint template. Matching presentation designs accessible with different nodes and stages. Pre-designed PPT design saves you valuable time. Personalize the presentation with your organization insignia and designation.
-
 Annual saving and budget enhancement powerpoint shapes
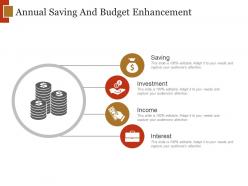
Presenting annual saving and budget enhancement PowerPoint template slide Images. Effortlessly alterable template slide as shading, content and textual styles are customizable. This PPT slide is entirely consistent with Google Slides. Easy to download this slide and save into JPEG and PDF format. Use of the best quality images, graphics, color, and icons. Quick to incorporate business image, name, signature, copyright and picture for personalization of slide. Picture quality does not get harm when displayed on widescreen. Instructional slides are available for guidance.
-
 Business results with statistics
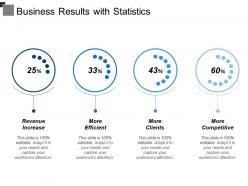
Presenting this set of slides with name - Business Results With Statistics. This is a four stage process. The stages in this process are Business Results, Business Outcomes, Business Output.
-
 Four tags for pricing tables and analysis powerpoint slides
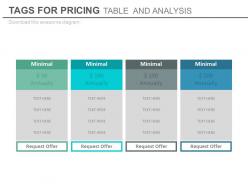
Compelling mix of PPT icons, text, content and background. Pre designed PowerPoint Infographic. Harmonious with large number of software options. Hassle free adaptation in any format. Easy to embrace personalized elements like company logo and name. Hassle free editing of font, color, shade, shape and orientation. Excellence in picture quality even on wide screen output. Used by marketers, businessman, strategists, educationists, financiers, students and stakeholders.
-
 Seller portals seller requirements ppt example
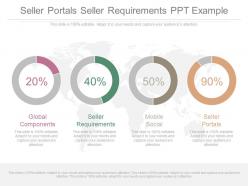
Quick and easy hassle free download in simple steps. Fully modifiable color and contrast of PPT infographics. Totally editable size and orientation of presentation images as per your liking. No change in the high resolution of PPT graphics post editing. Insert company name, brand name, tagline logo etc. for a personalized presentation. Add anywhere between your own slides. The stages in this process are geographical, finance, business, management.
-
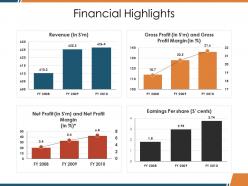 Financial highlights
Presenting this set of slides with name - Financial Highlights. This is a four stage process. The stages in this process are Earnings Per Share, Net Profit, Revenue, Gross Profit, Business.
-
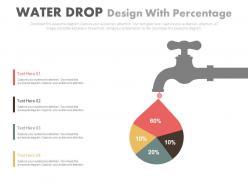 Water drop design with percentage flat powerpoint design
The PowerPoint presentation ensures proofing and editing with ease. Presentation slide is of utmost use to management professionals, big or small organizations and business startups. Text and graphic can be put on show in the same PPT slide. PPT diagram supports recasting the color, size and orientation according to the requirement. High resolution in color and art shape is offered by PPT slide.
-
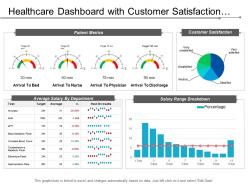 Healthcare dashboard with customer satisfaction and patient metrics
Presenting this set of slides with name - Healthcare Dashboard With Customer Satisfaction And Patient Metrics. This is a four stage process. The stages in this process are Healthcare, Health Improvement, Medical Care.
-
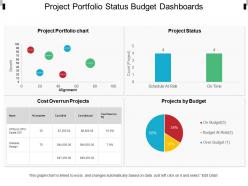 Project portfolio status budget dashboards
Presenting, project portfolio status budget dashboards. This PPT slide believes in delivering a pleasant and great experience to the customers and can be picked by professionals for a great experience. The color of the pie chart sections and text areas can easily be edited according to your need. This PPT slide is also agreeable with google slides and accessible in Fullscreen version. Offhand conversion into PDF/ JPG format. Simple insertion of company trade name/logo.
-
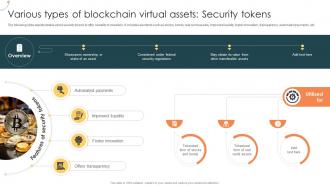 Various Types Of Blockchain Virtual Assets Security Tokens Managing Digital Wealth BCT SS
The following slide depicts details about security tokens to offer benefits to investors. It includes elements such as stocks, bonds, real world assets, improved liquidity, foster innovation, transparency, automated payments, etc. Increase audience engagement and knowledge by dispensing information using Various Types Of Blockchain Virtual Assets Security Tokens Managing Digital Wealth BCT SS This template helps you present information on Four stages. You can also present information on Improved Liquidity, Foster Innovation, Offers Transparency using this PPT design. This layout is completely editable so personaize it now to meet your audiences expectations.
-
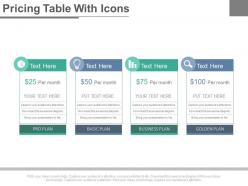 Four staged pricing table with icons powerpoint slides
The visuals bear a high-class image display with no error of pixilation. The option of unlimited customization stays with you to experiment with the colour scheme, orientation features, and size adjustment. Save the said template in various file formats with an easy download option. The templates are fully congruent to Google slides. Explore the feasible options to recast the slides with a complete guide that follows the Ppt.
-
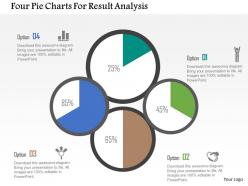 Four Pie Charts For Result Analysis Flat Powerpoint Design
High quality visuals with splendid resolution. 100 percent editable PPT slide templates. Aesthetically designed and professionally proficient. Include or exclude the slide content at your ease and requirement. Compatible with several software options. Harmonious with numerous format options life JPEG, JPG or PDF. Ease of personalization with your company specific name, logo and or trademark.
-
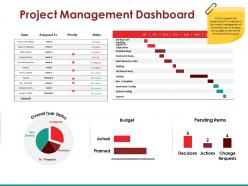 Project management dashboard powerpoint slide ideas
Presenting this set of slides with name - Project Management Dashboard Powerpoint Slide Ideas. This is a four stage process. The stages in this process are Overall Task Status, Budget, Pending Items, Decisions.
-
 Progress report pie chart graph
Presenting this set of slides with name - Progress Report Pie Chart Graph. This is a four stage process. The stages in this process are Progress Report, Growth Report, Improvement Report.
-
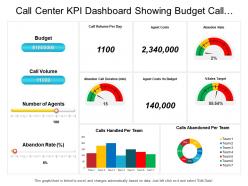 Call center kpi dashboard showing budget call volume agent costs percentage sales target
Presenting this set of slides with name - Call Center Kpi Dashboard Showing Budget Call Volume Agent Costs Percentage Sales Target. This is a four stage process. The stages in this process are Call Center Agent, Customer Care, Client Support.
-
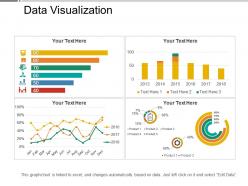 Data visualization
Presenting this Data Visualization PowerPoint slide. This PPT presentation is Google Slides compatible hence it is easily accessible. You can download and save this PowerPoint layout in different formats like PDF, PNG, and JPG. This PPT theme is available in both 4:3 and 16:9 aspect ratios. As this PowerPoint template is 100% editable, you can modify color, font size, font type, and shapes as per your requirements.
-
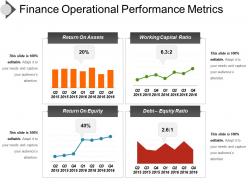 Finance operational performance metrics ppt daigram
Introducing finance operational performance metrics PPT diagram. Exquisitely coordinated PPT design template beneficial for various business professionals. Easily resizable shapes, patterns, and matters etc. Genuine and admissible PPT Image with pliant data options. Adequately compatible with all operating softwares and all Google Slides. Easily convertible to other file formats such as PDF or JPG. Adequate space available to add headings and subheadings. Unaffected high resolution PPT graphic when projected on huge screen.
-
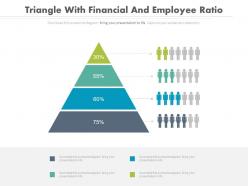 Triangle with financial and employee ratio analysis powerpoint slides
Presenting triangle with financial and employee ratio analysis powerpoint slides. This Power Point template diagram with graphic of triangle and finance icons diagram. This PPT diagram contains the concept of employee ratio analysis. Use this PPT diagram for business and finance related presentations.
-
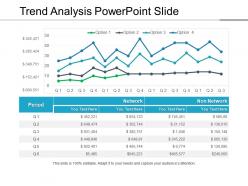 Trend analysis powerpoint slide
Presenting trend analysis PowerPoint template. Access to edit the content, style, size and orientation of the PPT slides. Extremely spacious to cover all the aspects of the company profile. High resolution images do not pixelate when projected on wide screen. Personalize the PPT with your company name and logo. Modify the presentation elements as per the need of an hour. Compatible with numerous software and format options. Used by entrepreneurs, marketers, managerial department, stakeholders and students. Self-explanatory and intellectual slide charts.
-
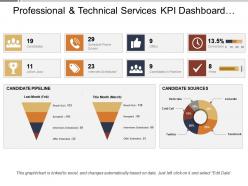 Professional and technical services kpi dashboard showing recruitment and hiring
Presenting this set of slides with name - Professional And Technical Services Kpi Dashboard Showing Recruitment And Hiring. This is a four stage process. The stages in this process are Professional And Technical Services, Services Management, Technical Management.
-
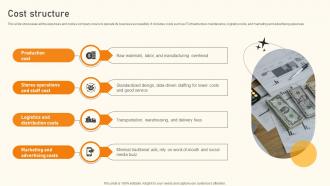 Cost Structure Clothing Store Business Model BMC SS V
This slide showcases all the expenses and costs a company incurs to operate its business successfully. It includes costs such as IT infrastructure maintenance, logistics costs, and marketing and advertising expenses. Increase audience engagement and knowledge by dispensing information using Cost Structure Clothing Store Business Model BMC SS V. This template helps you present information on four stages. You can also present information on Production Cost, Stores Operations And Staff Cost, Logistics And Distribution Costs using this PPT design. This layout is completely editable so personaize it now to meet your audiences expectations.
-
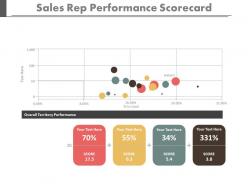 App sales rep performance scorecard to understand sales numbers powerpoint slides
Simple, hassle free and swift to download. Absolutely editable PPT infographics – alter the color scheme and contrast. No change in high resolution of PPT images after editing. Add text to supplement the graphics to suit the context of your presentation. Modify the size and orientation of presentation icons to your liking. Insert your company logo, brand name, trademark etc.
-
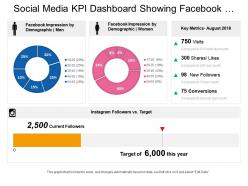 Social media kpi dashboard showing facebook impression by demographic instagram key metrics
Presenting this set of slides with name - Social Media Kpi Dashboard Showing Facebook Impression By Demographic Instagram Key Metrics. This is a four stage process. The stages in this process are Social Media, Digital Marketing, Social Marketing.
-
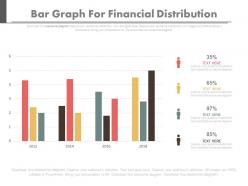 Bar graph for financial distribution with year based analysis powerpoint slides
Amendable PowerPoint presentation backgrounds. Technology and action oriented diagrams. Clearly describes the business and finance related information without creating any doubts. Performs remarkably and wraps up the entire presentation on time. Enhances the image of the organisation with their impressive layout. Offers orientation and ungrouping the objects. Can be conveniently modified without any specific training.
-
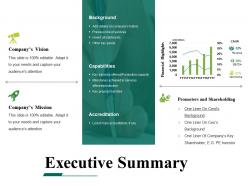 Executive summary powerpoint templates microsoft
Presenting executive summary powerpoint templates microsoft. This is a executive summary powerpoint templates microsoft. This is a four stage process. The stages in this process are accreditation, capabilities, background, promoters and shareholding.
-
 Information technology kpi dashboard showing overdue tasks deadlines
Introducing information technology KPI dashboard showing overdue tasks deadlines PowerPoint template. PPT slides offer a thorough editable customization of font, color, and orientation of high powered info-graphics. Quick and easy downloading process. Suitable for business managers and professionals. Sufficient space is available for the easy placement of desired content. Templates are compatible with wide range of software such as pdf/jpeg/Jpg. PPT design can be access in standard and widescreen view. Editing instructions are explained step by step.
-
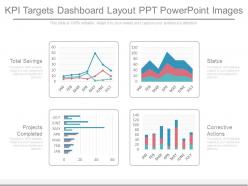 Kpi targets dashboard layout ppt powerpoint images
Presenting kpi targets dashboard layout ppt powerpoint images. This is a kpi targets dashboard layout ppt powerpoint images. This is a four stage process. The stages in this process are total savings, projects completed, status, corrective actions.
-
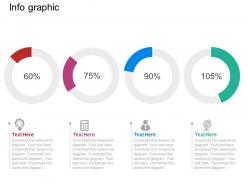 Use pie charts with percentage and icons flat powerpoint design
Modifiable PPT Slide with pie charts with percentage and icons. Compatible with numerous format options like JPEG, JPG or PDF. Provides a professional outlook to your PowerPoint presentation. Icons are also be added. Customization of each PowerPoint graphic and text according to your desire and want. Available in Widescreen slide size also. Freedom to customize it with company name and logo. Beneficial for business professionals, students, teachers, business analysts and strategists. Compatible with Google slides as well.
Toggle Nav

Skip to Content

Search
5
Notifications 5
-
 SlideTeam added 225 new products (e.g. Completely Researched Decks, Documents, Slide Bundles, etc), which included 3375 slides in total in the past 24 hours.
20 hours ago
-
 Get in touch with your inner creative with our downloadable resources. Access our PowerPoint Ebooks and become a brilliant presentation designer.
1 day ago
-
 SlideTeam added 1070 new products (e.g. Completely Researched Decks, Documents, Slide Bundles, etc), which included 16050 slides in total in the past 24 hours.
1 day ago
-
 SlideTeam has published a new blog titled "Must Have Nursing Roadmap Templates with Samples and Examples".
2 days ago
-
 SlideTeam has published a new blog titled "Must-Have Product Information Sheet Templates with Samples and Examples".
2 days ago

