-
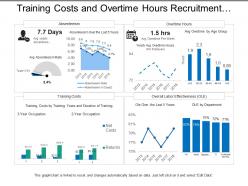 Training costs and overtime hours recruitment dashboard
Presenting this set of slides with name - Training Costs And Overtime Hours Recruitment Dashboard. This is a four stage process. The stages in this process are Staffing Plan, Recruitment, Staff Management.
-
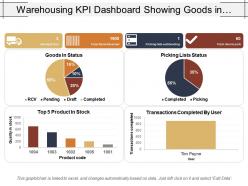 Warehousing kpi dashboard showing goods in status
The presentation design is easy to edit by anyone even having without any specific knowledge. Design elements are editable including font, type, color, size, style, shape, background, images etc. Slides are completely compatible with Google Slides and MS PowerPoint software. Both standard and full screen view available; no change on design quality will happen when opened on full screen view.
-
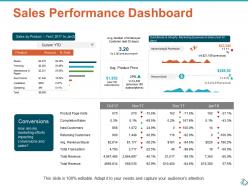 Sales performance dashboard ppt show infographic template
Presenting this set of slides with name - Sales Performance Dashboard Ppt Show Infographic Template. This is a four stage process. The stages in this process are Business, Planning, Strategy, Marketing, Management.
-
 Tap and water drop diagram for data powerpoint slides
Brimming with aesthetic appeal and professional parameters. Uncluttered and intense projection of relevant visuals. Harmonious use of PPT icons, colors, fonts and designs with respect to the subject. Freedom to execute changes in slide background as per individual’s preference. Flexibility to customize it with company specific elements like name, logo and trademark. Compatibility with multiple software and format options. High resolution and stupendous quality visuals. Used by several business strategists, stakeholders, managers, students, financiers, sales professionals and entrepreneurs.
-
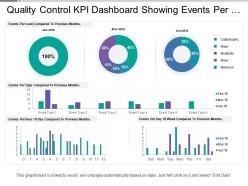 Quality control kpi dashboard showing events per hour and day
Presenting this set of slides with name - Quality Control Kpi Dashboard Showing Events Per Hour And Day. This is a four stage process. The stages in this process are Quality Management, Quality Control, Quality Assurance.
-
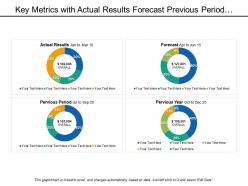 Key metrics with actual results forecast previous period and year
Presenting this set of slides with name - Key Metrics With Actual Results Forecast Previous Period And Year. This is a four stage process. The stages in this process are Key Metrics, Key Performance Indicator, Kpi.
-
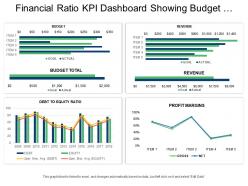 Financial ratio kpi dashboard snapshot showing budget revenue and profit margins
Presenting this set of slides with name - Financial Ratio Kpi Dashboard Snapshot Showing Budget Revenue And Profit Margins. This is a four stage process. The stages in this process are Accounting Ratio, Financial Statement, Financial Ratio.
-
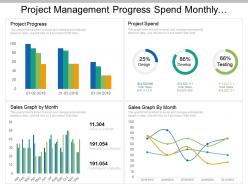 Project management progress spend monthly growth dashboard
Presentation design is easy download and can be changed into other software programs such as JPEG and PDF. Personalize the PowerPoint template with brand name, logo and image. Presentation slide is available with choice to download with different nodes and stages. Completely editable PPT slide can be edited as colors, icons, and text. Easy to present amongst large set of audience as accessible in widescreen view option. PowerPoint graphic can be merged with Google slides as fully compatible with them.
-
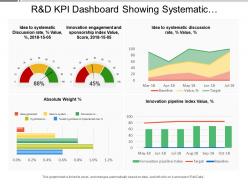 R and d kpi dashboard showing systematic discussion rate innovation engagement and sponsorship index
Presenting this set of slides with name - R And D Kpi Dashboard Showing Systematic Discussion Rate Innovation Engagement And Sponsorship Index. This is a four stage process. The stages in this process are R And D, Research And Development, Research And Technological Development.
-
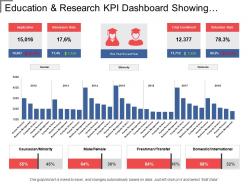 Education and research kpi dashboard showing retention rate and admissions
Presenting education and research KPI dashboard showing retention rate and admissions PPT slide. The KPI for school teachers PPT slide designed by professional team of SlideTeam. The education presentation slide is customizable in PowerPoint. The education KPI dashboard PowerPoint template is also compatible with Google Slide so a user can share this template with others via the internet. A user can make changes in the font size, font type, color as well as dimensions of the key performance indicators for schools & education management PPT slide as per the requirement. You may edit the value in the KPI dashboard higher education template as the template get linked with Excel sheet.
-
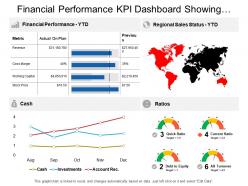 Financial performance kpi dashboard showing regional sales status cash and ratios
Presenting this set of slides with name - Financial Performance Kpi Dashboard Showing Regional Sales Status Cash And Ratios. This is a four stage process. The stages in this process are Financial Performance, Financial Report, Financial Review.
-
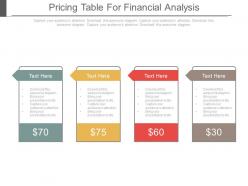 Four staged pricing table for financial analysis powerpoint slides
Presenting four staged pricing table for financial analysis powerpoint slides. This Power Point template slide has been crafted with graphic of four staged pricing table. This PPT slide contains the concept of financial data analysis. Use this PPT slide for business and finance related presentations.
-
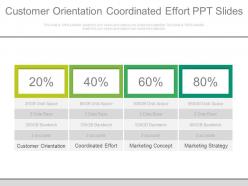 Customer orientation coordinated effort ppt slides
High quality images and visuals used in the PPT design. Fully modifiable Presentation slide as editing is possible. Access to alter the design into JPEG and PDF document. Download is quick and can be easily shared. PowerPoint slides well-suited with Google slides. Template designs available with different nodes and stages. Valuable for corporate executives and sales associates.The stages in this process are customer orientation, coordinated effort, marketing concept, marketing strategy.
-
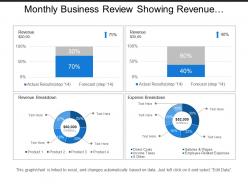 Monthly business review showing revenue and expense breakdown
Presenting this set of slides with name - Monthly Business Review Showing Revenue And Expense Breakdown. This is a four stage process. The stages in this process are Monthly Business Review, Monthly Business Report, Monthly Company Review.
-
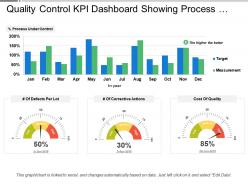 Quality control kpi dashboard showing process under control and cost of quality
Presenting this set of slides with name - Quality Control Kpi Dashboard Showing Process Under Control And Cost Of Quality. This is a four stage process. The stages in this process are Quality Management, Quality Control, Quality Assurance.
-
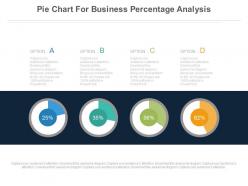 Four pie charts for business percentage analysis powerpoint slides
Presenting four pie charts for business percentage analysis powerpoint slides. This Power Point template slide has been crafted with graphic of four pie charts. This PPT slide contains the concept of business revenue and data analysis. Use this PPT slide for business and finance related presentations.
-
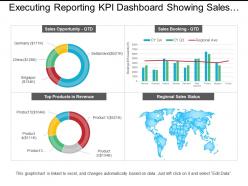 Executing reporting kpi dashboard showing sales opportunity and sales booking
Presenting this set of slides with name - Executing Reporting Kpi Dashboard Showing Sales Opportunity And Sales Booking. This is a four stage process. The stages in this process are Executive Reporting, Executive Analysis, Executive Performance.
-
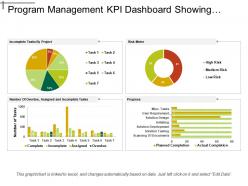 Program management kpi dashboard showing incomplete tasks and risk meter
Presenting this set of slides with name - Program Management Kpi Dashboard Showing Incomplete Tasks And Risk Meter. This is a four stage process. The stages in this process are Program Development, Human Resource Management, Program Management.
-
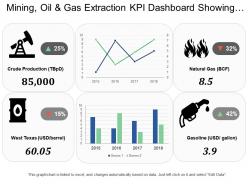 Mining oil and gas extraction kpi dashboard showing crude production and natural gas
Presenting this set of slides with name - Mining Oil And Gas Extraction Kpi Dashboard Showing Crude Production And Natural Gas. This is a four stage process. The stages in this process are Mining, Oil And Gas Extraction, Refinery, Natural Gas.
-
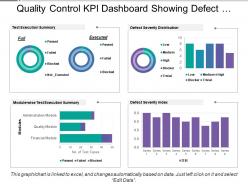 Quality control kpi dashboard showing defect severity distribution
Presenting this set of slides with name - Quality Control Kpi Dashboard Showing Defect Severity Distribution. This is a four stage process. The stages in this process are Quality Management, Quality Control, Quality Assurance.
-
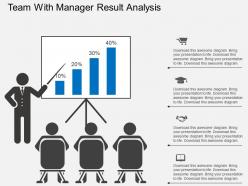 Ho team with manager result analysis flat powerpoint design
All images are 100% editable in the presentation design. Presentation slide supports changing the color, size and orientation of any icon to your liking. It is easy to download and edit the PPT visual for further use. Beneficial for businessmen for managing production, purchasing or for research and development. Compatibility of PowerPoint is not only for Windows and Mac but also Google slides.
-
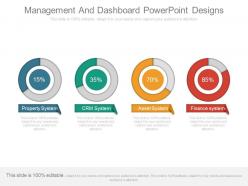 Ppt management and dashboard powerpoint designs
The PPT template use high-resolution icons and the graphics. It is a completely editable PPT slide icon to ensure you edit all the required information in the template. User can replace the traditional watermark in the template with company’s name or logo. This ready to use management PPT icon is useful for the business owners, human resource individuals and the management learners. The stages in this process are property system, crm system, asset system, finance system.
-
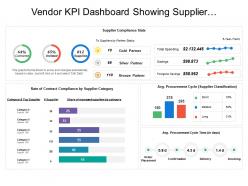 Vendor kpi dashboard showing supplier compliance stats and procurement cycle time
Presenting this set of slides with name - Vendor Kpi Dashboard Showing Supplier Compliance Stats And Procurement Cycle Time. This is a four stage process. The stages in this process are Vendor, Supplier, Retailer.
-
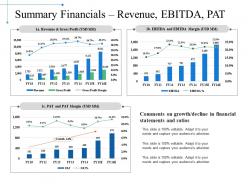 Summary financials revenue ebitda pat powerpoint slide download
Presenting this set of slides with name - Summary Financials Revenue Ebitda Pat Powerpoint Slide Download. This is a four stage process. The stages in this process are Business, Marketing, Finance, Planning, Analysis.
-
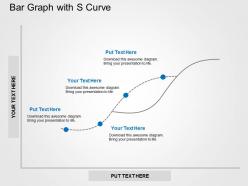 Bar graph with s curve flat powerpoint design
Well compatible with Google slides. Customize PPT layout, font, text, color and design as per your style. Follow the instructions for editing and changing the slide. No diversion of pixels when opened on a wide screen display. Useful for the business managers or entrepreneurs. Can be easily converted into PDF or JPG formats. Downloads instantly in a snap or Easy to download.
-
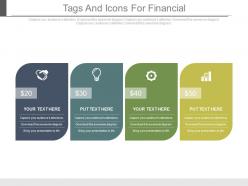 Four tags and icons for financial update powerpoint slides
The visuals impose a stunning impact with its high-resolution picture quality. Download the template in various file formats available. Conduct an easy play of templates in Google slides and other software options. Utilize the unlimited customize options to fabricate the Ppt as per your suitability. Insert the desired text and other details of your company with a few clicks.
-
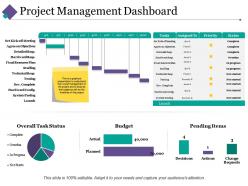 Project management dashboard snapshot ppt pictures infographic template
Displaying project management dashboard snapshot PPT picture infographic template. Alter the design with trade components like name and picture. Presentation slide is well-harmonized with Google slides. Colors and text can be replaced as the PowerPoint graphic comes with easy editing options. Rapid and easy download with saving options. PPT diagram can be viewed in both standard and widescreen display view. Flexible with other software options such as PDF or JPG formats.
-
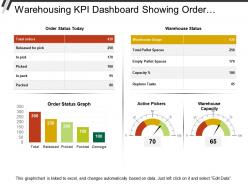 Warehousing kpi dashboard showing order status and active pickers
The design template is compatible with Google Slides and MS PowerPoint software. You can download this design into various formats such as JPEG or PDF format. The warehouse KPI dashboard PPT design template is 100% editable; you can modify and personalize the design according to your business requirements. Design is fully supported on standard and full screen view; no change in design quality on full screen view.
-
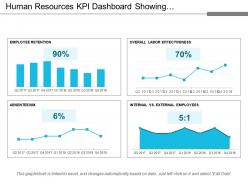 Human resources kpi dashboard showing employee retention absenteeism
Presenting this set of slides with name - Human Resources Kpi Dashboard Showing Employee Retention Absenteeism. This is a four stage process. The stages in this process are Human Resource, Hrm, Human Capital.
-
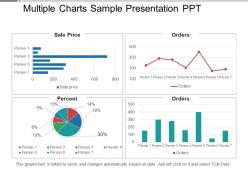 Multiple charts sample presentation ppt
Presenting, multiple Charts Sample Presentation PPT. This is a fully editable PPT for data representation in business presentations. Text, icons, colors used here can be personalized by making a few clicks. Edit the text to write a brief about the topic according to your analysis. Compatible with Google Slides and can be projected on wide screens. Suitable for use by managers, employees, and organizations. Includeyour company logo here in the PPT to personalize further. Use ths design with Google Slides at ease and project on widescreens for your best experience. Download this PowerPoint deck in a snap and explore full features.
-
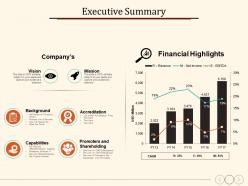 Executive summary background accreditation capabilities vision mission
Presenting this set of slides with name - Executive Summary Background Accreditation Capabilities Vision Mission. This is a four stage process. The stages in this process are Background, Accreditation, Capabilities, Vision, Mission.
-
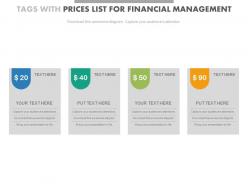 Four tags with price list for financial mangement powerpoint slides
Presenting four tags with price list for financial mangement powerpoint slides. This Power Point template slide has been crafted with graphic of four tags and price list. This PPT slide contains the concept of financial management. Use this PPT slide for business and finance related presentations.
-
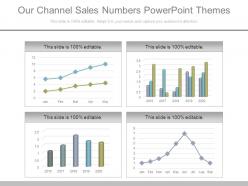 Our channel sales numbers powerpoint themes
Presenting our channel sales numbers powerpoint themes. This is a our channel sales numbers powerpoint themes. This is a four stage process. The stages in this process are growth, dashboard, measuring, management.
-
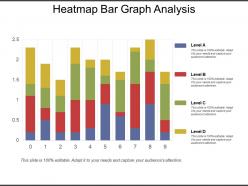 Heatmap bar graph analysis
Presenting heatmap bar graph analysis. This is a heatmap bar graph analysis. This is a four stage process. The stages in this process are heat map, data graphical representation, web analytics.
-
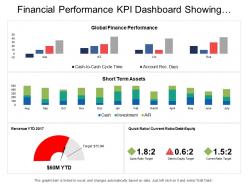 Financial performance kpi dashboard showing revenue quick ratio short term assets
Presenting this set of slides with name - Financial Performance Kpi Dashboard Showing Revenue Quick Ratio Short Term Assets. This is a four stage process. The stages in this process are Financial Performance, Financial Report, Financial Review.
-
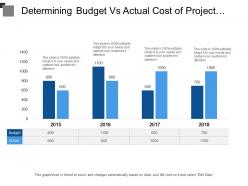 Determining budget vs actual cost of project include year over year analysis
Presenting this set of slides with name - Determining Budget Vs Actual Cost Of Project Include Year Over Year Analysis. This is a four stage process. The stages in this process are Forecast Vs Actual Budget, Actual Vs Budget, Marketing Budget.
-
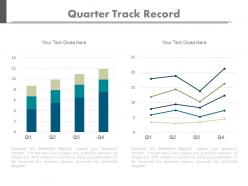 View quarter track record line chart powerpoint slides
Editable PPT Slide for viewing quarterly track record line chart. Compatible with numerous format options like JPEG, JPG or PDF. Access to inclusion and exclusion of contents as per specific needs of any business. Provides a professional outlook to your PowerPoint presentation. Beneficial for business professionals, students, teachers, business analysts and strategists. Customization of each PowerPoint graphic and text according to your desire and want. Available in Widescreen slide size also. Freedom to customize it with company name and logo.
-
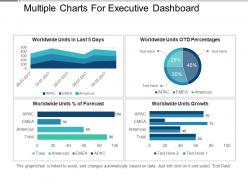 Multiple charts for executive dashboard snapshot presentation layouts
Presenting, multiple charts for executive dashboard snapshot presentation layouts. Use this PPT deck for data representation related presentations. All elements shown here are fully editable and can quickly be edited in terms of change in color or editing the text or size. Edit text boxes to describe the subject. Compatible with Google Slides, this slide can be edited in any PowerPoint software and is available in both standard 4:3 and widescreen format 16:9 after downloading. Easily edit, change the colors, a company logo. Include your company logo by following the guidelines and include your company logo by following a few steps.
-
 Data analytic icon bar graph
Presenting Data Analytic Icon Bar Graph template. The slide is compatible with Google Slides which makes it accessible at once. The slide is completely editable. It can be saved in various document formats such as JPEG, PNG, or PDF. Moreover, both standard screen(4:3) and widescreen(16:9) aspect ratios are supported. High-quality graphics ensure that distortion does not occur.
-
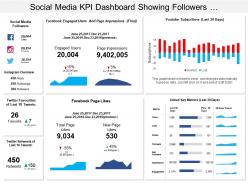 Social media kpi dashboard showing followers youtube subscribers facebook page likes
Presenting social media KPI dashboard PPT template. Makes the information clear in the mind of the audience. Editable and excel linked visuals, colors and text. Easy to edit and customize as per your needs. Beneficial for industry professionals, technologists, managers, executives, researchers, sales people, etc. Flexible presentation designs can be presented in standard and widescreen view. Has a futuristic and realistic approach. Privilege of insertion of logo and trademarks for more personalization. Easy to download and save. Highly beneficial PowerPoint Slide for highlighting pie charts.
-
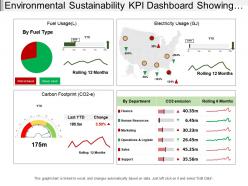 Environmental sustainability kpi dashboard showing carbon footprint and electricity usage
Presenting the environmental sustainability KPI dashboard PowerPoint slide. This presentation slide is fully editable in PowerPoint. It is customizable according to your requirement. The font color, style, size, diagram color and background color of slide can be changed as per your requirement. You can conveniently replace the sample content in text placeholders with your presentation content. This template is suitable for use with Google Slides. It can be saved in JPG or PDF formats. It is available in both standard size and wide screen size. Download it quickly at the click of a button.
-
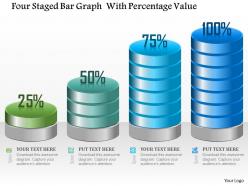 1214 four staged bar graph with percentage value powerpoint template
Simple to incorporate company name, logo, trademark and animation. Free of space constraints to mention titles and subtitles. Customize PPT layout, font, text, color and design as per your style. Can be easily converted to PDF or JPG formats. High-resolution PowerPoint slides graphics. We have crafted this PPT keeping in mind the professional requirement from the professional designers.
-
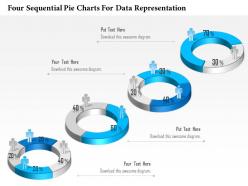 1114 four sequential pie charts for data representation presentation template
Easy proofing and editing is added on feature of presentation visual. Presentation slide is useful in business marketing, management and recourse disbursement. Basic theme yet it can modified with respect to font, color and layout. Attractive color scheme gives a professional look to PPT layout. Conversion into PDF or JPG formats is very easy and handy. PPT graphic offers font size which can be read from a distance.
-
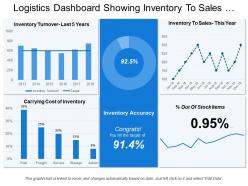 Logistics dashboard showing inventory to sales and inventory turnover
Presenting Logistics Dashboard Showing Inventory To Sales And Inventory Turnover PPT slide. The inventory to sale dashboard PowerPoint template designed professionally by the team of SlideTeam to present the annual report to clients and investors too. The different charts such as bar, line and many other, along with that the text in the inventory dashboard slide are customizable in PowerPoint. The logistics inventory dashboard slide is compatible with Google Slide. An individual can make changes in the font size, font type, color and dimensions of the different icons according to the requirement. This graphical inventory slide gets linked with Excel Data Sheet.
-
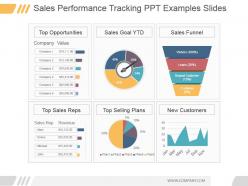 Sales performance tracking ppt examples slides
Presenting sales performance tracking ppt examples slides. This is a sales performance tracking ppt examples slides. This is a four stage process. The stages in this process are top opportunities, sales goal ytd, sales funnel, company, value, company, visitors, leads, repeat customer, customer, top sales reps, top selling plans, new customers, plan, jan, mar, may, jul, sep, nov, sales rep, mary, emma, michael, john.
-
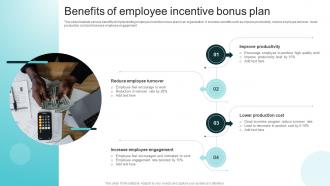 Benefits Of Employee Incentive Bonus Plan
This slide illustrate various benefits of implementing employee incentive bonus plan in an organization. It includes benefits such as improve productivity, reduce employee turnover, lower production cost and increase employee engagement. Introducing our premium set of slides with Benefits Of Employee Incentive Bonus Plan. Ellicudate the four stages and present information using this PPT slide. This is a completely adaptable PowerPoint template design that can be used to interpret topics like Reduce Employee Turnover, Improve Productivity, Lower Production Cost So download instantly and tailor it with your information.
-
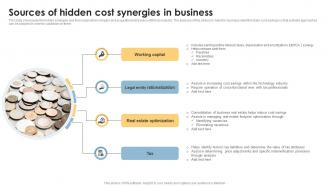 Sources Of Hidden Cost Synergies In Business
This slide showcases the hidden synergies and their origin when mergers and acquisitions take place within an industry. The purpose of this slide is to help the business identify hidden cost savings so that suitable approaches can be adopted in order to capitalize on them. Introducing our premium set of slides with Sources Of Hidden Cost Synergies In Business Ellicudate the four stages and present information using this PPT slide. This is a completely adaptable PowerPoint template design that can be used to interpret topics like Working Capital, Legal Entity Rationalization, Real Estate Optimization So download instantly and tailor it with your information.
-
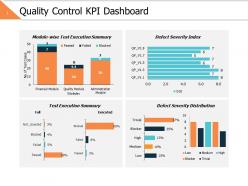 Quality control kpi dashboard ppt powerpoint presentation gallery diagrams
Presenting this set of slides with name - Quality Control Kpi Dashboard Ppt Powerpoint Presentation Gallery Diagrams. This is a four stage process. The stages in this process are Business, Management, Strategy, Analysis, Finance.
-
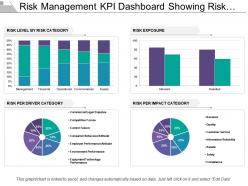 Risk Management Kpi Dashboard Showing Risk Level Exposure And Impact
Presenting this set of slides with name - Risk Management Kpi Dashboard Showing Risk Level Exposure And Impact Category. This is a four stage process. The stages in this process are Risk Management, Risk Assessment, Project Risk.
-
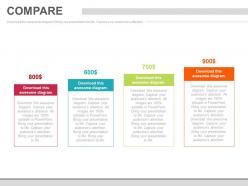 Four tags for comparison analysis chart powerpoint slides
Presenting four tags for comparison analysis chart powerpoint slides. This Power Point template diagram with graphic of four tags and icons. This PPT diagram contains the concept of comparison analysis. Use this PPT diagram for business and finance related presentations.
-
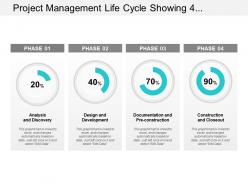 Project management life cycle showing 4 phases with value of percentage complete
Presenting this set of slides with name - Project Management Life Cycle Showing 4 Phases With Value Of Percentage Complete. This is a four stages. The stages in this process are 4 Phases, 4 Segments, 4 Parts.
-
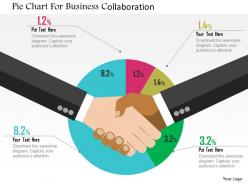 Pie chart for business collaboration flat powerpoint design
We are proud to present our pie chart for business collaboration flat powerpoint design. Graphic of pie chart has been used to craft this power point template diagram. This PPT diagram contains the concept of business collaboration. Use this PPT diagram for business presentations.
-
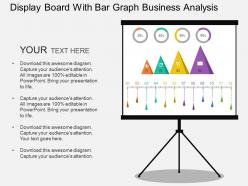 Display board with bar graph business analysis flat powerpoint design
We are proud to present our display board with bar graph business analysis flat powerpoint design. This power point template diagram has been crafted with graphic of display board and bar graph. This PPT diagram contains the concept of business analysis. Use this PPT diagram for business and marketing related presentations.
-
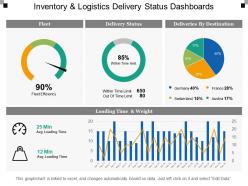 Inventory and logistics delivery status dashboards
Presenting this set of slides with name - Inventory And Logistics Delivery Status Dashboards. This is a four stage process. The stages in this process are Inventory And Logistics, Inventory Management, Warehousing And Inventory Management.
-
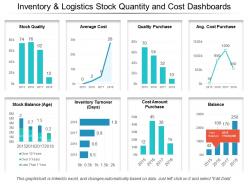 Inventory and logistics stock quantity and cost dashboards
Presenting this set of slides with name - Inventory And Logistics Stock Quantity And Cost Dashboards. This is a four stage process. The stages in this process are Inventory And Logistics, Inventory Management, Warehousing And Inventory Management.
-
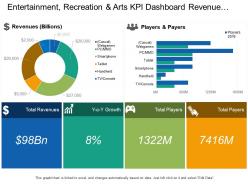 Entertainment recreation and arts kpi dashboard revenue players and payers
Presenting this set of slides with name - Entertainment Recreation And Arts Kpi Dashboard Revenue Players And Payers. This is a four stage process. The stages in this process are Entertainment, Recreation And Arts, Attractions, Culture, Entertainment.
-
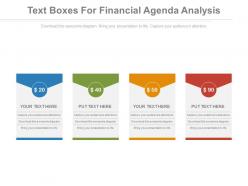 Four text boxes for financial agenda analysis powerpoint slides
Adaptable introduction slides as completely perfect with Google slides. PowerPoint outline open in standard and widescreen see. 100% modifiable PPT format as altering is conceivable with shading, content and textual style. Comparable outlines accessible with various hubs and stages. Simple to download and share. Snappy to change over into JPEG and PDF archive. Ideal for Finance pioneers, sellers, bankers, and administrators.
-
 Kpi for projects dashboard snapshot ppt powerpoint slide themes
Presenting kpi for projects dashboard ppt powerpoint slide themes. This is a kpi for projects dashboard snapshot ppt powerpoint slide themes. This is a four stage process. The stages in this process are costs, resource bug allocations, burndown, project status green.
-
 Social media kpi dashboard showing traffic social events referral traffic
Presenting this set of slides with name - Social Media Kpi Dashboard Showing Traffic Social Events Referral Traffic. This is a four stage process. The stages in this process are Social Media, Digital Marketing, Social Marketing.
-
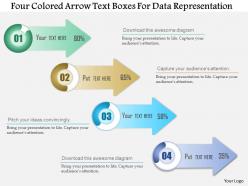 1114 four colored arrow text boxes for data representation presentation template
Proofing and editing can be done with ease in PPT design. Smooth functioning is ensured by the presentation slide show on all software’s. Color, style and position can be standardized, supports font size which can be read from a distance. When projected on the wide screen the PPT layout does not sacrifice on pixels or color resolution.
Toggle Nav

Skip to Content

Search
5
Notifications 5
-
 SlideTeam added 225 new products (e.g. Completely Researched Decks, Documents, Slide Bundles, etc), which included 3375 slides in total in the past 24 hours.
10 hours ago
-
 Get in touch with your inner creative with our downloadable resources. Access our PowerPoint Ebooks and become a brilliant presentation designer.
1 day ago
-
 SlideTeam added 1070 new products (e.g. Completely Researched Decks, Documents, Slide Bundles, etc), which included 16050 slides in total in the past 24 hours.
1 day ago
-
 SlideTeam has published a new blog titled "Must Have Nursing Roadmap Templates with Samples and Examples".
2 days ago
-
 SlideTeam has published a new blog titled "Must-Have Product Information Sheet Templates with Samples and Examples".
2 days ago


