-
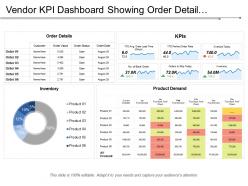 Vendor kpi dashboard showing order detail inventory and orders to ship today
Presenting this set of slides with name - Vendor Kpi Dashboard Showing Order Detail Inventory And Orders To Ship Today. This is a four stage process. The stages in this process are Vendor, Supplier, Retailer.
-
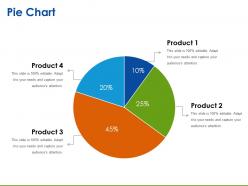 Pie chart ppt sample download
Presenting pie chart ppt sample download. This is a pie chart ppt sample download. This is a four stage process. The stages in this process are pie chart, finance, analysis, marketing, strategy, business.
-
 Growth chart with team management result analysis target achievement flat powerpoint design
We are proud to present our growth chart with team management result analysis target achievement flat powerpoint design. Graphic of growth chart has been used to craft this power point template diagram. This PPT diagram contains the concept of result analysis and target achievement. Use this PPT diagram for global business and marketing related presentations.
-
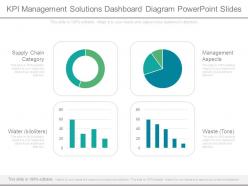 Kpi management solutions dashboard diagram powerpoint slides
Presenting kpi management solutions dashboard diagram powerpoint slides. This is a kpi management solutions dashboard diagram powerpoint slides. This is a four stage process. The stages in this process are supply chain category, water, management aspects, waste.
-
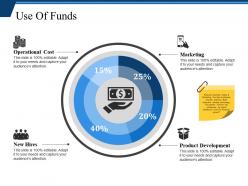 Use of funds powerpoint slide templates download
Presenting this set of slides with name - Use Of Funds Powerpoint Slide Templates Download. This is a four stage process. The stages in this process are Operational Cost, Marketing, New Hires, Product Development.
-
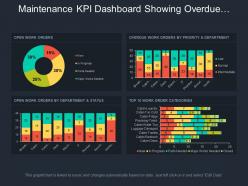 Maintenance kpi dashboard showing overdue work orders by priority and department
Presenting this set of slides with name - Maintenance Kpi Dashboard Showing Overdue Work Orders By Priority And Department. This is a four stage process. The stages in this process are Maintenance, Preservation, Conservation.
-
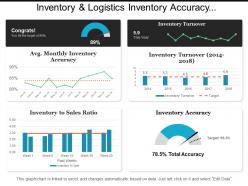 Inventory and logistics inventory accuracy dashboards
Presenting this set of slides with name - Inventory And Logistics Inventory Accuracy Dashboards. This is a four stage process. The stages in this process are Inventory And Logistics, Inventory Management, Warehousing And Inventory Management.
-
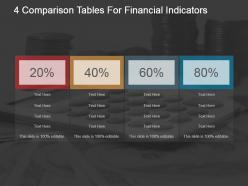 4 comparison tables for financial indicators powerpoint graphics
Presenting 4 Comparison Tables For Financial Indicators PowerPoint Graphics slide. The slide is fully customizable in PowerPoint. The colors of background and table can be changed as per your requirement. The presentation content can replace the dummy text. The font style, size and colors can be altered. Company name and logo can be inserted with ease. The template is suitable for use in Google Slides too. It is available in 4:3 and 16:9 aspect ratios. High resolution ensures good quality. It can be downloaded easily.
-
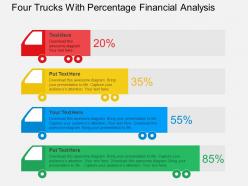 Four trucks with percentage financial analysis flat powerpoint design
Slide runs effortlessly on all software. Download slides in moments. Add company logo, name or trademark with no trouble. No pixilation when slide is viewed on widescreen. Compatible with google slides. Display titles and subtitles with no space constraints. High resolution PPT slides. Convert to JPG and PDF formats lucidly. Useful for businesses, small and large, startups and project managers.
-
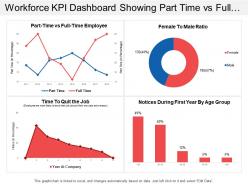 Workforce kpi dashboard showing part time vs full time employee
Presenting this set of slides with name - Workforce Kpi Dashboard Showing Part Time Vs Full Time Employee. This is a four stage process. The stages in this process are Staff, Personnel, Workforce.
-
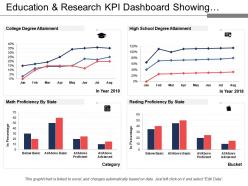 Education and research kpi dashboard showing degree attainment and proficiency
Presenting education and research KPI dashboard showing degree attainment and proficiency PPT slide. The educational degree attainment KPI report presentation slide designed by the professional team of SlideTeam. The education population analysis PPT template is fully editable in PowerPoint. The research status KPI report presentation template is compatible with Google Slide so a user can share this degree attainment metric dashboard slide with others. A user can make changes in the font size, font type, color as well as dimensions of the proficiency KPI dashboard PPT slide as per the requirement. You may edit the value in the education proficiency report slide as the slide gets linked with the Excel sheet.
-
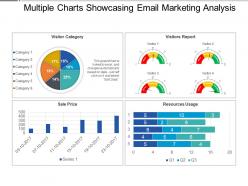 Multiple charts showcasing email marketing analysis presentation slides
Introducing multiple charts showcasing email marketing analysis PPT slide. This is exclusively codified PPT design scheme which is quite suitable for business managers, marketing experts etc. This PPT graphic can be acclimating with divergent softwares and Google Slides. This Presentation template can be customizable in to other file formats like PDF or JPG. Offers an alterable designs, forms, colors, contents etc. Also provides an option to add company name or emblem with this PPT template.
-
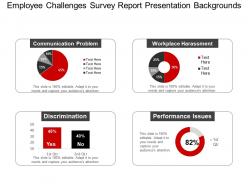 Employee challenges survey report presentation backgrounds
Presenting employee challenges survey report presentation backgrounds. This is a employee challenges survey report presentation backgrounds. This is a four stage process. The stages in this process are survey, forecasting, statistics.
-
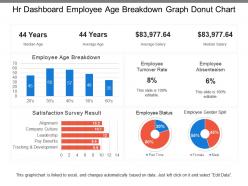 Hr dashboard employee age breakdown graph donut chart
Presenting this set of slides with name - Hr Dashboard Employee Age Breakdown Graph Donut Chart. This is a four stage process. The stages in this process are Hr Dashboard, Human Resource Dashboard, Hr Kpi.
-
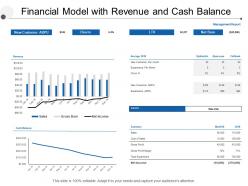 Financial model with revenue and cash balance
Presenting this set of slides with name - Financial Model With Revenue And Cash Balance. This is a four stage process. The stages in this process are Financial Analysis, Income Statement, Balance Sheet.
-
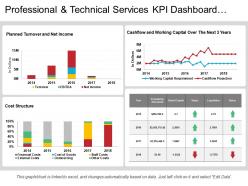 Professional and technical services kpi dashboard showing cost structure
Presenting this set of slides with name - Professional And Technical Services Kpi Dashboard Showing Cost Structure. This is a four stage process. The stages in this process are Professional And Technical Services, Services Management, Technical Management.
-
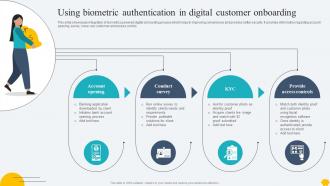 Digitalising Customer Onboarding Using Biometric Authentication In Digital Customer
This slide showcases integration of biometrics powered digital onboarding process which helps in improving convenience and provides better security. It provides information regarding account opening, survey, know your customer and access control. Introducing Digitalising Customer Onboarding Using Biometric Authentication In Digital Customer to increase your presentation threshold. Encompassed with Four stages, this template is a great option to educate and entice your audience. Dispence information on Using Biometric, Digital Customer using this template. Grab it now to reap its full benefits.
-
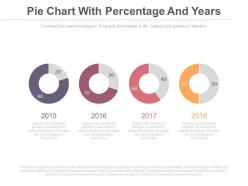 Four pie charts with percentage and years powerpoint slides
Presenting four pie charts with percentage and years powerpoint slides. This is a four pie charts with percentage and years powerpoint slides. This is a four stage process. The stages in this process are financials.
-
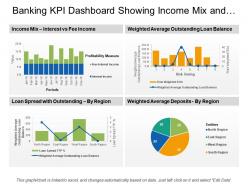 Banking kpi dashboard showing income mix and loan spread
Presenting this set of slides with name - Banking Kpi Dashboard Showing Income Mix And Loan Spread. This is a four stage process. The stages in this process are Banking, Finance, Money.
-
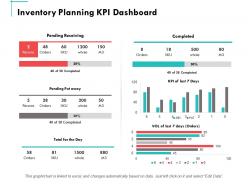 Inventory planning kpi dashboard ppt powerpoint presentation summary graphics
Presenting this set of slides with name - Inventory Planning Kpi Dashboard Ppt Powerpoint Presentation Summary Graphics. This is a four stages process. The stages in this process are Finance, Marketing, Management, Investment, Analysis.
-
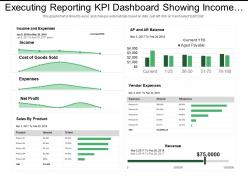 Executing reporting kpi dashboard snapshot showing income sales by product vendor expenses
Presenting this set of slides with name - Executing Reporting Kpi Dashboard Snapshot Showing Income Sales By Product Vendor Expenses. This is a four stage process. The stages in this process are Executive Reporting, Executive Analysis, Executive Performance.
-
 Our market share ppt show
Presenting this set of slides with name - Our Market Share Ppt Show. This is a four stage process. The stages in this process are Wages, Depreciation, Rent And Utilities, Marketing.
-
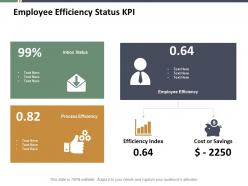 Employee efficiency status kpi ppt summary infographics
Presenting this set of slides with name - Employee Efficiency Status Kpi Ppt Summary Infographics. This is a four stage process. The stages in this process are Business, Management, Marketing.
-
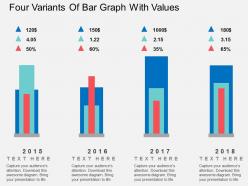 Four variants of bar graph with values flat powerpoint design
We are proud to present our four variants of bar graph with values flat powerpoint design. Graphic of four variants of bar graph with values has been used to craft this power point template diagram. This PPT diagram contains the concept of result analysis. Use this PPT diagram for business and marketing result related presentations.
-
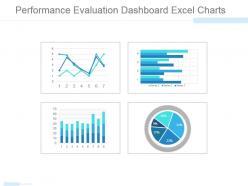 Performance evaluation dashboard excel charts powerpoint topics
Presenting performance evaluation dashboard excel charts powerpoint topics. This is a performance evaluation dashboard excel charts powerpoint topics. This is a four stage process. The stages in this process are graph, finance, dashboard, pie, business.
-
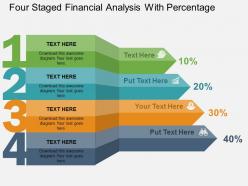 Four staged financial analysis with percentage flat powerpoint design
We are proud to present our four staged financial analysis with percentage flat powerpoint design. Four staged colored numeric banner graphic has been used to design this power point template diagram. This PPT diagram contains the concept of financial analysis and percentage representation. Use this PPT diagram for business and finance related presentations.
-
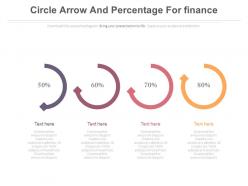 Four circle arrows and percentage for finance powerpoint slides
Presenting four circle arrows and percentage for finance powerpoint slides. This is a four circle arrows and percentage for finance powerpoint slides. This is a four stage process. The stages in this process are financials.
-
 Train diagram with business icons and percentage powerpoint slides
Presenting train diagram with business icons and percentage powerpoint slides. This is a train diagram with business icons and percentage powerpoint slides. This is a three stage process. The stages in this process are financials.
-
 Financing Option For Funding Real Estate Flipping
This slide covers different methods to fund real estate flip. It includes multiple funding options such as cash payment, conventional financing, home equity loan and hard money lender. Introducing our premium set of slides with Financing Option For Funding Real Estate Flipping. Elucidate the four stages and present information using this PPT slide. This is a completely adaptable PowerPoint template design that can be used to interpret topics like Cash Payments, Conventional Financing, Home Equity Loans, Hard Money Lender. So download instantly and tailor it with your information.
-
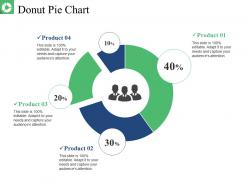 Donut pie chart presentation layouts
Presenting this set of slides with name - Donut Pie Chart Presentation Layouts. This is a four stage process. The stages in this process are Donut Pie Chart, Finance, Marketing, Strategy, Analysis.
-
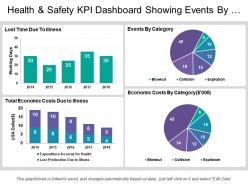 Health and safety kpi dashboard showing events by category
Presenting health and safety presentation template. This modern dashboard design is fully editable and is created under the strict supervision of professionals. You can bring changes to the objects in the slide like font size and font color hassle-free. This presentation slide is fully compatible with Google Slide and can be saved in JPG or PDF file format without any hassle. Fast download this at the click of the button.
-
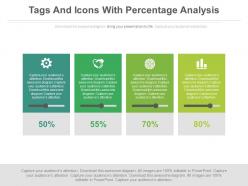 Four tags and icons with percentage analysis powerpoint slides
Presenting four tags and icons with percentage analysis powerpoint slides. This Power Point template diagram with graphic of four staged tags and icons. This PPT diagram contains the concept of percentage analysis. Use this PPT diagram for business and finance related presentations.
-
 Sales Management Report Icon With Key Insights
Introducing our premium set of slides with Sales Management Report Icon With Key Insights. Elucidate the four stages and present information using this PPT slide. This is a completely adaptable PowerPoint template design that can be used to interpret topics like Sales Management Report, Icon, Key Insights. So download instantly and tailor it with your information.
-
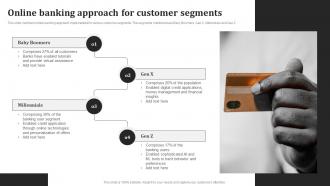 Online Banking Approach For Customer Segments
This slide mentions online banking approach implemented for various customer segments. The segments mentioned are Baby Boomers, Gen X, Millennials and Gen Z. Presenting our set of slides with name Online Banking Approach For Customer Segments. This exhibits information on four stages of the process. This is an easy-to-edit and innovatively designed PowerPoint template. So download immediately and highlight information on Baby Boomers, Millennials, Gen Z, Gen X.
-
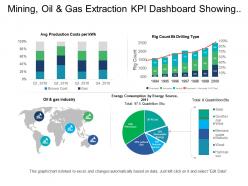 Mining oil and gas extraction kpi dashboard showing average production costs and energy consumption
Presenting this set of slides with name - Mining Oil And Gas Extraction Kpi Dashboard Showing Average Production Costs And Energy Consumption. This is a four stage process. The stages in this process are Mining, Oil And Gas Extraction, Refinery, Natural Gas.
-
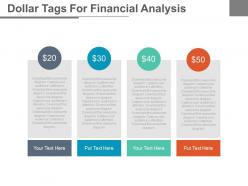 Four dollar tags for financial analysis powerpoint slides
Presenting four dollar tags for financial analysis powerpoint slides. This Power Point template diagram with graphic of four dollar tags. This PPT diagram contains the concept of financial analysis. Use this PPT diagram for business and finance related presentations.
-
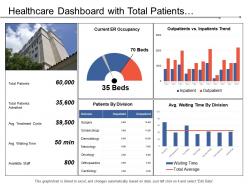 Healthcare dashboard with total patients admitted and average treatment cost
Presenting this set of slides with name - Healthcare Dashboard With Total Patients Admitted And Average Treatment Cost. This is a four stage process. The stages in this process are Healthcare, Health Improvement, Medical Care.
-
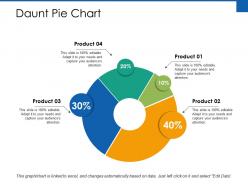 Daunt pie chart ppt powerpoint presentation summary
Presenting this set of slides with name - Daunt Pie Chart Ppt Powerpoint Presentation Summary. This is a four stages process. The stages in this process are Finance, Marketing, Management, Investment, Analysis.
-
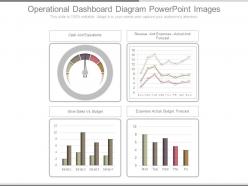 Operational dashboard diagram powerpoint images
Presenting operational dashboard diagram powerpoint images. This is a operational dashboard diagram powerpoint images. This is a four stage process. The stages in this process are cash and equivalents, revenue and expenses actual and forecast, store sales vs budget, expenses actual budget forecast.
-
 Key statistics powerpoint slide templates
Presenting this set of slides with name - Key Statistics Powerpoint Slide Templates. This is a four stage process. The stages in this process are Pie Chart, Marketing, Analysis, Strategy, Business.
-
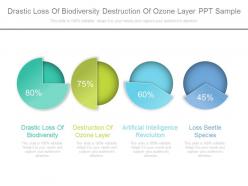 Drastic loss of biodiversity destruction of ozone layer ppt sample
Presenting drastic loss of biodiversity destruction of ozone layer ppt sample. This is a drastic loss of biodiversity destruction of ozone layer ppt sample. This is a four stage process. The stages in this process are drastic loss of biodiversity, destruction of ozone layer, artificial intelligence revolution, loss beetle species.
-
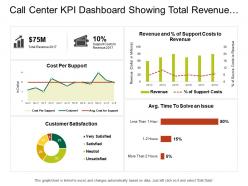 Call center kpi dashboard showing total revenue customer satisfaction costs per support
Presenting this set of slides with name - Call Center Kpi Dashboard Showing Total Revenue Customer Satisfaction Costs Per Support. This is a four stage process. The stages in this process are Call Center Agent, Customer Care, Client Support.
-
 Workforce kpi dashboard showing average age female percentage and average tenure
Presenting this set of slides with name - Workforce Kpi Dashboard Showing Average Age Female Percentage And Average Tenure. This is a four stage process. The stages in this process are Staff, Personnel, Workforce.
-
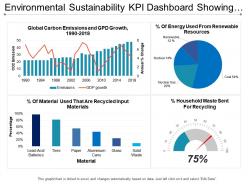 Environmental sustainability kpi dashboard showing global carbon emission and gdp growth
Presenting this set of slides with name - Environmental Sustainability Kpi Dashboard Showing Global Carbon Emission And Gdp Growth. This is a four stage process. The stages in this process are Environment Sustainability, Environment Continual, Environment Feasibility.
-
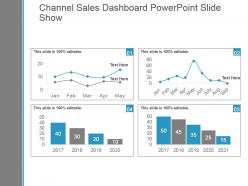 Channel sales dashboard powerpoint slide show
Presenting channel sales dashboard powerpoint slide show. This is a channel sales dashboard powerpoint slide show. This is a four stage process. The stages in this process are business, marketing, line chart, dashboard, management.
-
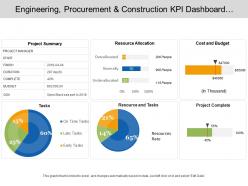 Engineering procurement and construction kpi dashboard showing project summary cost and budget
Presenting this set of slides with name - Engineering Procurement And Construction Kpi Dashboard Showing Project Summary Cost And Budget. This is a four stage process. The stages in this process are Engineering, Procurement And Construction, Construction Management, Engineering, Purchasing And Construction .
-
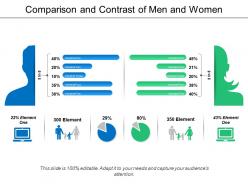 Comparison and contrast of men and women
Presenting this set of slides with name - Comparison And Contrast Of Men And Women. This is a four stage process. The stages in this process are Comparison Of Two, Compare, comeptitive analysis.
-
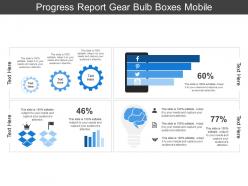 Progress report gear bulb boxes mobile
Presenting this set of slides with name - Progress Report Gear Bulb Boxes Mobile. This is a four stage process. The stages in this process are Progress Report, Growth Report, Improvement Report.
-
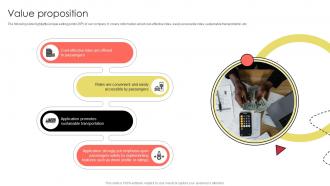 Value Proposition Carpooling Service Pitch Deck
The following slide highlights unique selling point USP of our company. It covers information about cost effective rides, easily accessible rides, sustainable transportation, etc. Introducing Value Proposition Carpooling Service Pitch Deck to increase your presentation threshold. Encompassed with four stages, this template is a great option to educate and entice your audience. Dispense information on Cost Effective Rides, Offered Passengers, Rides Convenient Easily, Application Promotes, using this template. Grab it now to reap its full benefits.
-
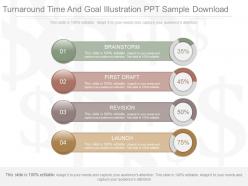 Pptx turnaround time and goal illustration ppt sample download
Presenting pptx turnaround time and goal illustration ppt sample download. This is a turnaround time and goal illustration ppt sample download. This is a four stage process. The stages in this process are brainstorm, first draft, revision, launch.
-
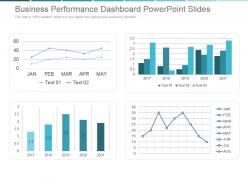 Business performance dashboard powerpoint slides
Presenting business performance dashboard powerpoint slides. This is a business performance dashboard powerpoint slides. This is a four stage process. The stages in this process are business, chart and graph, strategy, success, line graph.
-
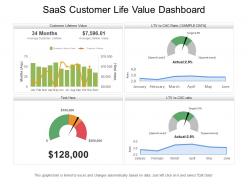 Saas customer life value dashboard
Introducing Saas customer life value dashboard PPT template. An easy access to make the desired changes or edit it anyways. Wide screen view of the slides. Easy conversion into Jpeg or Pdf format. The PPT images offer compatibility with Google templates. High resolution icons for clear message delivery. Unique and informational content. Valuable for business professionals, sales representatives, marketing professionals, students and selling investigators. High quality charts and visuals used in the designing process. They enhance the performance of the presentation.
-
 Company Infrastructure Budgeting Finance Icon
Introducing our premium set of slides with Company Infrastructure Budgeting Finance Icon. Ellicudate the Four stages and present information using this PPT slide. This is a completely adaptable PowerPoint template design that can be used to interpret topics like Company Infrastructure Budgeting Finance Icon. So download instantly and tailor it with your information.
-
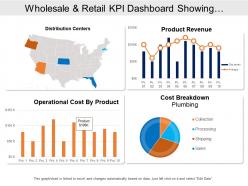 Wholesale and retail kpi dashboard showing distribution centers product revenue
Presenting this set of slides with name - Wholesale And Retail Kpi Dashboard Showing Distribution Centers Product Revenue. This is a four stage process. The stages in this process are Wholesale And Retail, Extensive And Retail, Wholesale And Distribute.
-
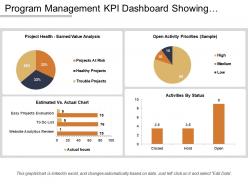 Program management kpi dashboard showing estimated vs actual chart
Presenting this set of slides with name - Program Management Kpi Dashboard Showing Estimated Vs Actual Chart. This is a four stage process. The stages in this process are Program Development, Human Resource Management, Program Management.
-
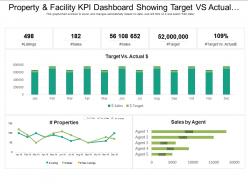 Property and facility kpi dashboard showing target vs actual cost and sales by agent
Get a chance to go through, property and facility KPI dashboard showing target-vs-actual cost and sales by agent PowerPoint Presentation Slide. This Presentation has been designed by professionals and is fully editable. You can have access to alter the font size, font type, colors, and even the background. This Template is amiable with Google Slide and can be saved in JPG or PDF format without any chaos created. Fast download at the click of the button.
-
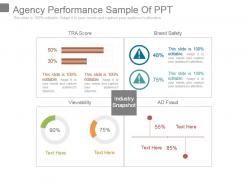 Agency performance sample of ppt
Presenting agency performance sample of ppt. This is a agency performance sample of ppt. This is a four stage process. The stages in this process are tra score, brand safety, viewability, industry snapshot, ad fraud.
-
 Project Management Cost Estimation Icon
Presenting our set of slides with Project Management Cost Estimation Icon. This exhibits information on four stages of the process. This is an easy to edit and innovatively designed PowerPoint template. So download immediately and highlight information on Project Management, Cost Estimation Icon.
-
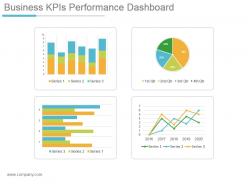 Business kpis performance dashboard snapshot powerpoint slide clipart
Presenting business kpis performance dashboard snapshot powerpoint slide clipart. This is a business kpis performance dashboard powerpoint slide clipart. This is a four stage process. The stages in this process are series, qtr.
-
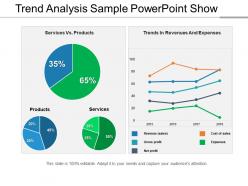 Trend analysis sample powerpoint show
Presenting a PowerPoint slide named Trend Analysis Sample PowerPoint Show. Create a compelling presentation with this PPT diagram, which is both professional and editable. Customize colors, choose font styles, and size. You can choose from a wide variety of icons. Resize and scale the images to fit any content. The PPT slide is compatible with Google Slides and can be fetched at once. You can save it as both PDF and JPG format. This PPT slide is data-driven and linked to the Excel sheet.
Toggle Nav

Skip to Content

Search
5
Notifications 5
-
 SlideTeam added 225 new products (e.g. Completely Researched Decks, Documents, Slide Bundles, etc), which included 3375 slides in total in the past 24 hours.
16 hours ago
-
 Get in touch with your inner creative with our downloadable resources. Access our PowerPoint Ebooks and become a brilliant presentation designer.
1 day ago
-
 SlideTeam added 1070 new products (e.g. Completely Researched Decks, Documents, Slide Bundles, etc), which included 16050 slides in total in the past 24 hours.
1 day ago
-
 SlideTeam has published a new blog titled "Must Have Nursing Roadmap Templates with Samples and Examples".
2 days ago
-
 SlideTeam has published a new blog titled "Must-Have Product Information Sheet Templates with Samples and Examples".
2 days ago


