Real Estate Leasing Dashboard Depicting Agent Performance

Rating:
90%
Real Estate Leasing Dashboard Depicting Agent Performance
Slide 1 of 7
Favourites Favourites

Try Before you Buy Download Free Sample Product

Audience Impress Your
Audience
Editable 100%
Editable
Time Save Hours
of Time
The Biggest Sale is ending soon in
0
0
:
0
0
:
0
0
AI-Ready
Upload this template to AI and ask it to make any changes to content or color
100% editable Powerpoint Template for AI-assisted presentations. Finish your work in less time. ​
Works with
Microsoft PowerPoint
Microsoft 365
Claude for PowerPoint
ChatGPT
Google Slides
Microsoft Copilot
Rating:
90%
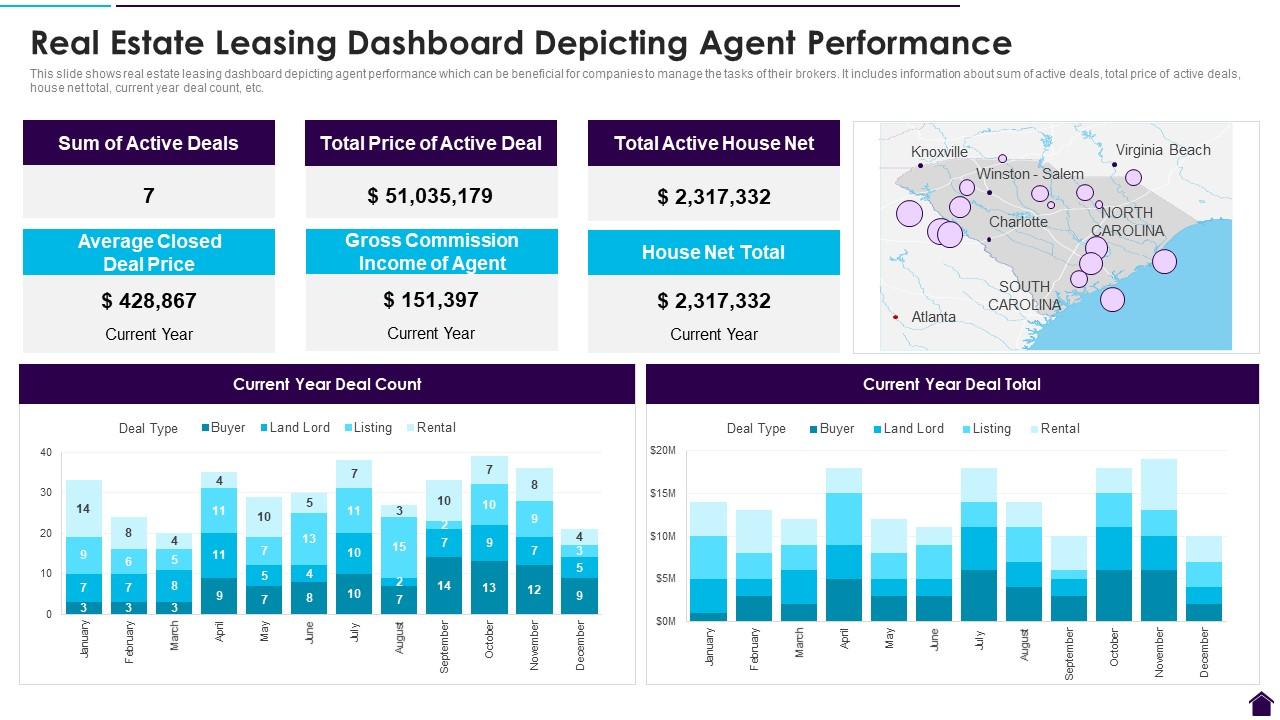
This slide shows real estate leasing dashboard depicting agent performance which can be beneficial for companies to manage the tasks of their brokers. It includes information about sum of active deals, total price of active deals, house net total, current year deal count, etc. Introducing our Real Estate Leasing Dashboard Depicting Agent Performance set of slides. The topics discussed in these slides are Price, Average. This is an immediately available PowerPoint presentation that can be conveniently customized. Download it and convince your audience.

People who downloaded this PowerPoint presentation also viewed the following :

FAQs for Real Estate Leasing Dashboard

Start with occupancy rates and average rent per square foot - those are your bread and butter metrics. Vacancy duration matters big time because empty units kill your cash flow. I'd track lease expiration dates and tenant retention too, plus how long it takes to fill new spots. Operating expense ratios show you the real picture alongside your NOI. Oh, and tenant credit scores if you can swing getting that data - saves headaches down the road. Honestly, rent roll trends are probably more telling than people think. Begin with these basics, then you can get fancy with more metrics later.

Honestly, charts are a game changer for leasing data. Raw spreadsheets are brutal to dig through - who has time for that? Bar charts work great for comparing different properties, and line graphs show trends over time really clearly. Heat maps are perfect for spotting your top performers at a glance. You'll catch patterns and weird outliers way faster than scrolling through endless rows of numbers. Color coding your KPIs helps too. Oh, and those funnel visuals? Super helpful for tracking how prospects move through your pipeline. Makes everything so much easier to understand.

Dude, you NEED real-time data or your dashboard is basically useless. Stale info means you're missing opportunities left and right. We had week-old vacancy data once and it was a disaster - totally embarrassing when clients asked questions. Real-time feeds let you catch trends immediately and actually react to what's happening. Your occupancy rates, lease expirations, pricing changes? All that needs to be current. Set up automated feeds so you're not manually updating everything like some kind of data entry person. Trust me, flying blind with old numbers is way worse than you think.

Oh man, a leasing dashboard is a game changer - no more drowning in spreadsheets when your boss needs answers. You get real-time visibility into everything: lease expirations, payment patterns, which tenants might bail. Way better than being reactive all the time. I'd definitely set up alerts for renewals like 6-9 months early because otherwise you're scrambling last minute (learned that the hard way). You can segment by risk levels and spot rent optimization opportunities too. Track maintenance requests and satisfaction scores - honestly that stuff matters more for retention than people think. Makes the whole tenant portfolio actually manageable.

Honestly, the data mess will drive you crazy - your property system won't sync with your CRM, and there's always random Excel files everywhere. Getting everyone to agree on metrics is brutal too. Like, how do you even measure occupancy? Square footage or unit count? Pick one and stick with it. Real estate's slow-moving so you need dashboards showing both current stuff and long-term trends, but not so much that people's eyes glaze over. My advice? Figure out what data you actually have first, then get people aligned on definitions. Don't build anything until that's sorted - trust me on this one.

Look, adding financial metrics to your leasing dashboard is where things get interesting. Instead of just tracking empty units, you'll have rent roll analysis and revenue forecasting right there. Honestly, once you see occupancy impact on cash flow in real-time, you can't go back to basic tracking. Short sentences work. Your most profitable properties become obvious at a glance. Declining rent per square foot? You'll spot it immediately. The trick is getting your financial data to sync automatically - nobody has time to update spreadsheets manually every month (been there, hate that). It really turns your dashboard into something you actually use for money decisions.

Tableau and Power BI are your best bets for real estate dashboards - both handle occupancy rates and lease data really well. Power BI's probably cheaper if you're already using Microsoft stuff. Actually, I've been surprised by some Google Data Studio dashboards lately, especially when people need something fast and collaborative. The main thing is making sure it connects to whatever property management system you're using without being a nightmare. Oh, and definitely try Power BI's free trial first to see how it plays with your data sources.

Yeah, property type changes everything about dashboard design. Office spaces need square footage, lease terms, tenant mix - the usual suspects. Retail gets wild though - you're tracking foot traffic, sales per square foot, seasonal stuff that can make or break a quarter. Residential's more straightforward with occupancy rates and rent rolls. Industrial properties? That's all about warehouse specs and loading dock access. I'd honestly just ask your property managers what they check first thing in the morning, then build from there. Way easier than guessing.

Start with property type, lease status, and when leases expire - those three will save you tons of time daily. Geographic filters help if you're juggling different markets, and tenant industry is solid for spotting concentration issues. Square footage plus rent per sq ft are must-haves for comps. Oh, and lease type matters way more than people think - gross vs net completely changes your math. I'd probably add custom tags too for stuff like renewal odds or credit ratings. Honestly, just nail these basics first and build from there as you figure out what else you actually need.

Honestly, dig into your leasing data from the past 2-3 years - that's where the good stuff is hiding. Check out average days on market, how rental prices shift, and when tenants usually bail. Month-over-month and year-over-year comparisons will show you the patterns. Look for those seasonal spikes and dips. I'd pull quarterly reports and cross-reference them with local employment stats or new construction happening nearby. Those external factors matter more than people think. Once you map out these cyclical trends, you'll have solid numbers for your budget forecasts instead of just guessing.

Honestly, automate your validation rules first - saves so much time later. Hook your dashboard straight into the property management system instead of doing manual exports. Excel dumps are the worst. Your leasing team needs solid standards too, especially for move-in dates and lease terms since that's where everything gets messy. I'd run weekly reports comparing dashboard numbers against actual signed leases. The trick is building these checks into your regular routine. Otherwise you're just playing defense when people start asking why the numbers don't add up.

So basically a leasing dashboard puts all your lease info in one spot - expiration dates, rent rates, market comps, payment history, the works. Makes it way easier to spot renewals coming up and see how negotiations are going. I always set reminders like 6-12 months out because honestly, time flies when you're managing multiple properties. You can pull reports on lease terms and tenant performance too, which is clutch during negotiations. Oh and the automated alerts are a lifesaver - I used to forget stuff all the time before I started using them. Just saves you from scrambling at the last minute.

Dude, good UI is everything for those leasing dashboards. Property managers are drowning in data and need to spot things fast - vacancy rates, lease renewals, all that stuff. When the interface is a mess, they're just clicking around forever trying to find basic info. I've literally watched people abandon perfectly good analytics tools because they were too painful to navigate. Smart layouts and clean visuals make the difference between catching problems early or missing them entirely. The key stuff needs to jump out immediately, you know?

Oh totally! So property managers need the day-to-day stuff - maintenance requests, lease renewals, occupancy rates for their specific buildings. Investors? They want the money view - ROI, cash flow, how their portfolio's doing against the market. The time frames are different too. Managers check daily or weekly, investors are more quarterly/annual people. Role-based permissions are clutch here - everyone just sees their relevant stuff. I swear these dashboard systems have gotten so much better at this customization thing lately. Way less clunky than they used to be.

Oh dude, get a leasing dashboard ASAP. It'll track all the annoying compliance stuff automatically - rent control limits, security deposit rules, disclosure deadlines. Set up alerts for lease renewals and safety inspections too. Trust me, you don't want to be digging through random paperwork when an auditor shows up. Everything stays in one spot instead of scattered everywhere. Honestly wish I'd done this sooner - could've avoided that stupid fine last year. The automated reminders alone are worth it.

Ratings and Reviews

90% of 100
Review Form
Write a review
Most Relevant Reviews
  1. 80%

    by Dino Grant

    Use of different colors is good. It's simple and attractive.
  2. 100%

    by Davis Mason

    Great product with highly impressive and engaging designs.

2 Item(s)

per page: