


Monthly marketing report complete powerpoint deck with slides
A marketing report PPT slide show having balanced text with innovative original template themes is hard to conceptualize. Bearing this in mind here we have come up with a pre made PPT model for marketing agencies to highlight significant sales activities of last month. Furthermore, our PPT example helps to cast spotlight on the marketing plans for the forthcoming month. Best part is that you can use this PowerPoint show to share business as well as market information with your front managers. In addition, with help of our PPT sample you can give recommendation to your employees for future planning of market strategy. Apart from this, using our marketing report template it is pretty simple to lay emphasis on competitors strategic planning. Finally, to make it easier for you this presentation deck comprises of slide templates like sales performance reporting, key financials, website performance review, product wise performance, monthly pipeline and so on. So get started now by simply downloading our monthly marketing report complete PowerPoint slide deck. Insist on the issue being considered with our Monthly Marketing Report Complete Powerpoint Deck With Slides. Give every element due importance.
A marketing report PPT slide show having balanced text with innovative original template themes is hard to conceptualize. B..


-

- Google Slides is a new FREE Presentation software from Google.
- All our content is 100% compatible with Google Slides.
- Just download our designs, and upload them to Google Slides and they will work automatically.
- Amaze your audience with SlideTeam and Google Slides.
-

Want Changes to This PPT Slide? Check out our Presentation Design Services
-

- WideScreen Aspect ratio is becoming a very popular format. When you download this product, the downloaded ZIP will contain this product in both standard and widescreen format.
-

- Some older products that we have may only be in standard format, but they can easily be converted to widescreen.
- To do this, please open the SlideTeam product in Powerpoint, and go to
- Design ( On the top bar) -> Page Setup -> and select "On-screen Show (16:9)” in the drop down for "Slides Sized for".
- The slide or theme will change to widescreen, and all graphics will adjust automatically. You can similarly convert our content to any other desired screen aspect ratio.
Compatible With Google Slides

Get This In WideScreen
You must be logged in to download this presentation.


Do you want to remove this product from your favourites?
PowerPoint presentation slides
Valuing time completely pre made deck of 66 templates design. Best for sales and marketing business executives. Single click step to insert company name, logo and trademark. Exclusive manually editing option available. Exceptional beginning, thank you and customer testimonial presentation graphics. Temporary watermark gradually disappear with a click. Easy to alter into PDF or JPG formats. Quickly responds to all software’s. Well supports Google slides. The stages in this process are market research, services reports, product performance, sales report, progress report, web analytics.

Content of this Powerpoint Presentation
“Marketing’s job is never done. It’s about perpetual motion. We must continue to innovate every day,” Beth Comstock, former vice-chair of GE.
Marketing can be an expensive affair. But it is an integral part of businesses. Brand recognition, lead generation, and increased sales are some of its benefits.
Setting up a marketing strategy is not a one-time task. As Beth Comstock mentions, it must be measured, evaluated, and adjusted. A monthly marketing report is a tool that can help you do so.
The job of the monthly report is to show how effective your marketing efforts have been. Depending on the results - improvements or losses, you can modify your marketing strategies.
You can use our premade monthly marketing report PPT to present marketing and sales data to all stakeholders. The sample PPT covers broader topics like sales performance, ROI, and roadmap. It also covers granular data, such as product-wise and website performance.
You will come across bar and pie charts, tables, graphs, and sequential flows in the presentation. This is done for easier understanding and comparison.
Are you looking for clients for your web marketing agency? Explore our one-page web marketing proposal template. The design cuts down on the noise and provides potential clients with relevant information for easy decision-making.
Monthly Marketing Report PPT Templates
Our pre-designed monthly report PPT can help you track the effectiveness of marketing strategies. You can conduct a detailed analysis based on sources like websites, SEO, advertising, and social media. The slides are 100% editable and customizable, so you can add/remove content according to your marketing channels.
Do you want to understand how your company is doing with its social media marketing efforts? Here is a social media analytics template that lets you compare multiple platforms' performance based on factors like followers, impressions, and engagement rate.
Let us look at some of the top slides in our monthly marketing report deck.
Template 1 Sales Performance Reporting PPT Template

This slide provides an overview of how the sales team is doing. It touches on topics like sales YTD goals, top-selling products, and top performers. The ‘Sales Performance Reporting’ slide is like a preview of what is to come in the marketing deck. The slide is divided into six sections. Each section includes a graphical representation of a metric. For example, top-selling plans are shown with a donut chart. Top sales reps and opportunities are shown using bar charts. The power of using these graphics is that you can provide high-level information on all critical sales goals in a simplistic manner.
Template 2 Key Deliverables and Timeline Presentation Template
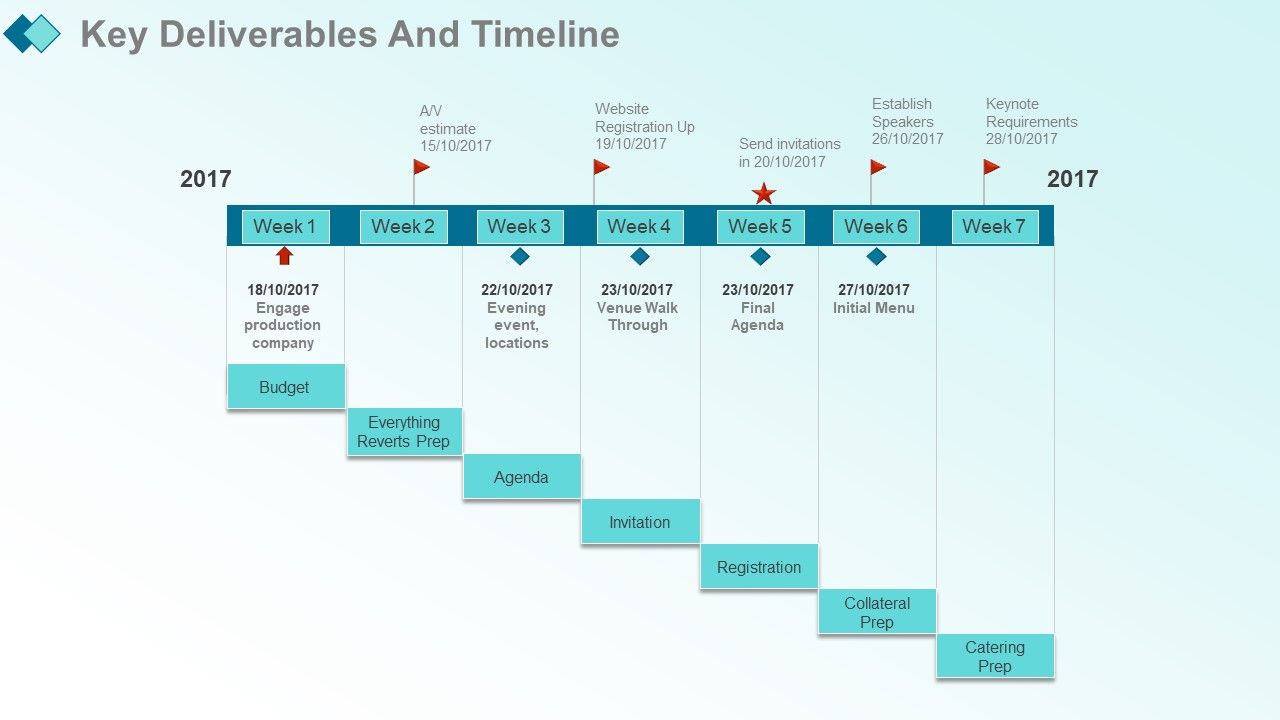
The slide uses a timeline flowchart to represent what needs to be done over a period of time. For example, you can divide the month into weeks and list the steps to be completed on a particular day. Our timeline flow is divided into seven weeks. A text box is available under the week sections wherein you can mention goals. There is space allotted for notes and steps. Important information can be highlighted with star, flag, and diamond icons. The slide can provide insights into how well you were able to stick to the marketing plan.
Template 3 Return on Investment
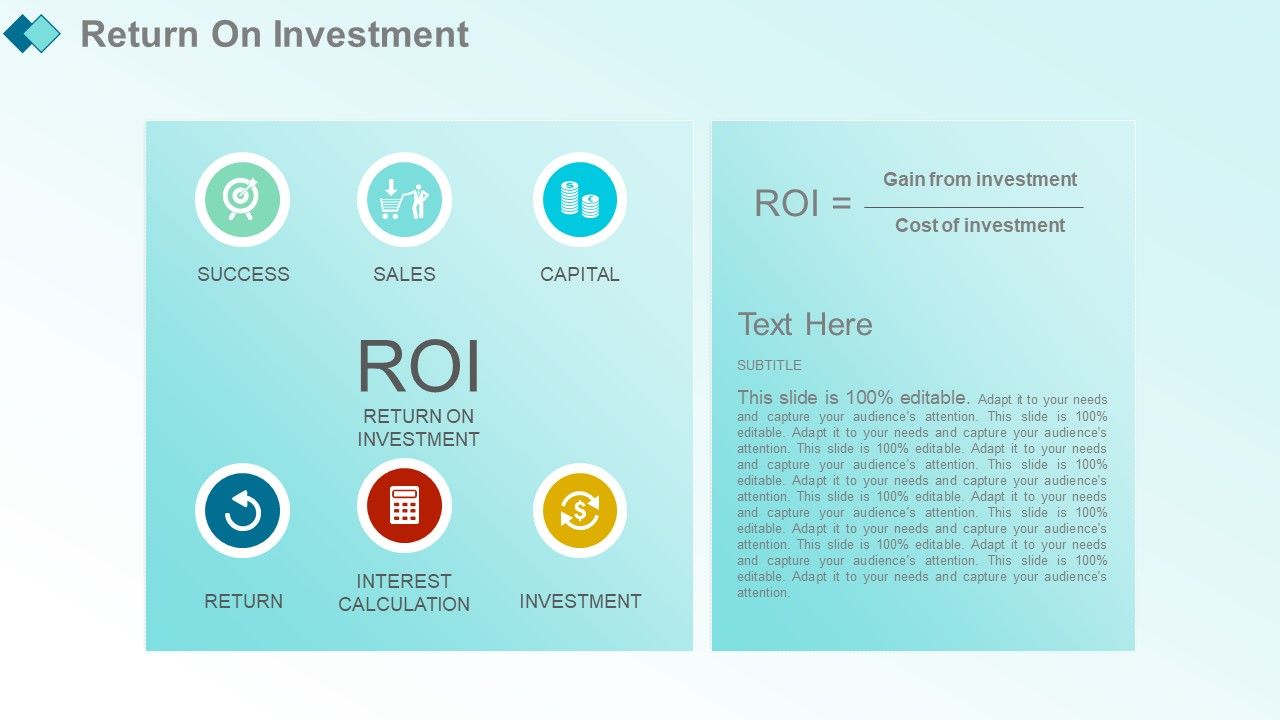
ROI is an important metric that investors are curious about. Was our investment profitable? If not, what can we do better? The ROI template is divided into two sections - text and graphics. In the text section, you can mention the formula used to calculate ROI. You can elaborate on the result and make suggestions on resource allocation. In the graphics section, colorful icons are available for sales, capital, return, and investment. You can input high-level numbers under these icons to show their impact on ROI.
Template 4 Product-wise performance
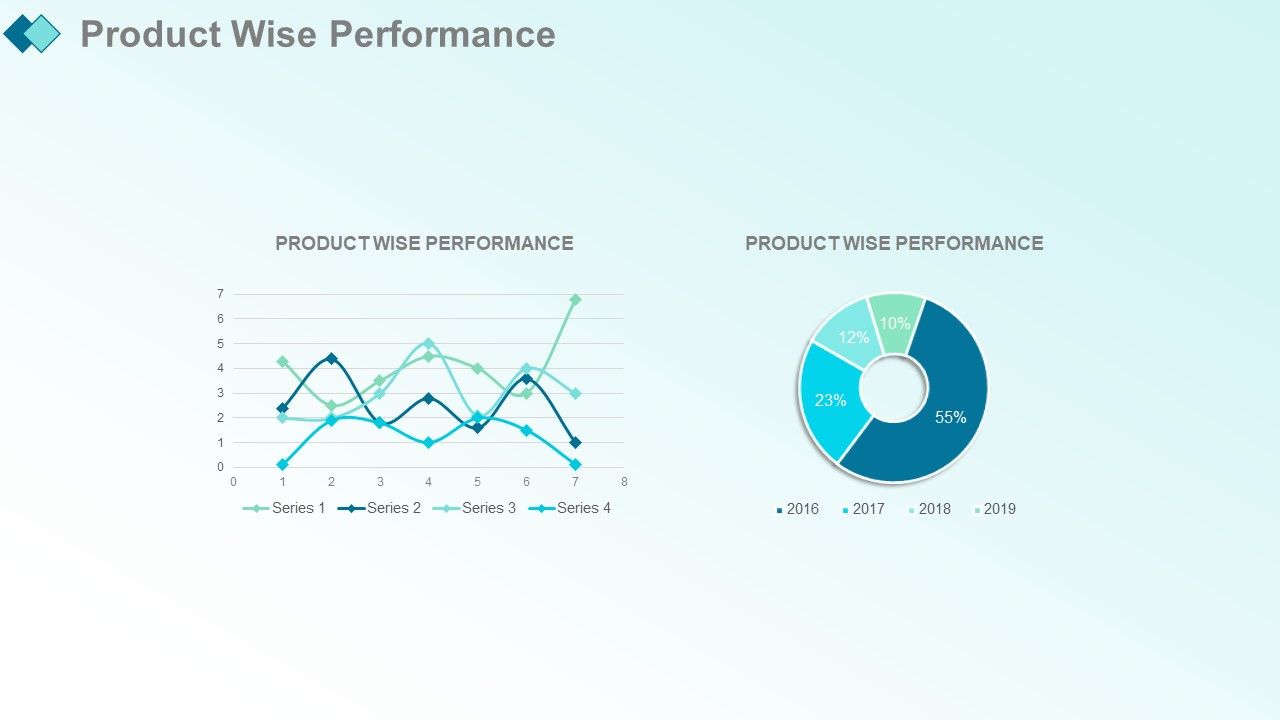
The ‘Product Wise Performance’ slide is where you start getting into detailed information. We have used a line and donut chart to show how products have performed over the tracked period of time. Again, we have only used charts for easy understanding. For example, with a line chart, product comparison becomes easier. At a glance, you can tell what product is a bestseller and what product needs looking into. You can adjust the charts depending on your product range and the metrics you want to focus on.
Template 5 Marketing Roadmap PPT Template
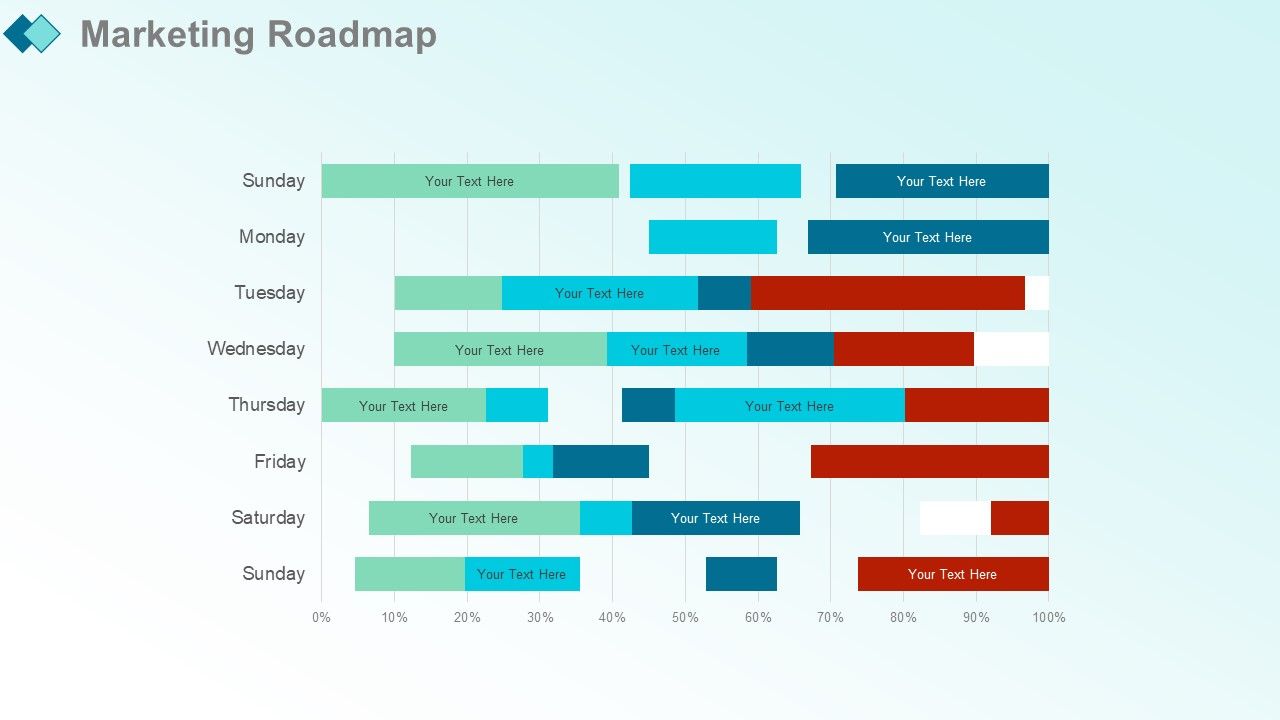
Each department will have specific tasks to aid marketing goals. The roadmap slide provides a unified view of these tasks. The graphic tells viewers marketing initiatives underway and the accountable teams. We have used a bar chart to represent the task timelines. You can color-code the horizontal columns depending on the tasks. Additionally, you can add text to elaborate on the tasks or teams. Our marketing roadmap is designed for a weekly overview. But you can change the axis from days to, for example, weeks according to your requirements.
Template 6 Website Performance Review PPT Slide
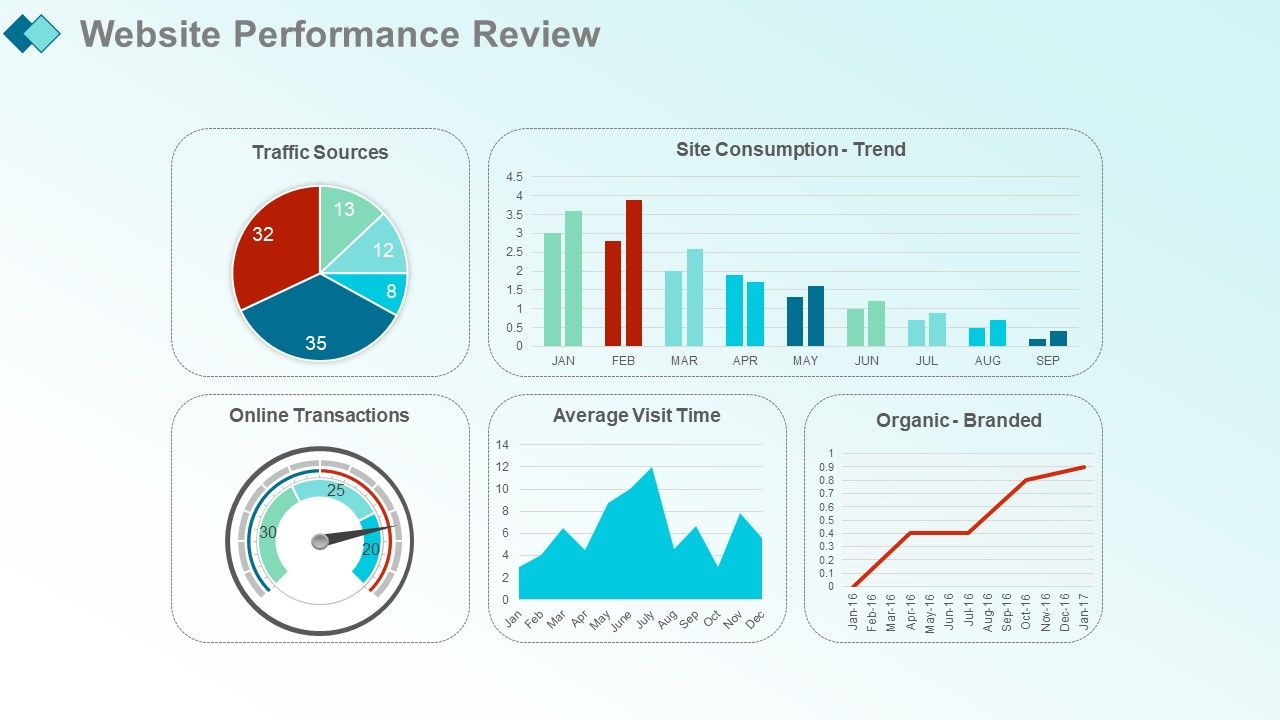
A website provides your company credibility. It helps reach customers beyond borders. Monitoring website performance is essential as it can directly impact brand reputation and sales. The ‘Website Performance Review’ slide includes metrics like traffic sources, online transactions, and site consumption trends. Chart types, such as pie, area, bar, and line represent each metric. Some of these charts record data over a longer period, for example, a year. This makes it easier to compare if your new design or marketing strategies have worked.
Template 7 Website Performance Review
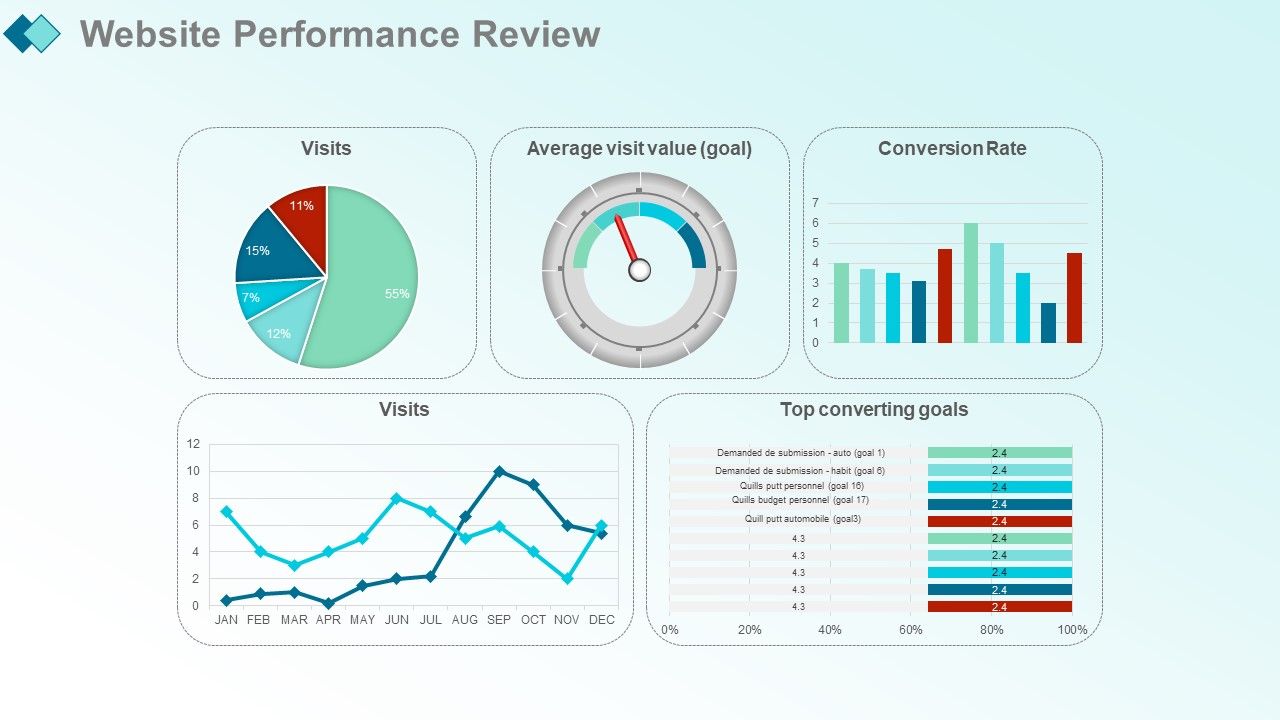
This is an extension of the website performance slide, focusing on the visits metric. Here, you can present the number of visits, average visit value, and top converting goals. The insights can be used to improve the website design and engagement. For example, you could design better landing pages or use pop-ups to encourage sales. The slide follows the deck's theme and uses charts for data presentation. The chart types in the slide are pie, gauge, bar, and line.
Template 8 Search Engine Rankings
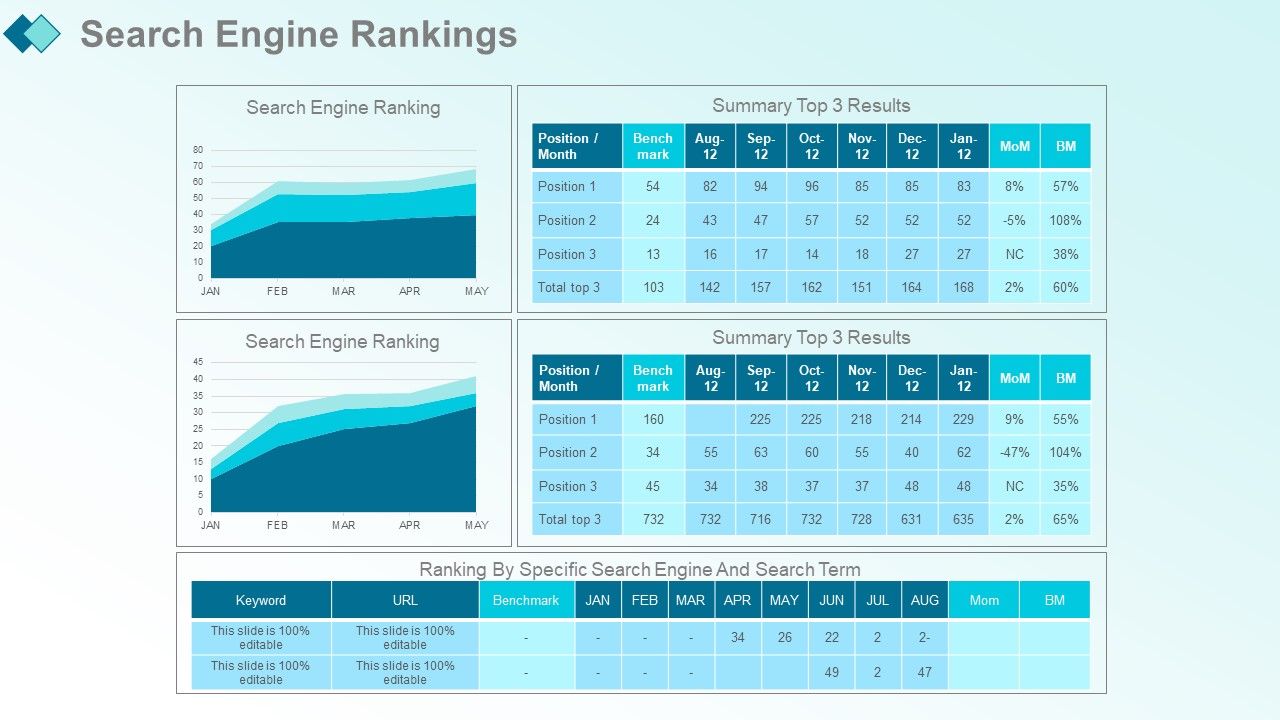
Tracking SEO rankings is essential for businesses. For example, Google may make algorithm changes, or other businesses could improve their content strategy. Without SEO ranking monitoring, your website could end up on a search engine’s dreaded second-page results. Our ‘Search Engine Rankings’ template uses area charts and tables to monitor rankings. The data is plotted for months to allow you to compare if changes have been effective. The template is customizable, so you can add any metrics or keywords you want to highlight.
Template 9 Monthly Traffic Source Overview PPT
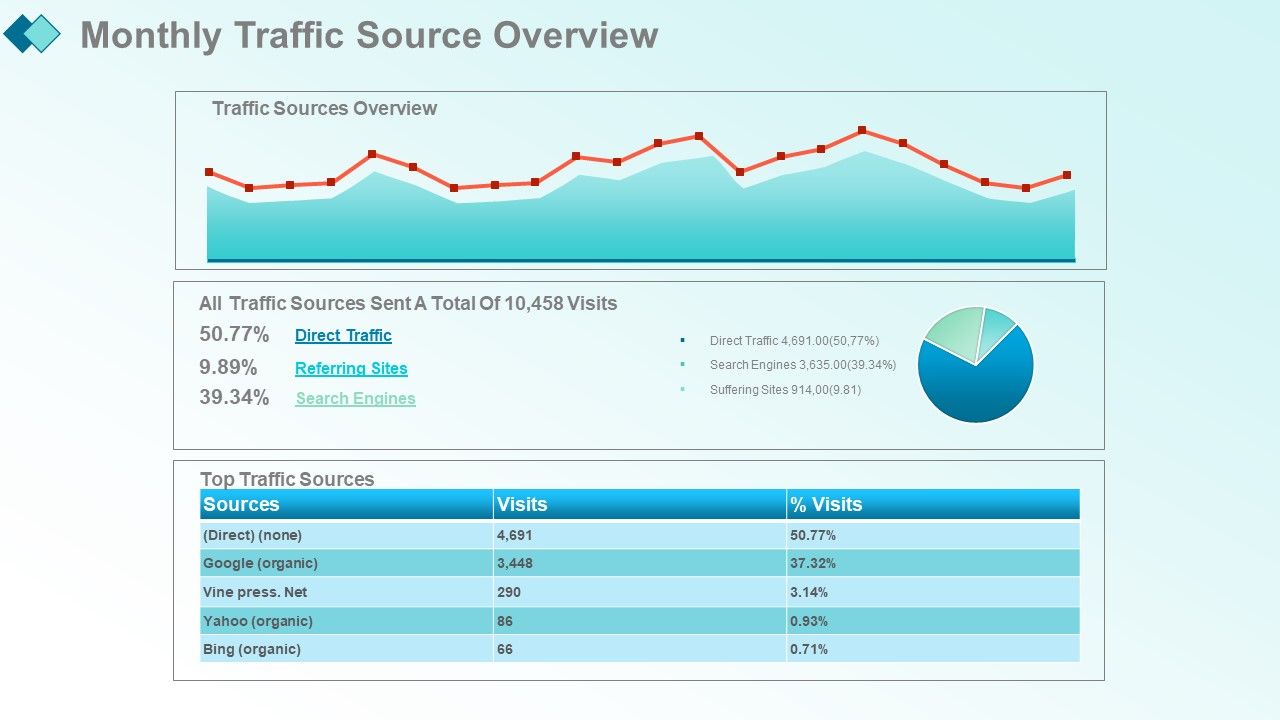
This slide focuses on the top traffic sources for your website. Are your users finding you through a search engine, social media, or email marketing? Knowing about traffic sources can help you allocate your resources better. For example, if email marketing is not working for the website, you can redirect some of the budget to boost social media. We have used area, line, pie charts, and tables to present data. The slide uses a blue color palette with complementary colors for top traffic sources.
Template 10 Organic Visits and Backlinks Slide

Organic visits represent users who visit your website from unpaid sources. Organic backlinks are links that real people place on their websites because they think the content is useful. These sources can help drive traffic to your business website, improve credibility, and reach a larger audience. We have used a combination of column, line, and pie charts to show the source performance. Text boxes are available at the bottom, where you highlight data like rank and domain authority.
*****
Marketing Reports for Business Growth
Our monthly marketing report template is designed to help cut down on the preparation time. The deck covers overview and topics, such as marketing roadmaps, search engine rankings, and organic links. The presentation dominantly follows a blue color palette with splashes of red and yellow for critical information. The graphical presentation takes center stage in this deck. We have used charts, tables, and timeline flows to enhance understanding. The PPT is editable, so you can always make changes or add/remove metrics according to your marketing efforts.
Are you looking to leverage technology for your marketing campaign? Use our marketing intelligence report PPT to present stakeholders with data about industry trends, technology offerings, and customer insights.
Monthly marketing report complete powerpoint deck with slides with all 66 slides:
Forge an excellent future with our Monthly Marketing Report Complete Powerpoint Deck With Slides. Build that fortune you dream about.
-
Informative design.
-
Graphics are very appealing to eyes.
