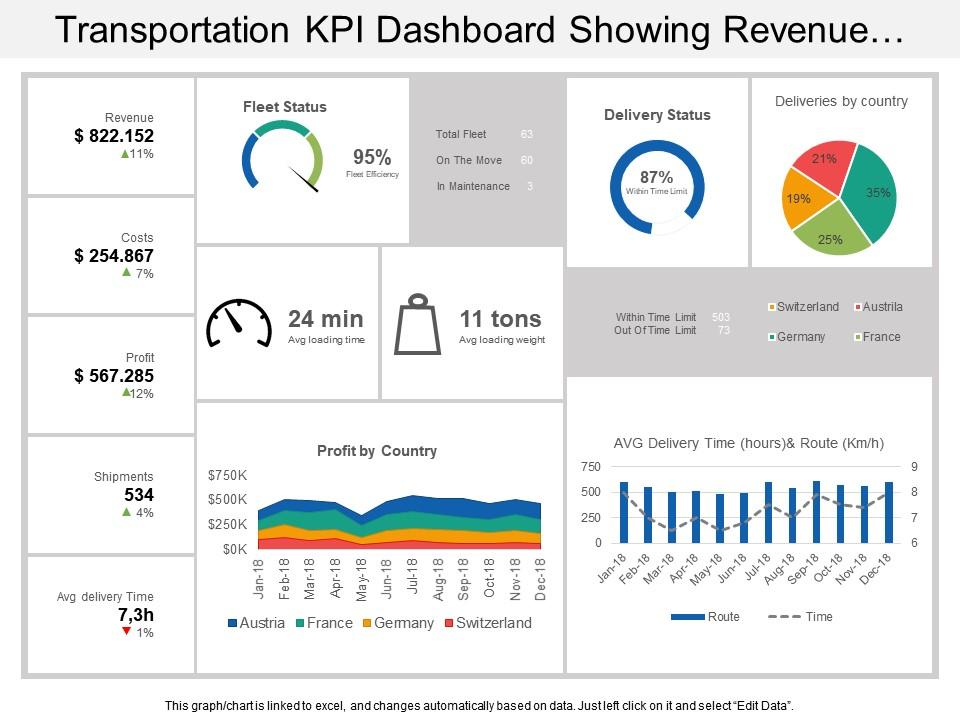
Transportation kpi dashboard snapshot showing revenue costs profit fleet status
Present transportation economics to your business stakeholders with our transportation KPI dashboard showing revenue costs profit fleet status slideshow. This PPT presentation slide of fleet status report for transportation has been designed by our professional team which is helpful you to staying in touch with the customer while keeps them in the loop. Our key performance indicators for transportation industry showing fleet status can be useful for fleet monitoring systems as there is digital transformation in the industry to monitor fleets, equipment, miscellaneous assets and drivers. With the help of this cost structures of various modes of transportation PPT layout you can review cost allocation study to create rough estimates of the external costs of travel for different classes of vehicles on urban and rural regions. There are many components which can be linked to external factors cost such as, pavement damage, congestion, crashes, air pollution or noise. Download this slide and for more visit our website. Our Transportation Kpi Dashboard Showing Revenue Costs Profit Fleet Status provide the DNA of success. They have the right substance thatyou need.
- Google Slides is a new FREE Presentation software from Google.
- All our content is 100% compatible with Google Slides.
- Just download our designs, and upload them to Google Slides and they will work automatically.
- Amaze your audience with SlideTeam and Google Slides.
-
Want Changes to This PPT Slide? Check out our Presentation Design Services
- WideScreen Aspect ratio is becoming a very popular format. When you download this product, the downloaded ZIP will contain this product in both standard and widescreen format.
-

- Some older products that we have may only be in standard format, but they can easily be converted to widescreen.
- To do this, please open the SlideTeam product in Powerpoint, and go to
- Design ( On the top bar) -> Page Setup -> and select "On-screen Show (16:9)” in the drop down for "Slides Sized for".
- The slide or theme will change to widescreen, and all graphics will adjust automatically. You can similarly convert our content to any other desired screen aspect ratio.
Compatible With Google Slides

Get This In WideScreen
You must be logged in to download this presentation.
PowerPoint presentation slides
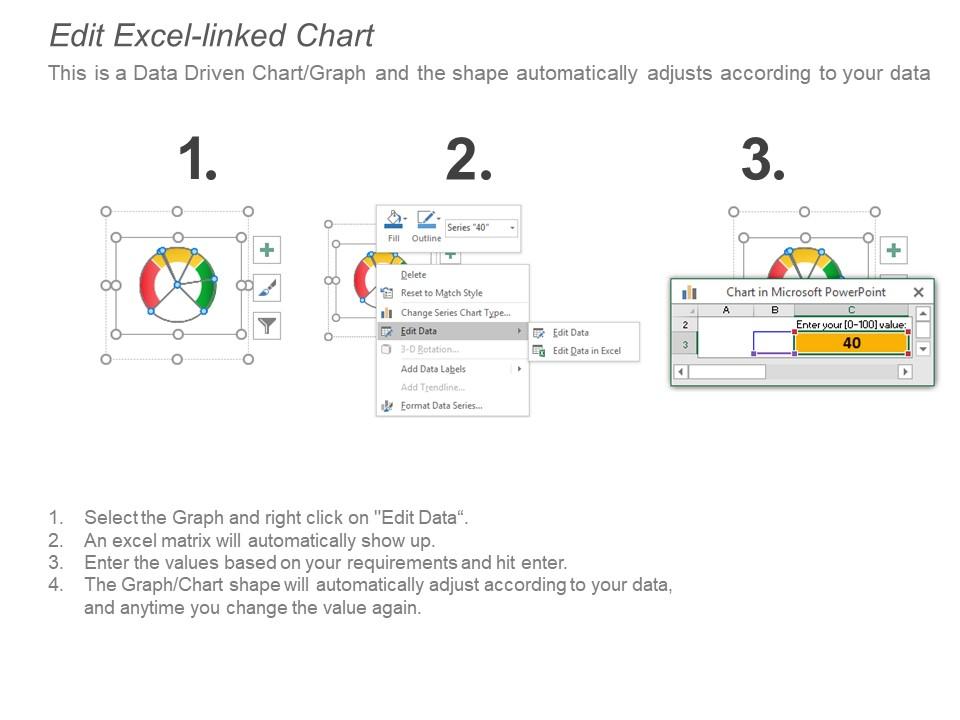
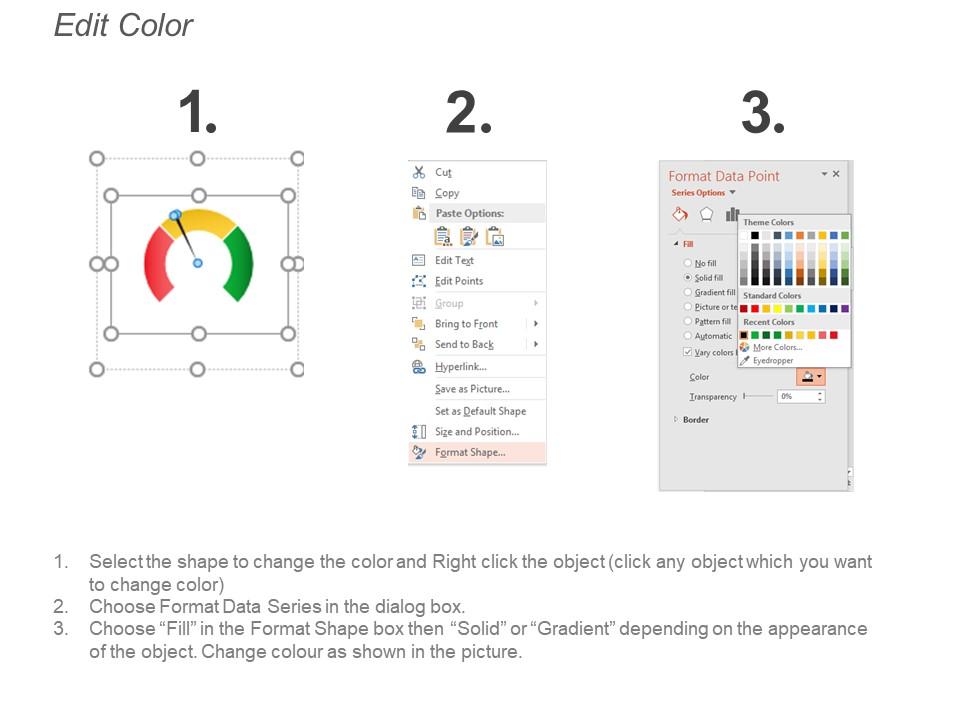
Presenting KPI dashboard snapshot showing revenue costs profit fleet status slideshow. Change PowerPoint structure, font, text, color and design as per your requirements. Easy to input data with excel linked charts, just right to click to input data. This presentation theme is totally attuned with Google slides. Easy conversion to other software’s like JPG and PDF formats. Image quality of these PPT diagram remains the unchanged even when you resize the image or portray on large screens.
People who downloaded this PowerPoint presentation also viewed the following :
Transportation kpi dashboard snapshot showing revenue costs profit fleet status with all 6 slides:
Be the guru with our Transportation Kpi Dashboard Snapshot Showing Revenue Costs Profit Fleet Status. Bless them with your enlightening thoughts.
No Reviews


