Imagine you're having a family dinner, when your wise granny pulls out the family tree. She opens a wrinkled sheet of paper, before proudly pointing out that you are related to a well-known poet. These two sentences enscapsulate the purpose of an organizational chart as well: To represent order, growth and who did what under whom.
In businesses, this kind of an organizational flow chart is indispensable. These organizational flow charts represent the position of you and your team within the larger organizational structure. An organizational chart (or organogram) shows how teams are structured and who reports to whom. These are not simply pretty pictures, but represent the structure of your organization, project, or department.
An understanding of how your business functions can be gleaned from an organizational structure that details reporting relationships, job functions, and the flow of information. These charts are structured like trees, with branches representing many responsibilities of each employee.
What makes these organizational flow charts so vital?
Organizational flow charts set the tone for the business and identify the lines of communication so that employees know their place and can avoid confusion. These diagrams have uses, such as personal organizers, management tools, and can function as strategic planners.
However, before diving headfirst into enlightening samples and real-world examples, let's explore the fascinating realm of data flowcharts..
Are You Prepared for a Transformative Journey to Reshape Your Organisational Management Perspective?
If your answer is YES, then SlideTeam Templates are the best answer. These creations act as beacons that bring businesses to improved workflows, more precise lines of communication, and unprecedented productivity.
Each of the presentation templates is 100% editable and customizable. The content-ready nature provides you a starting point and the structure you were looking for; the editability feature ensures you can tailor the presentation to audience profile.
Let's explore these templates.
Template 1 Organizational Data Cleansing Process Flow Chart
This PPT Template helps business operations with its focus on providing a standardized and systematic method for cleaning data. Use this presentation template to ensure that data you use is consistent with organizational norms and complies with external regulations as well. This comprehensive slide covers data cleansing prospect identification, lead creation channels, and efficient lead management. It represents the complete lead management procedure from initial contact to data entry and lead assignment. Its adaptability to specific requirements of every given enterprise is one its remarkable quality. It’s an excellent resource for businesses that want to boost productivity and adopt best management practices.
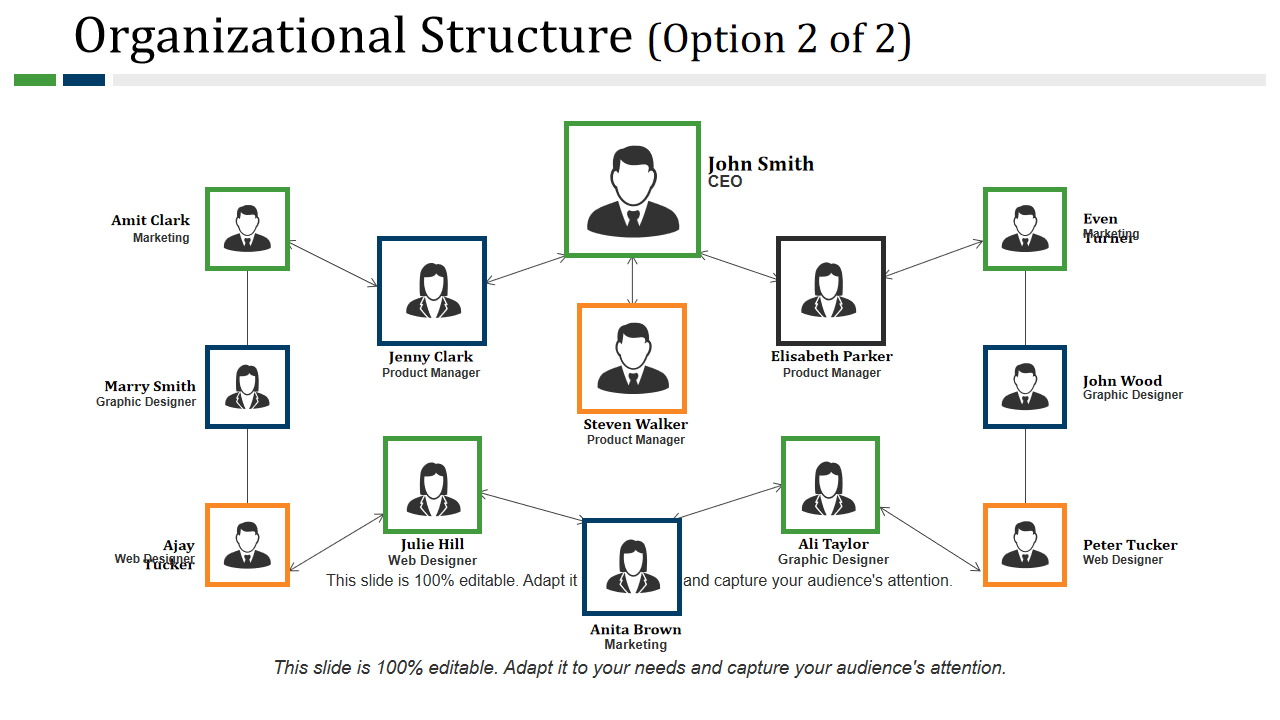
Template 2 Organizational Structure PowerPoint Slide Designs
This PPT Slide includes graphical shapes to indicate departments or functions, lines that depict paths of authority, and spaces to provide explanatory text. Moreover, an organization's intricate web of roles, responsibilities, and interconnected relationships constitutes its structure. This slide streamlines processes, while also conveying the organizational structure and hierarchial relationships in your business to the audience. The design elements adds an aesthetic touch, while ensuring that the presentation remains clutter-free.
Template 3 Organizational Chief Controlling Division Process
This PowerPoint Template is a crucial resource for any manager, who is tasked with the control function. The presentation is designed to depict how the main tasks of the control division can be made to adhere to a standardized, pre-approved procedure. Use this template to enhance the efficiency of processes in your division with the reduction of waste. The chief control division will find the framework that this template provides to be a blessing. Be it finance, R&D, manufacturing, marketing, or a single product line, this template has you covered. This PPT is also crucial to the success of the firm as it fosters accuracy, uniformity, and compliance in this crucial department.
Template 4 HR Consultancy Process Flow for Organizational Recruitment
This PowerPoint Template is a guide for HR professionals and businesses, as they navigate the minefield that is the organizational recruitment process. The presentation gives a flow chart to assess the client's specific recruitment needs, such as job responsibilities, credentials, and expectations. In addition, it expedites group efforts toward developing detailed job analyses and descriptions, which clarify roles and requirements. The template's scope allows for creating a unique sourcing strategy. It supports candidate selection based on qualification and cultural alignment and aids in methodical candidate screening, using interviews and skill assessments. With the help of this powerful resource, HR consultants can save time and better meet their client's needs during the recruitment process.
Template 5 Management organizational chart PowerPoint slide backgrounds
This PowerPoint Presentation depicts organizational charts and reporting structures with names, titles, and positions inserted into given boxes. This boxes can be arranged in many organizational chart graphic formats. The processes represented are business, flow process, management, strategy, and analysis. Backgrounds can be designed using features like colors, fonts, and logos to improve aesthetics and reinforce company identification. This template provides a visual tool that may be altered to make slides for presentations that show the organizational structure.
USE ORGANIZATIONAL FLOWCHARTS TO GREAT EFFECT
SlideTeam has showcased the secrets to success in the modern company landscape with this goldmine of organizational flow chart templates and examples. These samples are more than just a pretty face; these are maps that helps companies find the sweet spot between productivity, collaboration, and effectiveness. Think of the impact of a Process Flow Chart, one as thorough and accurate as the manual for a well-known manufacturer. It’s proof that careful thought leads to successful execution before you go on your life-altering trip into organizational flowchart templates.
Moreover, let's explore Data Flow Diagrams (DFD) businesses use to illustrate how information moves through an operation.
Keeping an overarching view of a project's or a company idea's many moving parts is crucial. However, these samples become potent tools when you have SlideTeam. They provide light on enhancing processes, more transparent communication, and record-breaking output. Plunge in and see how crystal-clear visualization's transformative force can reshape how you run your organization.
PS Unlock the power of social media data visualization with our top-notch chart templates.
FAQs on Organizational flowchart
What is an Organizational flowchart?
A company’s organizational flowchart is a diagram that shows the company's chain of command. Lines, shapes, and symbols are used to represent an organization’s departments, teams, and individuals. It demonstrates the organizational structure, including the chain of command, reporting links, and the distribution of information and authority. Employees can use this visual aid to comprehend jobs better, managers can simplify operations, and outsiders can comprehend the company’s framework.
What are the four types of organizational structures?
Organizational structures are the backbone of any successful business. The four most frequently deployed are:
- Functional Structure: Separated by departments such as "marketing" and "finance."
- Divisional structure: clusters resources according to items, regions, or customers.
- Matrix Structure: Uses functional and divisional organizational features, leading to the frequent occurrence of dual reporting.
- Flat Structure: The least bureaucratic structure that facilitates teamwork and prompt decision-making.
Organizational structures can positively or negatively impact a business's effectiveness, openness, and adaptability. The best-fit for a given business will vary based on size, objectives, and field.
What is organizational structure and chart?
The term ‘organizational structure’ describes the blueprint of an organization's management and staffing structures. It specifies who is responsible for what, who answers to whom, and how decisions are made. On the other hand, an organizational chart represents this structure visually. It uses shapes and lines to depict positions, departments, and their connections. Both are essential for ensuring everyone in an organization knows their place and how they may best contribute to reaching the company's objectives.


 Customer Reviews


