A project management chart is a graphical representation of relevant data. These diagrams are essential for streamlining project processes, removing bottlenecks, managing resources effectively and making better decisions.
A project management chart’s most remarkable feature lies in how it makes complex project data easier to understand. The following is a list of some of the benefits and significance of using graphs to represent and evaluate data:
- A graph is the easiest tool to interpret figures
- Any information presented as comparison captures our attention.
- We can relate to and contrast data across time periods
- To find the mean, mode, and median of data to extract meaningful and groundbreaking information.
Project managers use charts to examine and track aspects of their projects. A project management chart needs is created after the following processes are followed to a T. These are:
- Project start-up: At this stage, you create a business case and provide a broad meaning to the project. Ascertain the project’s need and establish a project charter. The milestone chart is a crucial document that includes information on the project's limitations, objectives, budget, anticipated timeline, etc.
- Project management: Complete diligence is needed throughout the project planning stage, establishing the project's road map. Kanban board is the project management tool that can help in increasing efficiency.
- Project completion: During this stage, the project manager must strive for productivity from all stakeholders.
- Project oversight and management: The third and fourth phases of the IT project management process are not always sequential. By developing a critical path design and Key Performance Indicators (KPIs), you may ensure that no one detracts from the initial plan as a project manager (KPI) itself.
- Project completion: The project management process ends at this stage. The process can also be outsourced in some cases, and after it ends, teams hold a reflection meeting to discuss its successes and problems. We have the ideal solution if you've ever had trouble mapping project activities or keeping track of dependencies.
A Project Evaluation Review Technique (PERT) chart/diagram is a robust tool for planning and scheduling work for it; the Pareto chart is another such tool.
Apart from this, a chart known as the project management Gantt chart is also helpful. Gantt charts are the most common project management techniques that modern firms and managers use to oversee their projects.
Template 1: Project Schedule Gantt Chart Completed Project Management Professional Toolkit PPT Diagrams
It is a premium template for a comprehensive Gantt Chart to coordinate and manage your complicated tasks in tandem. Keep track of your project’s milestones, tasks, phases, activities, subtasks, etc. with this PPT Layout. It empowers you to dive into the planning horizon and summarize project scheduling and release strategy from a single perspective. You can plot dependencies to see how delay in some tasks affect the project's timelines and deadlines.
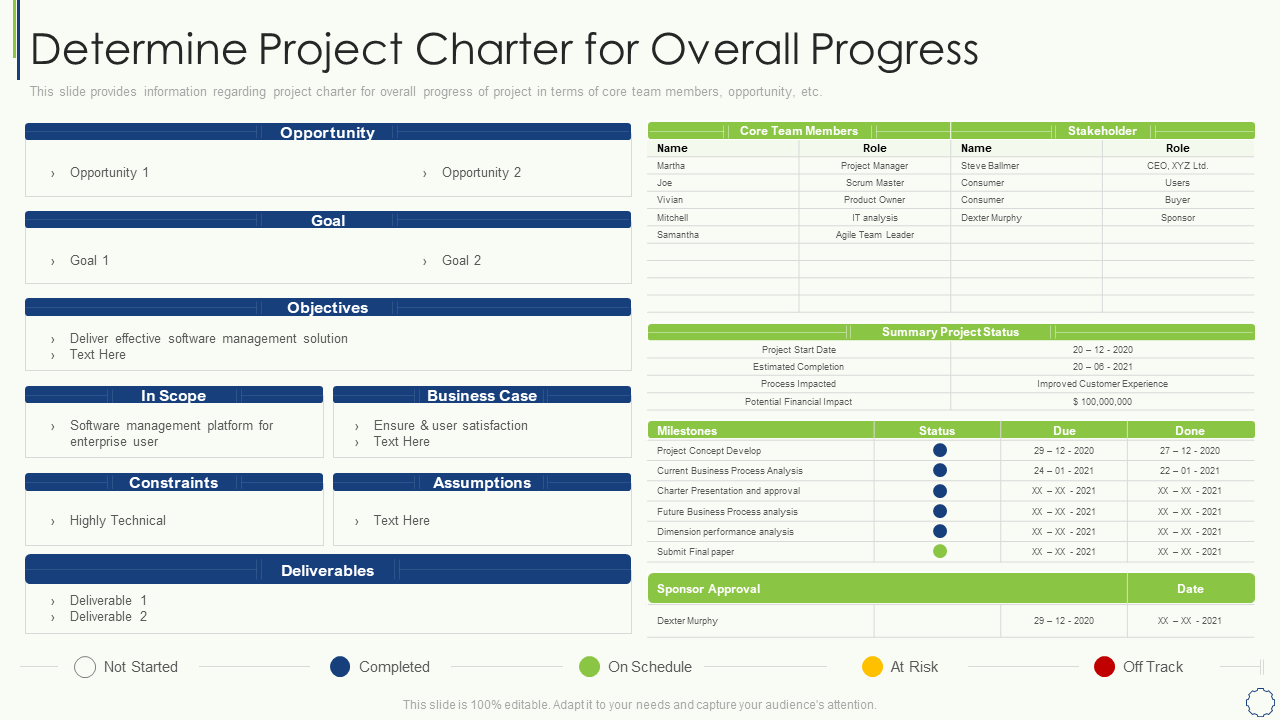
Template 2: Determine Project Charter For Overall Progress Key Elements of Project Management
Introducing an effective template showcasing details about the project charter for project success, including opportunity, core team members, etc. Use it as a conversation and navigational tool for highlighting business goals, objectives, assumptions, scope, constraints, opportunities, summary, and project status.
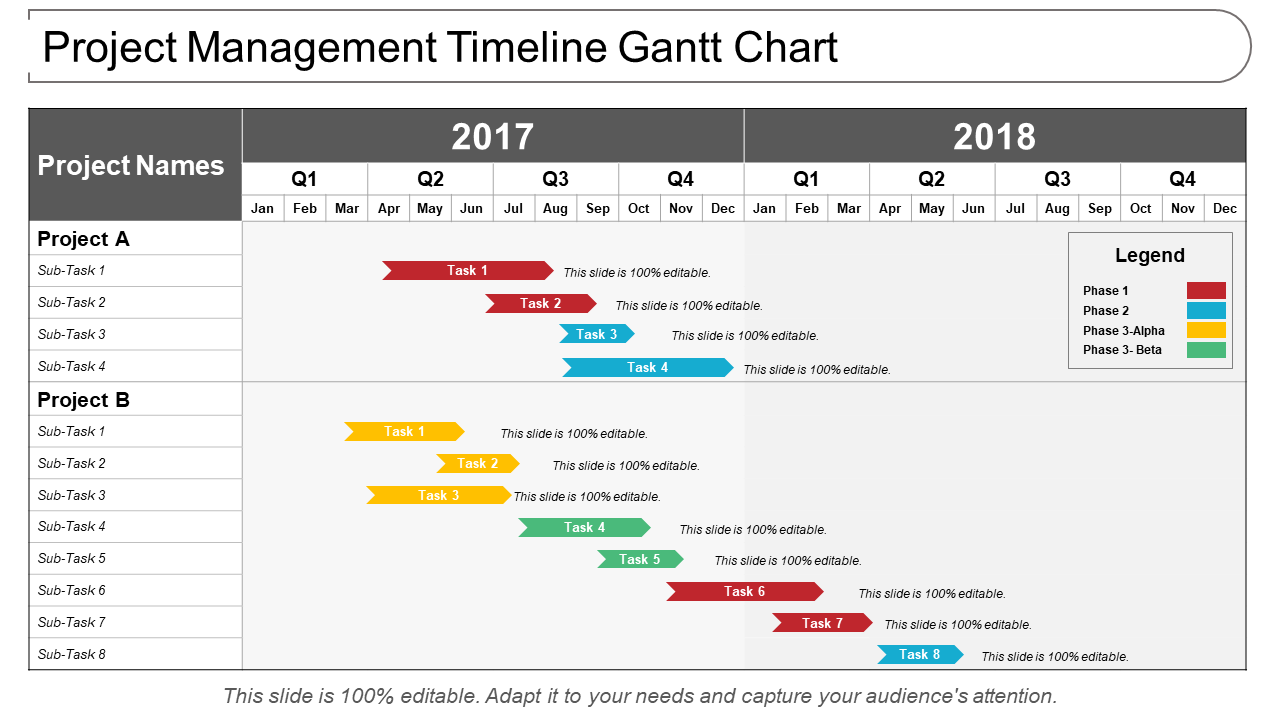
Template 3: Project Management Timeline Gantt Chart
This PPT template is a powerful tool that gives a clear picture of past projects. The diagram covers the timeline, roadmap, and linear process for subsequent years. Download this informative template to educate and entice your audience, emphasizing details of projects.
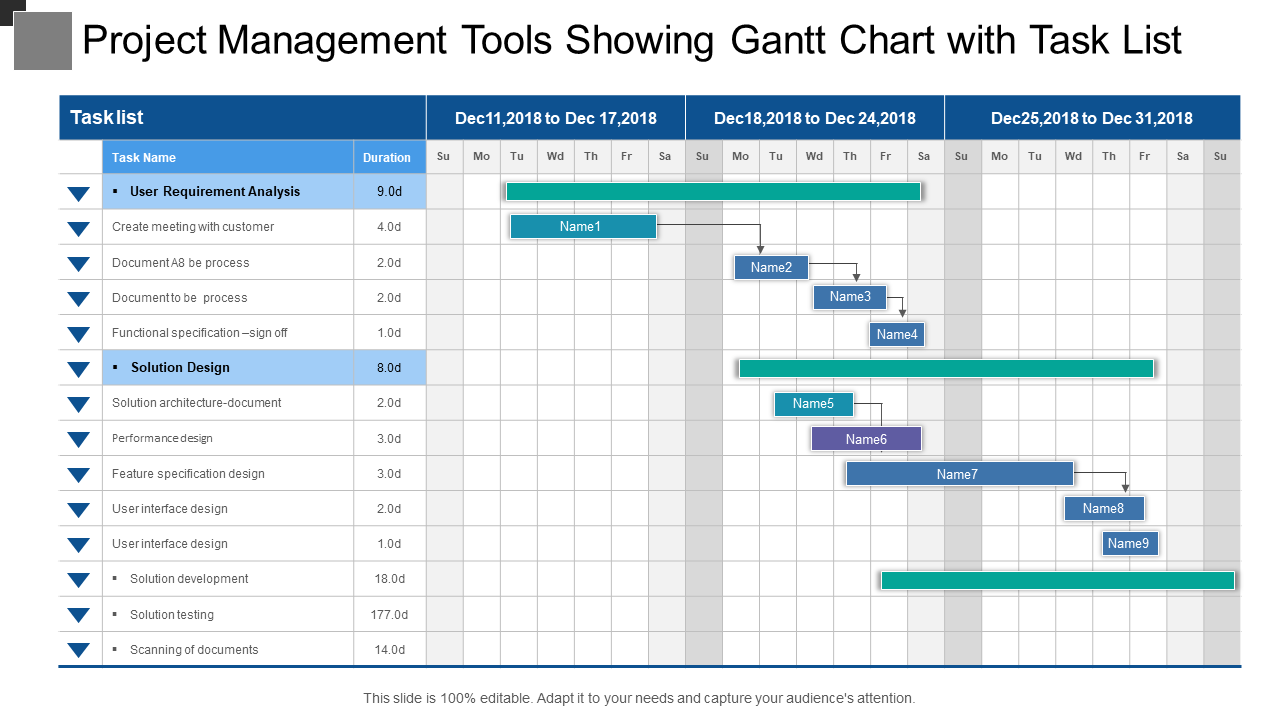
Template 4: Project Management Tools Showing Gantt Chart with Task List
The unique presentation template can highlight weekly task analysis of user requirements and solution design and helps in reflecting on:
- Project management techniques,
- Project management software, and
- Project management tools
Just download and map it for your business requirement right away.
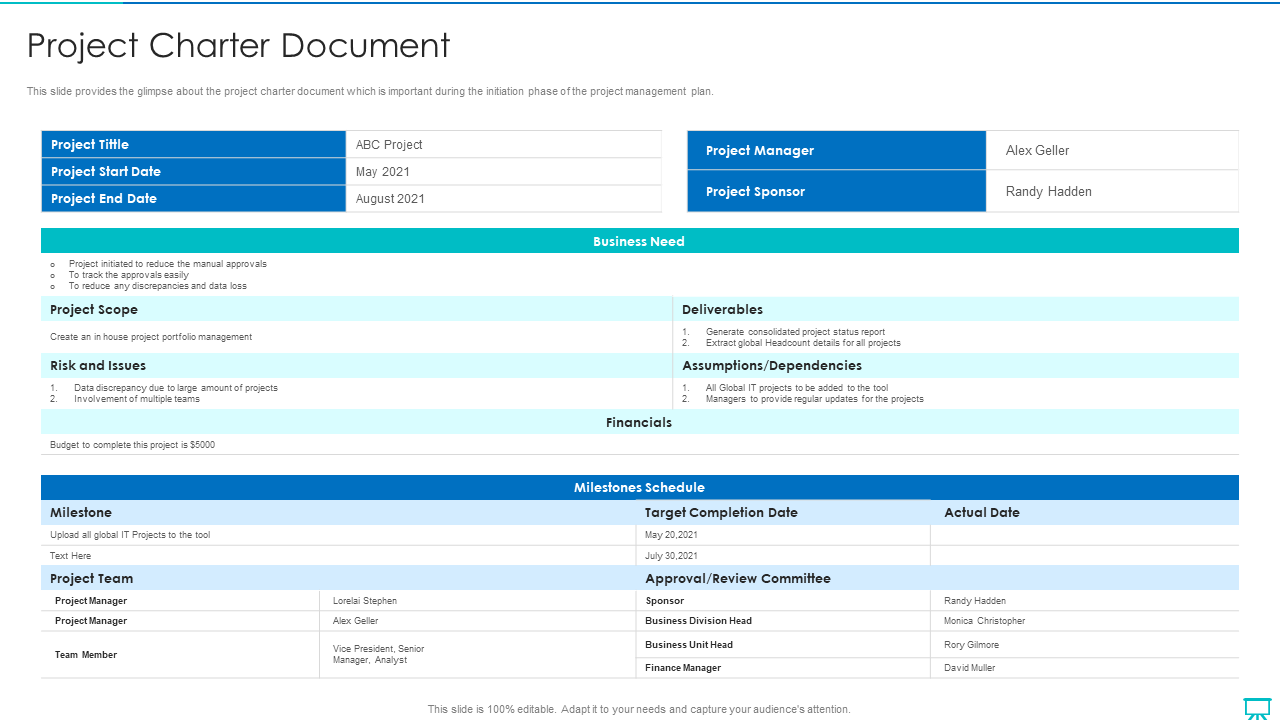
Template 5: Project Charter Document Project Management Professionals Required Documents
This potent and creative PowerPoint Template overviews the project charter document. It encapsulates the project's title, tenure, goal, scope, risks, milestones, project team, budget, deliverables, assumptions/dependencies, etc. Download now for an effective multi-media presentation.
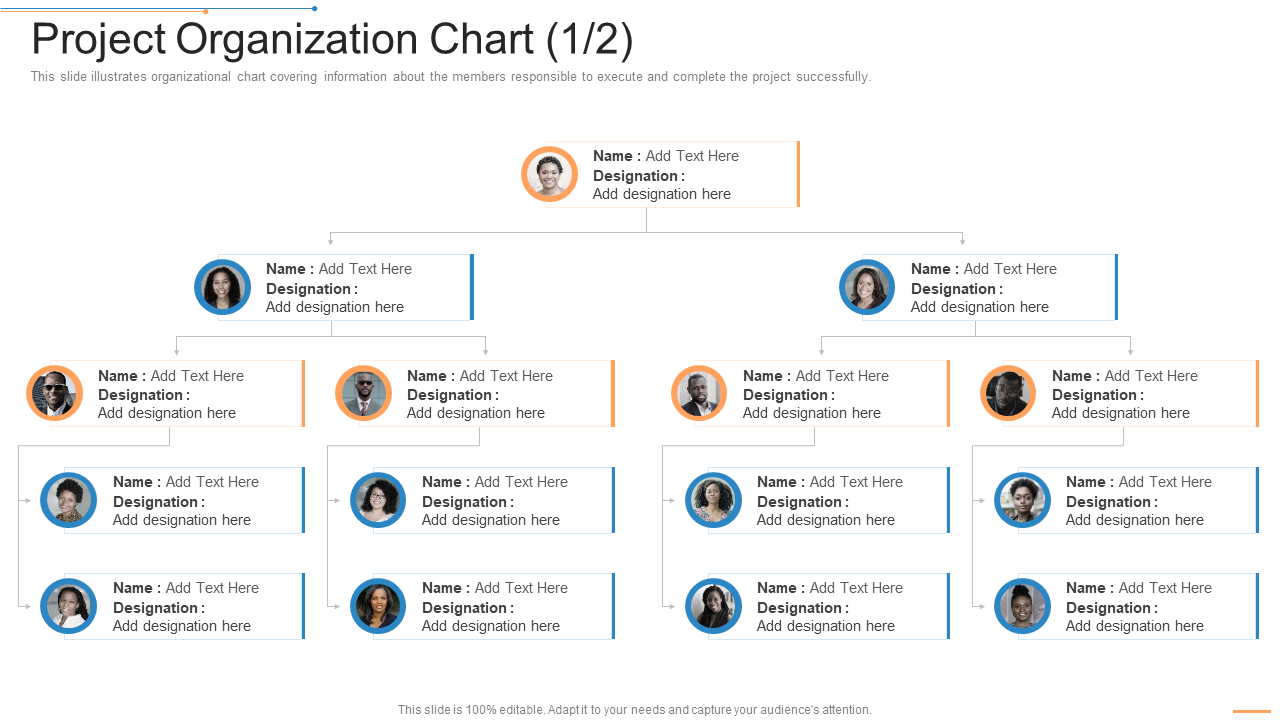
Template 6: Project Organization Chart Project Management Professional Toolkit PPT Themes
This slideshow presents an organizational chart with information about team members in-charge of carrying out and completing the project. The template design is the perfect choice for instructing and captivating your audience. Using this template, spread the word about the team and the hierarchy. To fully gain from it, download it right away.
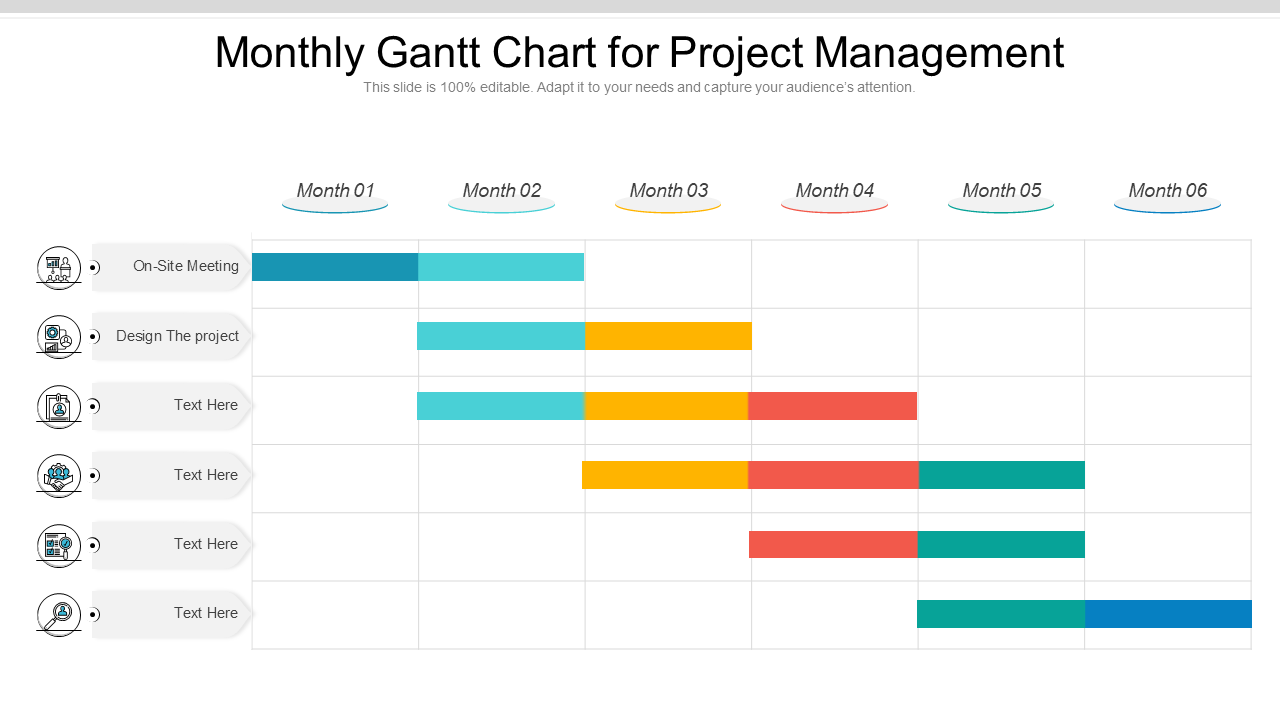
Template 7: Monthly Gantt Chart for Project Management
This collection of PPT Slides elaborates on details of on-site meetings, designing projects etc. Download it now to impress your audience with the least effort, and enjoy the benefits.
Template 8: Project Management Professional Toolkit PPT Introduction for Charter Managers
The project name, problem statement, objective statement, tenure, business benefits, role, in-scope, out-of-scope, customer benefits, etc., are displayed in the project charter. Create an acceptable, workable, and efficient project management strategy with its download.
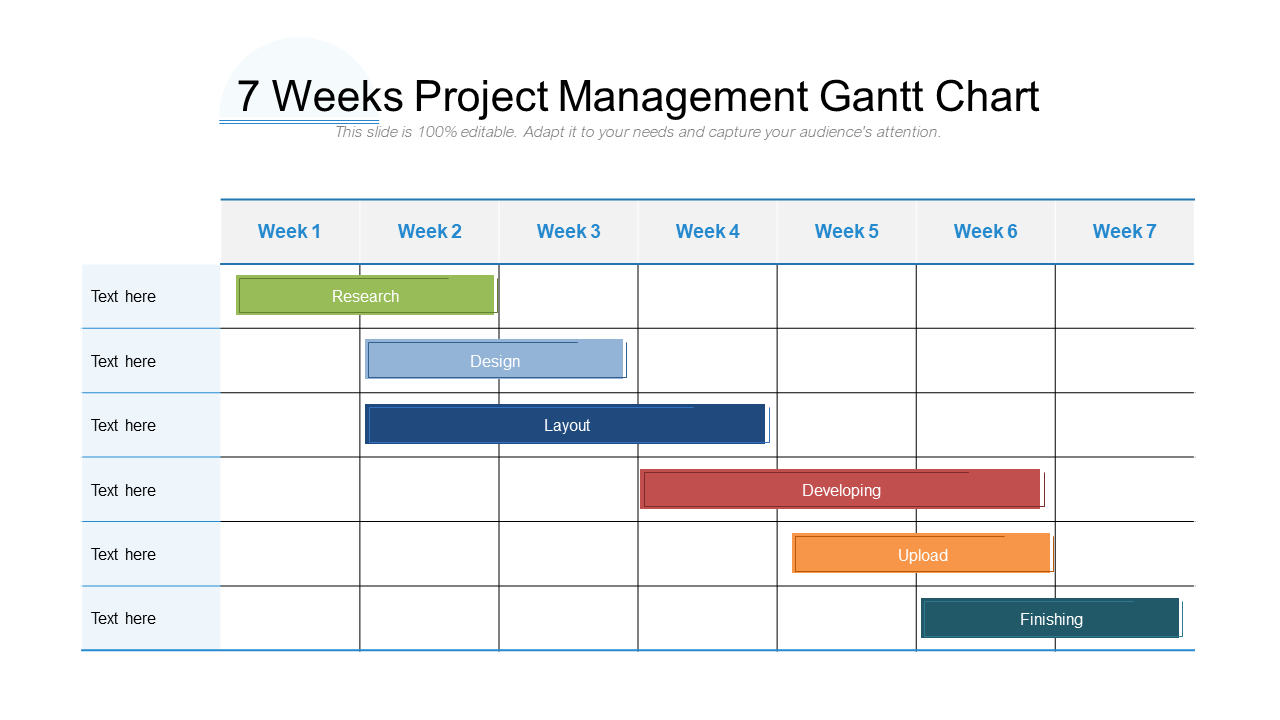
Template 9: Seven-Week Project Management Gantt Chart
These informative templates are recommended for preparing slideshows which help experts in creating an optimized project management report. This Gantt Chart Theme highlights tasks and time assigned to business executives, keeps track of actual completion times, and makes comparisons to assess progress.
The seven-week timeframe includes six stages:
- Research
- Design
- Layout
- Developing
- Upload
- Finish
Save your energy and deliver an outstanding presentation by downloading this layout to meet your purpose.
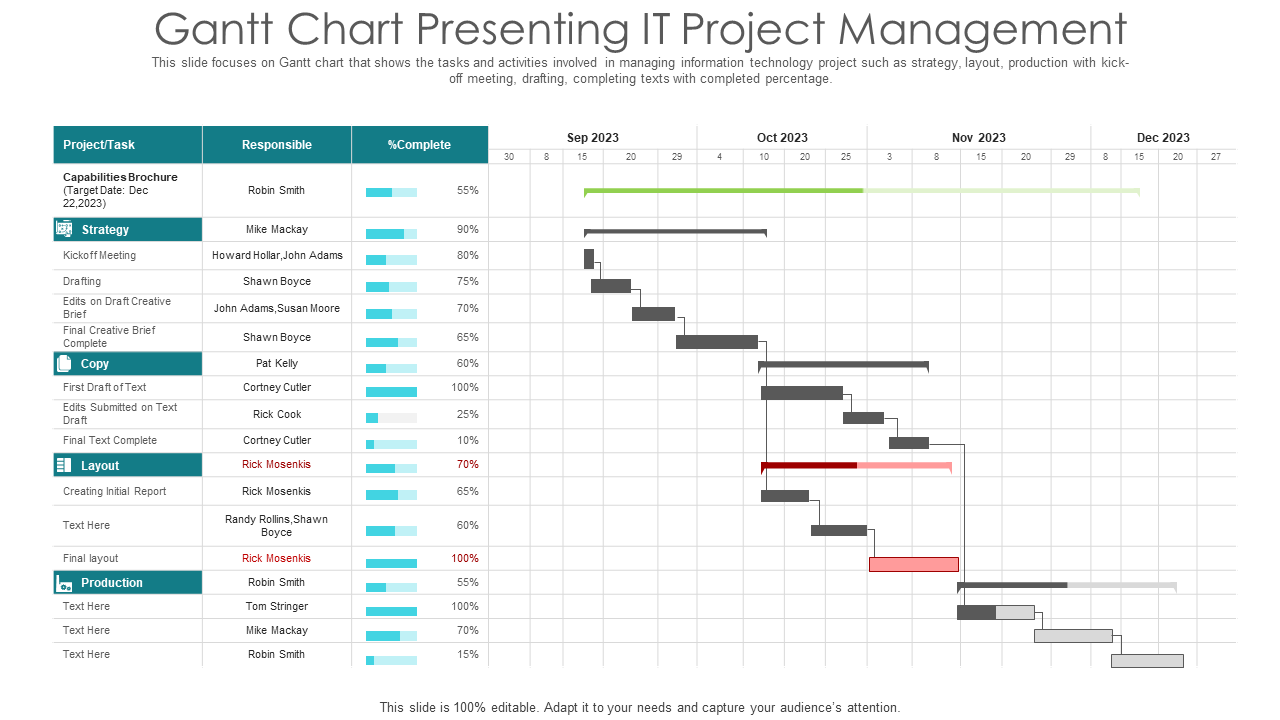
Template 10: Gantt Chart Presenting IT Project Management
This presentation focuses on the Gantt chart, which displays tasks and activities involved in managing an information technology project, including strategy, layout, production with a kick-off meeting, drafting and name of the team members, and task completion with the percentage. Download the user-friendly template to highlight insights you want your team to internalize.
Parting Thoughts
One of the secrets to effective project management is clear data visualization. All actions, procedures, and timeframes involved in a project are represented visually in a project management chart. Since it illustrates relationships between tasks and resources, it helps managers plan every step of the process. You may see your projects' timelines on a Gantt chart. Click to access common project management charts for use in our presentation.
The customizable templates offered by SlideTeam are available for use in standard and widescreen aspect ratios and can be downloaded in PNG, JPG, and PDF formats. The project management ppt slides are 100% editable and compatible with Google Slides, making them suitable for every industry and business domain. Project information is now simple to understand, apply, and learn with the adoption of this tool.
FAQs on Project Management Charts
What is a project management chart?
Project management charts are visual depictions of data that turn complex project management ideas into resources that are simple to understand. They are available in the form of flowcharts, network diagrams, and bar charts, and are helpful for program development. Some examples are Gantt charts, PERT charts, CPM diagrams, and WBS diagrams.
When expressing complex project planning data, project organization charts are essential. It makes complex ideas like your project schedule or scope understandable for the project management team and stakeholders.
What are the five main processes of project management?
- Initiate a group of procedures needed to begin a new project or a new phase of an existing project.
- Execute the processes used to carry out project activities and tasks.
- Observing & Regulating Process Group to track and report on progress
- Managing the performance and advancement of a project
- Wrap-up- Processes necessary to complete tasks.
What is the PERT chart in project management?
A Program Evaluation and Review Technique (PERT) chart shows the dependencies associated with each project. Before the project starts, you may use it to develop an initial schedule and an estimated deadline to discuss with project stakeholders. Similar charts describe tasks and give a visual picture of a project's timeframe.
Which chart is best for the project?
PERT charts is a necessary tool for project planning. Customers can rapidly identify any possible issues or bottlenecks. It can be a crucial tool for planning and visualizing when managers start a new project.
Alongside PERT Chart, the best time to use monthly Gantt charts is once a project is underway, especially if changes are needed. Gantt charts depict task durations, interdependencies, and resource management since they use bars and lists.




 Customer Reviews


