In the early 2000s, Hershey's, the renowned chocolate and confectionery giant, embarked on a major Enterprise Resource Planning (ERP) implementation. Unfortunately, this initiative, now known as the "Hershey's ERP Failure," encountered substantial challenges, resulting in significant disruptions to the company's operations.
Hershey's aimed to streamline its supply chain management, inventory control, and distribution processes with the new ERP system. However, the implementation faced planning and testing issues made worse by the unfortunate timing—the ERP rollout coincided with Hershey's peak season, Halloween. The system struggled to manage orders and inventory during this crucial period.
The difficulties led to delays in order processing, shipping problems, and a notable profit decline. The case of Hershey's serves as a cautionary tale, emphasizing the critical need for effective planning, comprehensive testing, and adept change management in ERP implementations. This tale showcases how important ERP dashboards are in all implementation stages.
ERP Report Presentation Designs
ERP dashboards are designed to encapsulate and display critical business data in an understandable and actionable format. They synthesize key metrics from various business functions—finance, sales, supply chain, human resources, and more—into a unified, interactive interface.
This allows leaders to assess their business's health, identify opportunities, and respond to emerging trends or challenges. The right ERP dashboard transforms raw data into strategic insights to propel your business toward efficiency, responsiveness, and sustained growth. At SlideTeam, we have the best ERP Dashboard Templates available online today.
These are content-ready and 100% editable templates that save you time and energy. They provide a starting point, a solid framework, and the flexibility to tailor the slides to your needs. So, no more starting from scratch!
Let us tour these ERP Dashboard Templates and see what they have to offer.
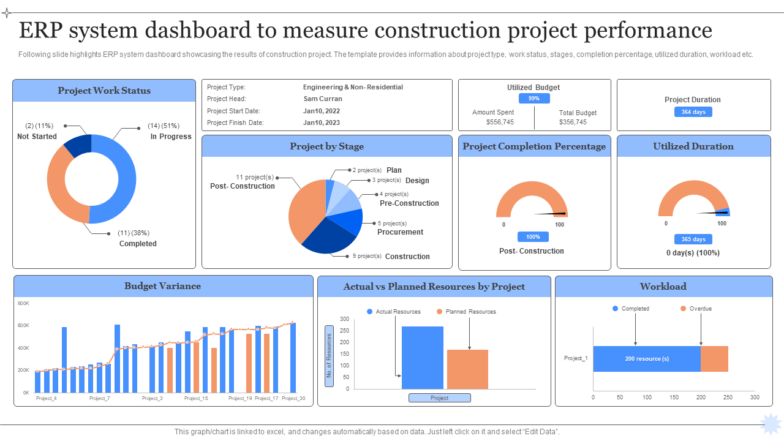
Template 1: ERP System Dashboard to Measure Construction Project Performance
The PowerPoint slide is an overview of the report on the performance of construction projects in an ERP system. The donut chart represents a work status overview of not started, in progress, and project completed by percentages. This includes the type of project, project head, and start and finish dates. Key performance indicators (KPIs), amongst other details of budget utilization, include the duration; post-construction has a completion gauge of the project. The project stages will be detailed using pie charts, while bar graphs will contrast budget variance and actual versus planned resources. This dashboard is a strategic tool for monitoring the progress, resource allocation, and financials in one place in real time. Download now.
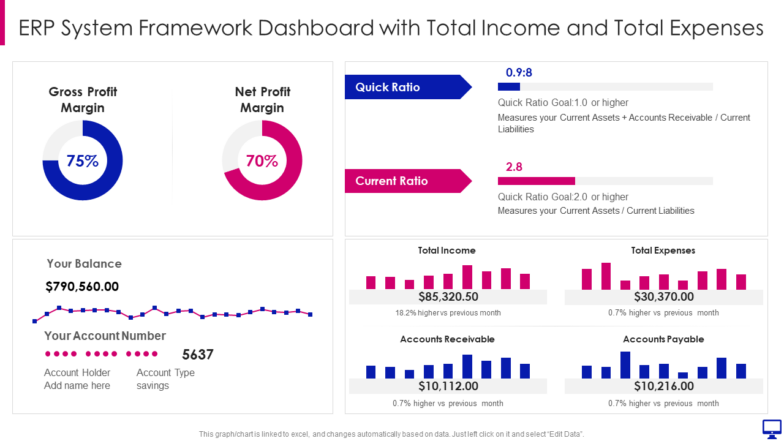
Template 2: ERP System Framework Implementation to Keep Business Framework Dashboard with Total Income Expenses
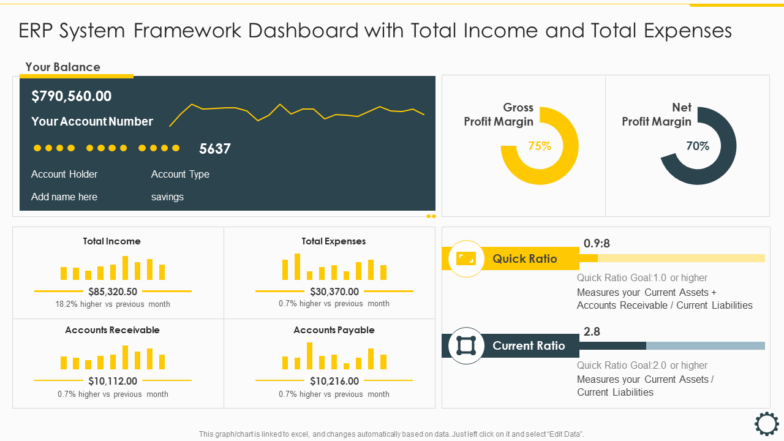
This PPT Slide delivers the financial health indicators for any business entity. It consists of donut charts displaying Gross and Net Profit Margins, each in the order of profitability by the entity. The Quick Ratio and the Current Ratio represent liquidity assessment, and they are included in horizontal bars with targeted goals. Additional information presented in the dashboard includes a balance overview, the account details, as well as graphing of the movements of the account balances. It compares Total Income and Total Expenses through bar graphs specifying the month-over-month changes along with Accounts Receivable and Payable. Grab it now.
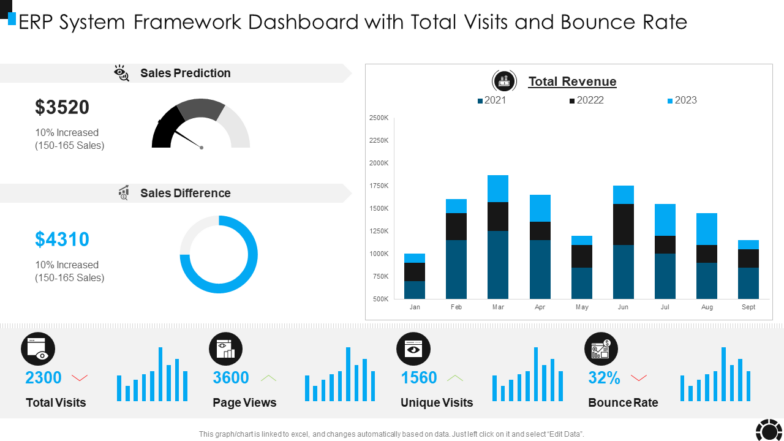
Template 3: ERP System Framework Dashboard with Total Visits and Bounce Rate
Use the indicated web analytics and the corresponding KPIs in this PPT Layout. They showcase the visiting traffic and sales forecast. The gauge indicator on the Sales Prediction indicates the change, and there is a circular chart for Sales Difference. A bar graph showing Total Revenue over the months for three separate years where growth or changes in business can be compared across time. Apart from the sales data, two more bar charts of the dashboard show website engagement metrics, such as Total Visits, Page Views, Unique Visits, and Bounce Rate. This dashboard is designed to help businesses keep an eye on their online performance and forecast future sales based on the pattern of web traffic. Make it yours today.
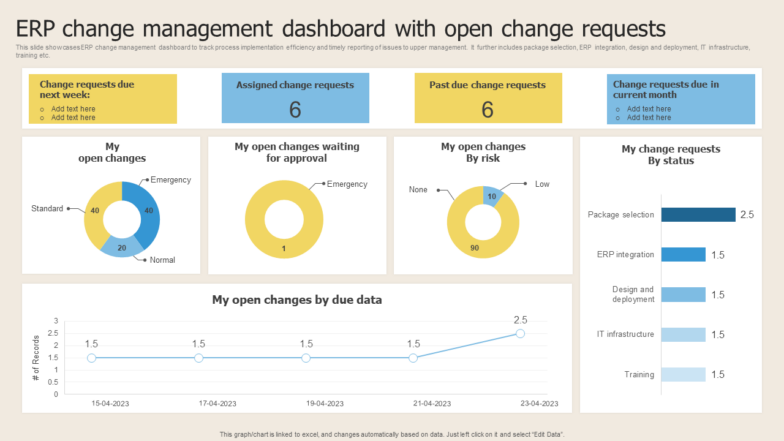
Template 4: ERP Change Management Dashboard with Open Change Requests
This PPT Theme will keep a check on the status of any change request that has been raised. Change requests can be upcoming, assigned, and past due with priority levels such as 'Emergency,' 'Normal,' and 'Standard'. It also consists of a donut chart of open changes waiting for approval, an assessment of the risk of open changes, and a timeline of open changes by the due date. Furthermore, a bar graph explains the number of change requests relating to its status in different implementation steps, including package selection and IT infrastructure. This graphic helps to trace all changes done within the ERP system on the level of effectiveness and promptness. Get it now.
Template 5: ERP Dashboard Highlighting Results of Construction Quality Management
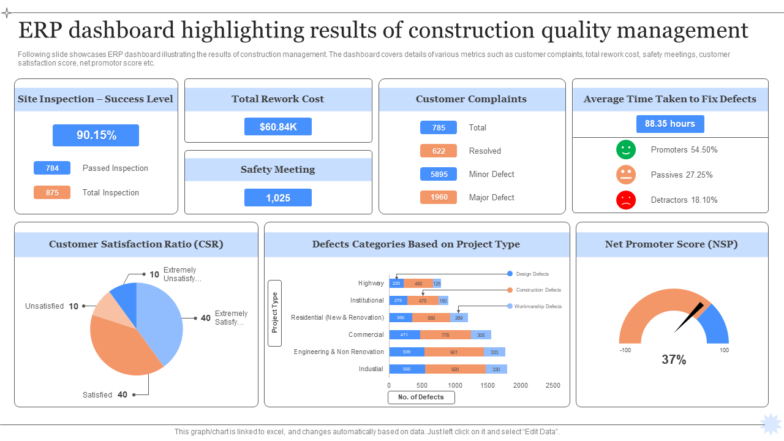
This PPT Slide consists of the important metrics, namely the Site Inspection Success Rate, Total Rework Costs, details of Customer Complaints with resolution statuses, and Safety Meetings conducted. It highlights a pie chart representing the Customer Satisfaction Ratio, a bar chart titled Defects by Project Type, the Average Time to Fix Defects, and the Net Promoter Score. This dashboard combines project quality, customer satisfaction, and safety engagement information for effective management. Download now from the link below.
Template 6: ERP System Framework Dashboard Overview Cloud ERP System Framework
This dashboard template helps you visualize and present financial metrics such as the account balance and information about the account itself. It has the Gross and Net Profit Margins, with liquidity ratios including the Quick Ratio and Current Ratio. Deliver an eye-catching presentation with bar charts depicting the Total Income and Total Expenses. Accounts Receivable and Payable also have their own space. Download this template to provide a holistic picture of the company's financial status for effective management and decision-making.
Template 7: ERP Project Management Plan Dashboard
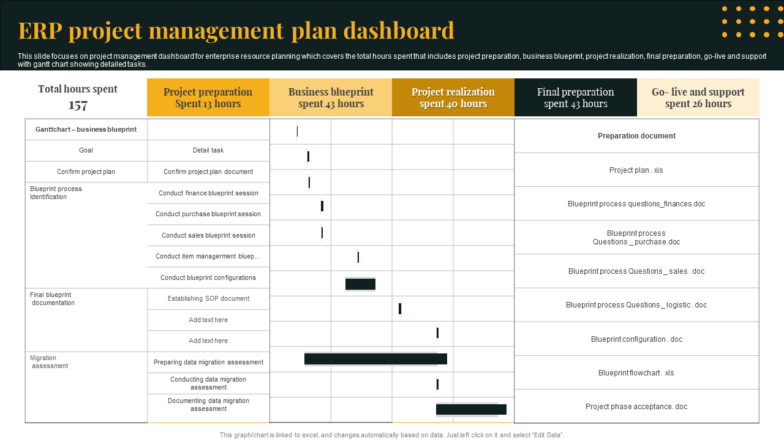
This dashboard tool delineates the total hours allocated across various project phases. This includes initial project preparation, business blueprint phase, and final preparation. The project realization phase follows these, followed by the go-live and support phases. The template has a Gantt chart to deliver the task timeline. It highlights pivotal activities such as confirming the project plan, conducting detailed blueprint sessions across different departments, finalizing documentation, and evaluating data migration strategies. Grab this slide now to track progress and ensure that every facet of the ERP implementation is met within the deadline.
Resources Rationed Right
These dashboards are navigational tools that guide decision-makers through the complex enterprise data landscape. With ready-made slides and complete customizability, equip yourself for that important meeting before you know it. Download the template of your choice right away!
Access these slides with a single click and streamline your resource allocation. You can choose one of our subscription services: monthly, semi-annual, annual, annual+ with a click here.
PS: The templates in this blog are not ranked in any particular order. Pick the one(s) you like and download it!




 Customer Reviews

