Budget Analysis Dashboard With Actual And Forecasted Profit Comparison
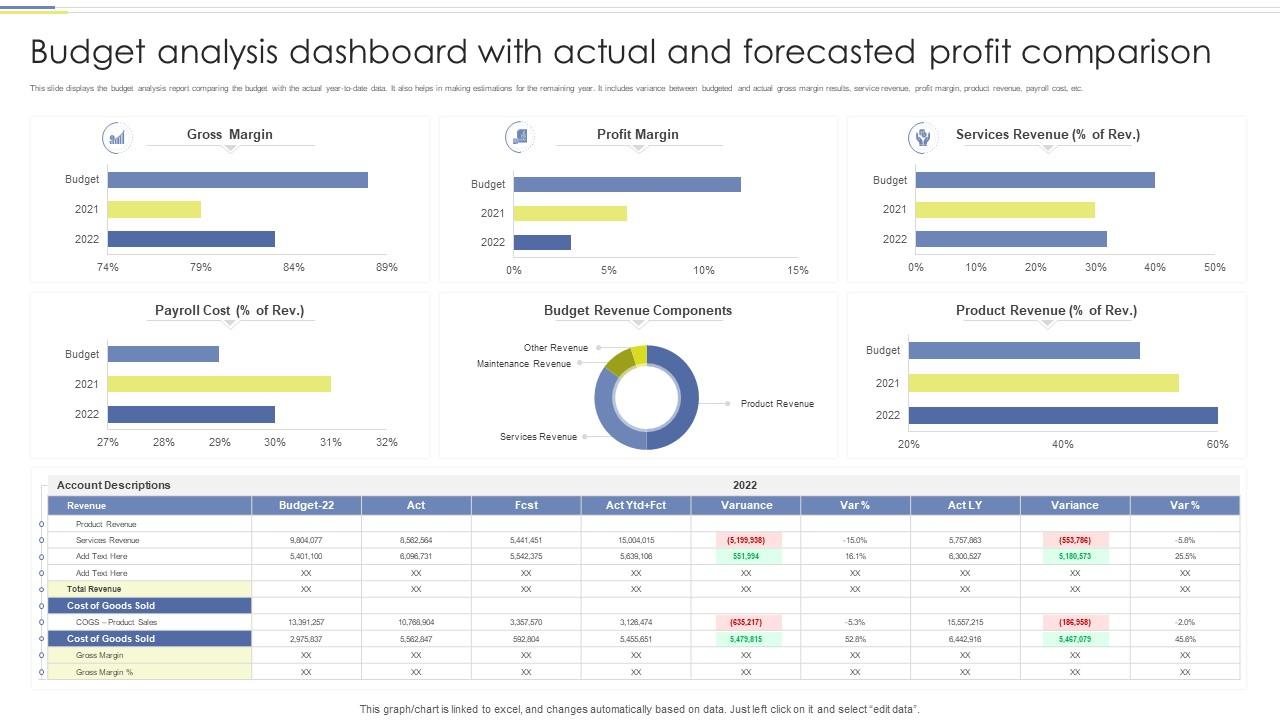
This slide displays the budget analysis report comparing the budget with the actual year to date data. It also helps in making estimations for the remaining year. It includes variance between budgeted and actual gross margin results, service revenue, profit margin, product revenue, payroll cost, etc.
This slide displays the budget analysis report comparing the budget with the actual year to date data. It also helps in mak..
- Google Slides is a new FREE Presentation software from Google.
- All our content is 100% compatible with Google Slides.
- Just download our designs, and upload them to Google Slides and they will work automatically.
- Amaze your audience with SlideTeam and Google Slides.
-
Want Changes to This PPT Slide? Check out our Presentation Design Services
- WideScreen Aspect ratio is becoming a very popular format. When you download this product, the downloaded ZIP will contain this product in both standard and widescreen format.
-

- Some older products that we have may only be in standard format, but they can easily be converted to widescreen.
- To do this, please open the SlideTeam product in Powerpoint, and go to
- Design ( On the top bar) -> Page Setup -> and select "On-screen Show (16:9)” in the drop down for "Slides Sized for".
- The slide or theme will change to widescreen, and all graphics will adjust automatically. You can similarly convert our content to any other desired screen aspect ratio.
Compatible With Google Slides

Get This In WideScreen
You must be logged in to download this presentation.
PowerPoint presentation slides
This slide displays the budget analysis report comparing the budget with the actual year to date data. It also helps in making estimations for the remaining year. It includes variance between budgeted and actual gross margin results, service revenue, profit margin, product revenue, payroll cost, etc. Introducing our Budget Analysis Dashboard With Actual And Forecasted Profit Comparison set of slides. The topics discussed in these slides are Gross Margin, Profit Margin, Payroll Cost, Services Revenue. This is an immediately available PowerPoint presentation that can be conveniently customized. Download it and convince your audience.
People who downloaded this PowerPoint presentation also viewed the following :
Budget Analysis Dashboard With Actual And Forecasted Profit Comparison with all 7 slides:
Use our Budget Analysis Dashboard With Actual And Forecasted Profit Comparison to effectively help you save your valuable time. They are readymade to fit into any presentation structure.
-
Visually stunning presentation, love the content.
-
Best way of representation of the topic.


