Financial Reviews and Accounting PPT Slides
-
 66212918 style essentials 2 financials 3 piece powerpoint presentation diagram infographic slide
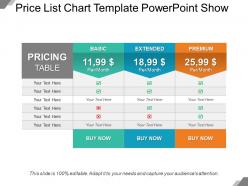
Presenting price list chart template PowerPoint show slideshow which is 100% editable. This PPT template is crafted with attractive display and unique components. This PPT slide is easy to customize and enables you to personalize it as per your own criteria. The presentation slide is fully compatible with Google slides, multiple format and software options. In case of any assistance, kindly take instructions from our presentation design services and it is easy to download in a very short span of time. The images, layouts, designs are of high quality and ensures quality in widescreen.
-
 22344256 style essentials 2 financials 5 piece powerpoint presentation diagram infographic slide
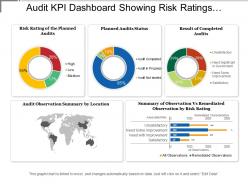
Presenting this set of slides with name - Audit Kpi Dashboard Showing Risk Ratings Planned Audit Status. This is a five stage process. The stages in this process are Audit, Examine, Survey.
-
 13780812 style essentials 2 financials 5 piece powerpoint presentation diagram infographic slide
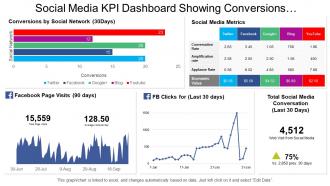
Presenting this set of slides with name - Social Media Kpi Dashboard Showing Conversions By Social Network And Metrics. This is a five stage process. The stages in this process are Social Media, Digital Marketing, Social Marketing.
-
 29565185 style essentials 2 financials 5 piece powerpoint presentation diagram infographic slide
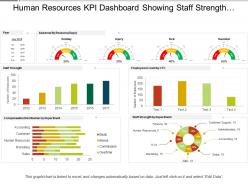
SlideTeam presenting Human Resources Kpi Dashboard Showing Staff Strength Compensation Distribution PPT. It will not only help you in knowing the exact strength of the staff but also about actual staff required in the organization. This slideshow is entirely editable and you can edit it whenever you want. All the slides in this presentation are compatible with Google slides. You can enter thousands of relatable icons of your own choice. You can also change from 4:3 standard screen size to 16:9 widescreen size.
-
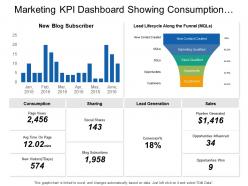 44768983 style essentials 2 financials 2 piece powerpoint presentation diagram infographic slide
As this slideshow is 100% customizable you can easily add or remove anything from the pre-designed slides. You can change the font size, font color and the font style of the text used following instructions given in the sample templates. The orientation, size and the color of various graphical illustrations used in the PPT template are also adjustable. If you download this PPT slideshow you can view it in either standard size screen ratio of 4:3 or wide screen display ratio of 16:9. The PowerPoint presentation can be saved in PDF or JPG format. The slides are fully compatible with Google slides.
-
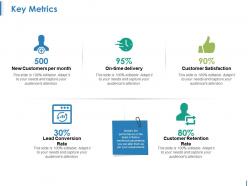 74178600 style essentials 2 financials 5 piece powerpoint presentation diagram infographic slide
Presenting this set of slides with name - Key Metrics Ppt Design Templates. This is a five stage process. The stages in this process are New Customers Per Month, On Time Delivery, Customer Satisfaction, Lead Conversion Rate, Customer Retention Rate.
-
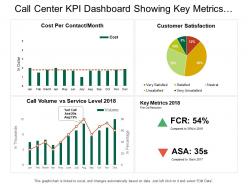 18142073 style essentials 2 financials 4 piece powerpoint presentation diagram infographic slide
Introducing call center kpi dashboard snapshot showing key metrics customer satisfaction presentation template. Slide designs quality does not deflect when opened on a wide screen show. Inconvenience free fuse of tweaked shading, content and illustrations. Slide incorporates instructional slides to give direction to change the graphical substance. Spare the presentation graphics in JPG or PDF organize. Successfully valuable for the systems administration experts, mediators and the procedure architects, it administrators, data innovation firms. Format slide with various stages or hubs are accessible. Simplicity of download.
-
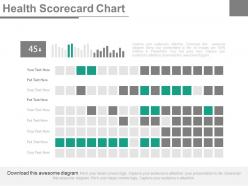 6949230 style essentials 2 financials 4 piece powerpoint presentation diagram infographic slide
Simple and scholarly slide outline. Utilization of outwardly amazing hues. Shocking picture quality. High determination pictures don't pixelate when anticipated on wide screen. Perfect with various programming and arrangement alternatives. 100 percent editable slide outline parts. Change the introduction components according to the need of 60 minutes. Customize the PPT with your organization name and logo. Utilized by business people, advertisers, administrative office, partners and understudies.The stages in this process are finance, marketing, strategy, business.
-
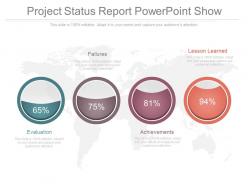 31542102 style essentials 2 financials 4 piece powerpoint presentation diagram infographic slide
Presenting project status report PowerPoint show. Change PowerPoint slide structure, font, text, color and design as per your requirements. Easy data entry options to put in company logo, brand or name. Ideal for marketing professionals, business managers, entrepreneurs and big organizations. This presentation theme is totally in sync with Google slide. Easy conversion to other software’s like JPG and PDF formats. Image quality remains the unchanged even when resize the image or portray on large screens.
-
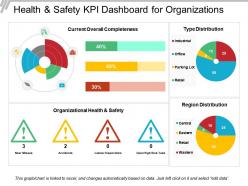 73270974 style essentials 2 financials 4 piece powerpoint presentation diagram infographic slide
Presenting this set of slides with name - Health And Safety Kpi Dashboard For Organizations. This is a four stage process. The stages in this process are Health And Safety, Health And Security, Health And Protection.
-
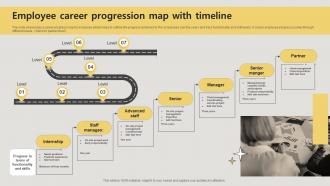 Employee Career Progression Map With Timeline
The slide showcases a career progress map for employee which helps to outline the progress achieved by the employees over the years and track functionality and skill levels. It covers employee progress journey through different levels intern to partner level. Introducing our premium set of slides with Employee Career Progression Map With Timeline Ellicudate the seven stages and present information using this PPT slide. This is a completely adaptable PowerPoint template design that can be used to interpret topics like Internship, Advanced Staff, Manager, Senior Manger . So download instantly and tailor it with your information.
-
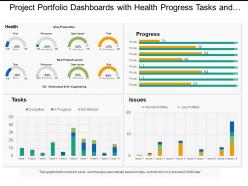 39744534 style division donut 4 piece powerpoint presentation diagram infographic slide
Presenting, project portfolio dashboards snapshot with health progress tasks and issues. This PPT Template can be used by specialists for designing their project portfolio dashboards and health progress matters for data analysis. You can change the color of the components shown in the figure and also edit the text to write a short brief about your company's financial affairs. This PowerPoint template is also compatible with google slides and can be projected to a widescreen for business meetings without pixelating.
-
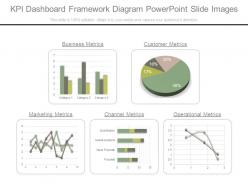 33483861 style essentials 2 financials 5 piece powerpoint presentation diagram infographic slide
PowerPoint template easy to modify as color, text, font etc are amendable. Notable quality presentation image. Well-adjusted online software programs such as JPG and PDF. Extra-ordinary picture quality as pixels don’t break when viewed in widescreen view. PPT design goes well with Google slides. Matching designs available with different nodes and stages. Handy presentation design saves you valuable time. Show the PowerPoint diagram with your corporate sign and title. Easy to download and can be saved for future reference.
-
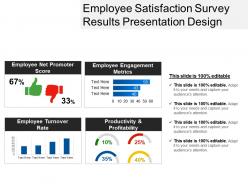 18984594 style essentials 2 financials 4 piece powerpoint presentation diagram infographic slide
Presenting Employee Satisfaction Survey Results Presentation Design. The slide is completely customizable and can be downloaded in various formats like JPG, PNG, and JPEG. It goes well with the Google Slides and the major Microsoft versions. Also, you are free to change the colors, font type and the font size of the slide. The background of the template can also be altered. The template can be viewed on two screen sizes i.e. standard screen (4:3) and widescreen (16:9).
-
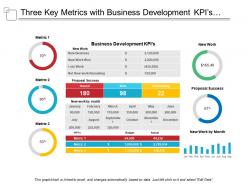 22987331 style division donut 3 piece powerpoint presentation diagram infographic slide
Presenting this set of slides with name - Three Key Metrics With Business Development Kpis And Proposal Success. This is a three stage process. The stages in this process are Key Metrics, Key Performance Indicator, Kpi.
-
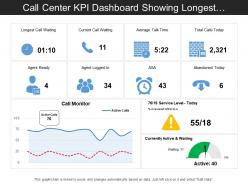 88663825 style essentials 2 financials 3 piece powerpoint presentation diagram infographic slide
Presenting this set of slides with name - Call Center Kpi Dashboard Showing Longest Call Waiting And Average Talk Time. This is a three stage process. The stages in this process are Call Center Agent, Customer Care, Client Support.
-
 2453731 style division donut 5 piece powerpoint presentation diagram template slide
Presenting business development statistics results slide powerpoint templates. This is a business development statistics results slide powerpoint templates. This is a five stage process. The stages in this process are results, output, deliverables, goals.
-
 5033807 style essentials 2 financials 3 piece powerpoint presentation diagram infographic slide
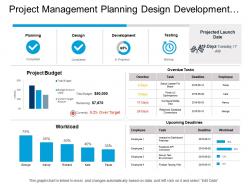
Easy get with different nodes and stages as required. Amendable presentation design comes with amazing picture quality. Modification is possible with color, text, font and shape. Prompt download and can be changed in JPEG and PDF format. Gives specialized effect to your Presentation template. PowerPoint slide exhibited in standard and widescreen view. Alternate to customize the design by adding business name, icon and symbol. PPT slide can be shared with Google slides as works merge well with them.
-
 34879238 style essentials 2 financials 5 piece powerpoint presentation diagram infographic slide
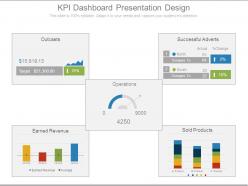
Presenting kpi dashboard presentation design. This is a kpi dashboard presentation design. This is a five stage process. The stages in this process are outcasts, operations, successful adverts, earned revenue, sold products.
-
 35658620 style division donut 3 piece powerpoint presentation diagram infographic slide
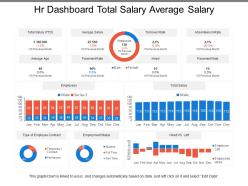
Presenting this set of slides with name - Hr Dashboard Total Salary Average Salary. This is a three stage process. The stages in this process are Hr Dashboard, Human Resource Dashboard, Hr Kpi.
-
 19463766 style essentials 2 financials 2 piece powerpoint presentation diagram infographic slide
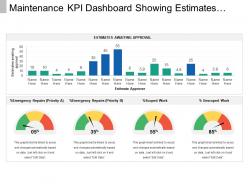
Presenting maintenance KPI dashboard snapshot showing estimates awaiting approval PPT slide. This layout is fully compatible with Google slides and data driven. User can edit the data in linked excel sheet and the design will change accordingly. Easy to put in company logo, trademark or name; accommodate words to support the key points. Images do no distort out even when they are projected on large screen. Adjust colors, text and fonts as per your business requirements.
-
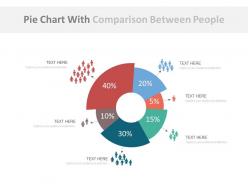 54553829 style essentials 2 dashboard 6 piece powerpoint presentation diagram infographic slide
Very useful for large companies and start-ups. Equally handy for school teachers for various subjects like geography, economics etc. Fully modifiable contents. PowerPoint templates available in widescreen format for different screen sizes. Easily convert PPT presentation to popular formats like JPG and PDF. Compatible with google slides for better usability. Uncomplicated process of changing icon features like Size, color and orientation.
-
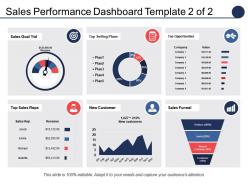 81906914 style essentials 2 financials 6 piece powerpoint presentation diagram infographic slide
Presenting sales performance dashboard top selling plans top opportunities PPT template. Completely amendable by any user at any point of time without any hassles. Error free performance to put an everlasting impression on the viewers. Great for incorporating business details such as name, logo and trademark. Can be utilized by students, entrepreneurs, investors and customers. Professionally designed presentation slides. Personalize the presentation with individual company name and logo. Available in both Standard and Widescreen slide size.
-
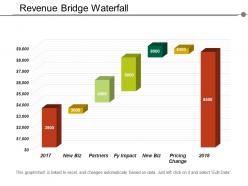 70284488 style essentials 2 financials 5 piece powerpoint presentation diagram infographic slide
Presenting the waterfall presentation template for PowerPoint. This PPT template is fully modifiable and is professionally designed. You can personalize the objects in the slide like font color and font size without any hassle. This PPT slide is 100% compatible with Google Slide and can be saved in JPG or PDF file format easily. Click on the download button below.
-
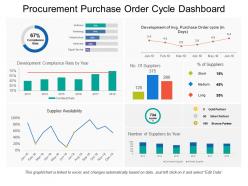 21655484 style essentials 2 financials 7 piece powerpoint presentation diagram infographic slide
Presenting this set of slides with name - Procurement Purchase Order Cycle Dashboard. This is a seven stage process. The stages in this process are Purchase, Procurement, Buy.
-
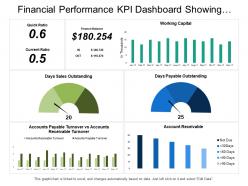 47966171 style essentials 2 dashboard 3 piece powerpoint presentation diagram infographic slide
Presenting this set of slides with name - Financial Performance Kpi Dashboard Showing Quick Ratio Current Ratio Working Capital. This is a three stage process. The stages in this process are Financial Performance, Financial Report, Financial Review.
-
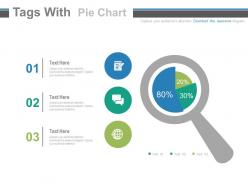 27510320 style essentials 2 financials 3 piece powerpoint presentation diagram infographic slide
Most appropriate for using the presentation slides for comparison purpose. Use of magnifier make the content appears specifically. Constructive for the users like business and finance professionals. Unique icons have been used for the purpose of making the content attractive. Prepared by professional experts keeping in mind feature of creativity. Crafted with crucial graphics and noticeable diagrams. Fitted with innovative images scheming three tags slides.
-
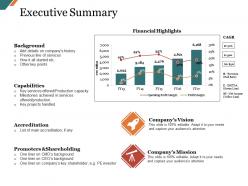 12440009 style essentials 2 financials 2 piece powerpoint presentation diagram infographic slide
Presenting this set of slides with name - Executive Summary Ppt Slide. This is a two stage process. The stages in this process are Background, Capabilities, Accreditation, Promoters And Shareholding, Company Vision.
-
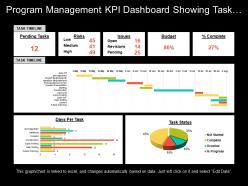 77243873 style essentials 2 financials 4 piece powerpoint presentation diagram infographic slide
Presenting Program Management KPI Dashboard Showing Task Timeline Risks And Budget PPT slide. The task timeline dashboard PowerPoint template designed professionally by the team of SlideTeam to present the values over time. The different icons such as pie chart, line chart, as well as other figures and text in the Graphical Chart KPI dashboard slide are customizable in PowerPoint. A user can illustrate the desired numerical information because the graphical management dashboard template gets linked with Excel Sheet. The management dashboard slide is compatible with Google Slide. You may edit the font size, font type, color and dimensions of the different chart to present the desired numerical information.
-
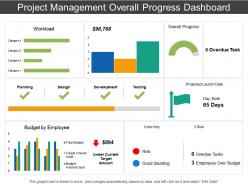 20839668 style essentials 2 financials 3 piece powerpoint presentation diagram infographic slide
Preference to amend and personalize the PPT slide by adding business details i.e. name, logo, image or even tag line. Quick download and can be shared with large audience. Staggering balance colors, font and shape. Comparable Presentation design comes with different nodes and stages. Familiar with Google slides and easy to alter into JPEG and PDF.PPT diagram can be shared in both standard and widescreen view depending upon your requirement. High resolution and tremendous quality PowerPoint template
-
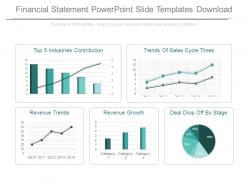 44966581 style essentials 2 financials 5 piece powerpoint presentation diagram infographic slide
Presenting financial statement powerpoint slide templates download. This is a financial statement powerpoint slide templates download. This is a five stage process. The stages in this process are top 5 industries contribution, trends of sales cycle times, revenue trends, revenue growth, deal drop off by stage.
-
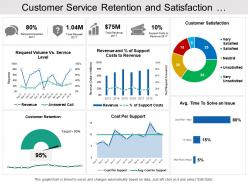 83477491 style essentials 2 financials 6 piece powerpoint presentation diagram infographic slide
Presenting this set of slides with name - Customer Service Retention And Satisfaction Dashboard. This is a six stage process. The stages in this process are Customer Base, Recurring Customers, Customer Services.
-
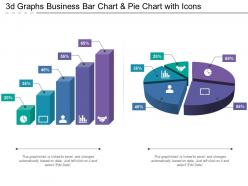 52090950 style essentials 2 financials 2 piece powerpoint presentation diagram infographic slide
Presenting this set of slides with name - 3d Graphs Business Bar Chart And Pie Chart With Icons. This is a two stage process. The stages in this process are Paint Brush, Art, Coloring.
-
 12592497 style essentials 2 financials 5 piece powerpoint presentation diagram infographic slide
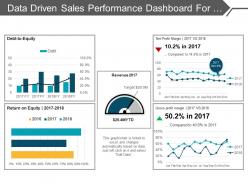
Presenting a PPT slide named Data driven sales performance dashboard for achieving sales target PPT slides. This PPT slide is Excel driven and easily customizable. The font style, the font color and the font size can be easily edited by a mere click. Access this presentation easily anywhere as it is compatible with Google slides. You can convert and save this slide in PDF or JPG formats. Add or delete content from the given slide as per your convenience. You can add icons to make it more impressive. You can choose from thousands of high quality icons. Download and enjoy the professionally designed PPT slide.
-
 8807472 style essentials 2 financials 3 piece powerpoint presentation diagram infographic slide
Widescreen output without the problem of pixilation. Thoroughly editable content. Modify the colors, orientation and font as per preference. Add company name and logo for maximum personalization. Comfort of incorporation or exclusion of details in slide background. Ease of download and compatibility with varied software. Significantly useful PowerPoint slide design for all those in the field of loan management, retail management, organizational development, communication and sales. The stages in this process are dollar symbols, finance, customer.
-
 46346874 style essentials 2 financials 3 piece powerpoint presentation diagram infographic slide
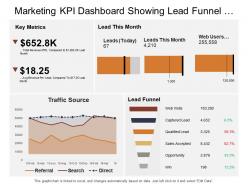
Presenting this set of slides with name - Marketing Kpi Dashboard Snapshot Showing Lead Funnel Traffic Sources Key Metrics. This is a three stage process. The stages in this process are Marketing, Branding, Promoting.
-
 8479765 style essentials 2 financials 2 piece powerpoint presentation diagram infographic slide
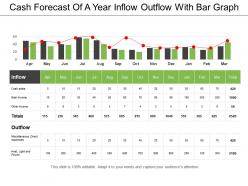
Presenting cash forecast of a year inflow outflow with bar graph. This is a cash forecast of a year inflow outflow with bar graph. This is a two stage process. The stages in this process are cash forecast, cash flow, money forecast, fund forecast.
-
 38580188 style essentials 2 financials 4 piece powerpoint presentation diagram infographic slide
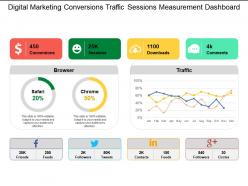
Presenting digital marketing conversions traffic sessions measurement dashboard. This is a digital marketing conversions traffic sessions measurement dashboard. This is a four stage process. The stages in this process are digital marketing, digital marketing dashboard, digital marketing funnel.
-
 44703304 style concepts 1 growth 5 piece powerpoint presentation diagram infographic slide
Beautifully crafted and professionally equipped PowerPoint template. Choice to edit the PPT slide as changes can be done with color, text and shape. Direction to modify the presentation design as per the business requirement. Customization is possible as can add commerce image, symbol etc. PPT diagram compatible with Google slides. Alternate to share in standard as well as in widescreen view. Availability to download with different nodes and stages.
-
 62911735 style essentials 2 financials 4 piece powerpoint presentation diagram infographic slide
Presenting this set of slides with name - Human Resources Kpi Dashboard Showing Employee Number By Salary Staff Composition. This is a four stage process. The stages in this process are Human Resource, Hrm, Human Capital.
-
 58325568 style essentials 2 financials 5 piece powerpoint presentation diagram infographic slide
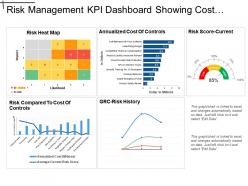
Presenting this set of slides with name - Risk Management Kpi Dashboard Showing Cost Of Control And Risk Score. This is a five stage process. The stages in this process are Risk Management, Risk Assessment, Project Risk.
-
 56370307 style essentials 2 financials 5 piece powerpoint presentation diagram infographic slide
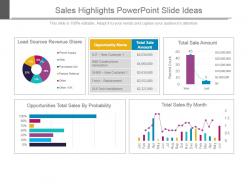
Presenting sales highlights powerpoint slide ideas. This is a sales highlights powerpoint slide ideas. This is a five stage process. The stages in this process are lead sources revenue share, opportunity name, total sale amount, total sale amount, opportunities total sales by probability, total sales by month.
-
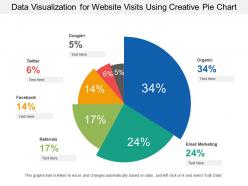 56224132 style division pie 6 piece powerpoint presentation diagram infographic slide
Presenting this set of slides with name - Data Visualization For Website Visits Using Creative Pie Chart. This is a six stage process. The stages in this process are Data Visualization, Data Management, Data Representation.
-
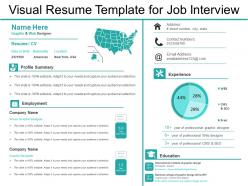 73980986 style essentials 1 location 2 piece powerpoint presentation diagram infographic slide
Presenting Visual Resume Template For Job Interview. You can make changes to the slideshow according to the needs. Add appealing data visualization tools including charts, graphs, tables, etc. to the slide. The template is also compatible with Google Slides. It is further editable in MS PowerPoint and similar software. Save it into common images or document formats such as JPEG, PNG or PDF. High-quality graphics will prevent distortion at any cost.
-
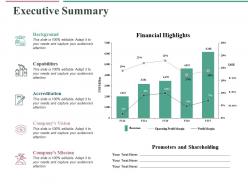 75339470 style essentials 2 financials 5 piece powerpoint presentation diagram infographic slide
Presenting this set of slides with name - Executive Summary Ppt Professional Display. This is a five stage process. The stages in this process are Bar Chart, Marketing, Strategy, Planning, Finance.
-
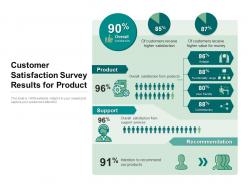 Customer satisfaction survey results for product
Presenting this set of slides with name Customer Satisfaction Survey Results For Product. This is a one stage process. The stages in this process are Product, Support, Recommendation. This is a completely editable PowerPoint presentation and is available for immediate download. Download now and impress your audience.
-
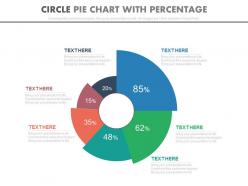 17345969 style essentials 2 financials 6 piece powerpoint presentation diagram infographic slide
This PPT slide can be used for business and finance related presentations. All the icons used here are 100% editable in a PowerPoint software, you can change the color, size, and orientation of any icon to your liking. You can insert your company logo in the PPT slide, which is also compatible with google slides.
-
 11007326 style essentials 2 financials 9 piece powerpoint presentation diagram infographic slide
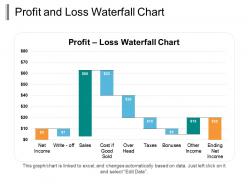
Presenting the Profit And Loss Waterfall Chart PPT Infographic Template. You can edit this template in PowerPoint. The PPT layout is customizable. You can link the slide to your excel sheet and the graph will change accordingly. The slide is available in both standard and wide screen formats. You can change the colors of the chart and bars and the background as well to suit your needs. So go ahead and make your presentation with a few clicks.
-
 80924883 style essentials 2 financials 4 piece powerpoint presentation diagram infographic slide
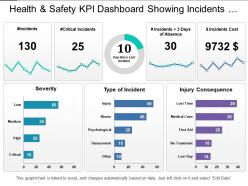
Presenting the health and safety PPT slide. This PPT slide is fully editable and is designed by professionals looking for a professional presentation. You can edit the objects in the slide like font size and font color easily. This presentation slide is fully compatible with Google Slide and can be saved in JPG or PDF file format easily. Click on the download button below.
-
 33831915 style essentials 2 financials 3 piece powerpoint presentation diagram infographic slide
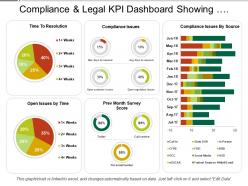
Presenting this set of slides with name - Compliance And Legal Kpi Dashboard Showing Compliance Issues And Resolution Time. This is a three stage process. The stages in this process are Compliance And Legal, Legal Governance, Risk Management.
-
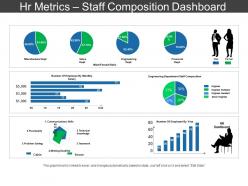 39194419 style essentials 2 financials 3 piece powerpoint presentation diagram infographic slide
Presenting HR Metrics Staff Composition Dashboard Sample PPT Files which is completely editable. You can open and save your presentation in various formats like PDF, JPG, and PNG. Freely access this template in both 4:3 and 16:9 aspect ratio. Change the color, font, font size, and font type of the slides as per your requirements. This template is adaptable with Google Slides which makes it easily accessible at once.
-
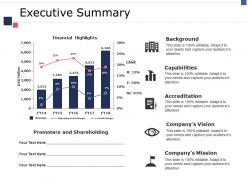 92569839 style concepts 1 growth 5 piece powerpoint presentation diagram infographic slide
Presenting this set of slides with name - Executive Summary Ppt Pictures Icon. This is a five stage process. The stages in this process are Financial Highlights, Background, Capabilities, Accreditation, Usd Million.
-
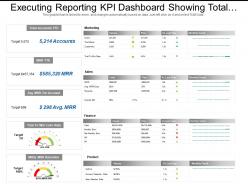 14053825 style essentials 2 financials 4 piece powerpoint presentation diagram infographic slide
Presenting this set of slides with name - Executing Reporting Kpi Dashboard Showing Total Accounts Marketing Sales Finance. This is a four stage process. The stages in this process are Executive Reporting, Executive Analysis, Executive Performance.
-
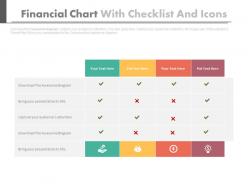 82105422 style essentials 2 financials 1 piece powerpoint presentation diagram infographic slide
Well crafted and professionally equipped PowerPoint visual. Use of bright and bold colors for maximum visual appeal. Ease of editing every component of the PPT template. Guidance for executing the changes has been provided for assistance. Modify and personalize the presentation by including the company name and logo. Compatible with varied number of format options. Compatible with multiple software options available both online and offline. Widely used by entrepreneurs, business strategists, business analysts, stakeholders, students and teachers.
-
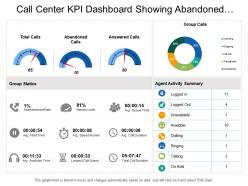 29988062 style essentials 2 financials 4 piece powerpoint presentation diagram infographic slide
Presenting this set of slides with name - Call Center Kpi Dashboard Showing Abandoned Calls Group Calls Group Statistics. This is a four stage process. The stages in this process are Call Center Agent, Customer Care, Client Support.
-
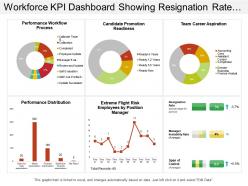 31512942 style essentials 2 financials 6 piece powerpoint presentation diagram infographic slide
Presenting this set of slides with name - Workforce Kpi Dashboard Showing Resignation Rate Manager Instability Rate And Performance Workflow Process. This is a six stage process. The stages in this process are Staff, Personnel, Workforce.
-
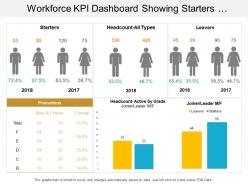 58857034 style essentials 2 financials 3 piece powerpoint presentation diagram infographic slide
Presenting this set of slides with name - Workforce Kpi Dashboard Showing Starters Headcount Leavers Promotions And Joiners. This is a three stage process. The stages in this process are Staff, Personnel, Workforce.
-
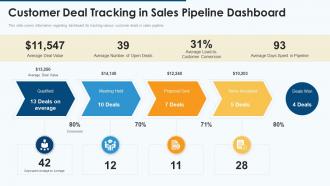 Effective pipeline management sales customer deal tracking in dashboard
This slide covers information regarding dashboard for tracking various customer deals in sales pipeline. Increase audience engagement and knowledge by dispensing information using Effective Pipeline Management Sales Customer Deal Tracking In Dashboard. This template helps you present information on four stages. You can also present information on Qualified, Meeting Held, Proposal Sent, Terms Accepted using this PPT design. This layout is completely editable so personaize it now to meet your audiences expectations.
-
 10936032 style essentials 2 financials 2 piece powerpoint presentation diagram infographic slide
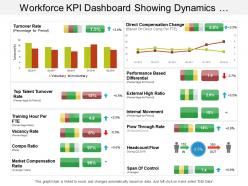
Presenting this set of slides with name - Workforce Kpi Dashboard Showing Dynamics Structure And Span Of Control. This is a two stage process. The stages in this process are Staff, Personnel, Workforce.
-
 34427863 style essentials 2 financials 4 piece powerpoint presentation diagram infographic slide
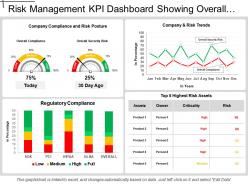
Presenting this set of slides with name - Compliance And Legal Kpi Dashboard Showing Regulatory Compliance. This is a four stage process. The stages in this process are Compliance And Legal, Legal Governance, Risk Management.


