Financial Reviews and Accounting PPT Slides
-
 14053825 style essentials 2 financials 4 piece powerpoint presentation diagram infographic slide
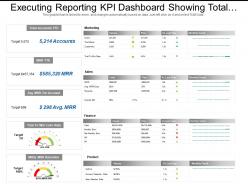
Presenting this set of slides with name - Executing Reporting Kpi Dashboard Showing Total Accounts Marketing Sales Finance. This is a four stage process. The stages in this process are Executive Reporting, Executive Analysis, Executive Performance.
-
 31512942 style essentials 2 financials 6 piece powerpoint presentation diagram infographic slide
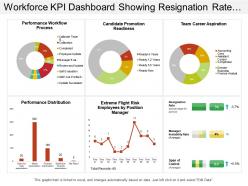
Presenting this set of slides with name - Workforce Kpi Dashboard Showing Resignation Rate Manager Instability Rate And Performance Workflow Process. This is a six stage process. The stages in this process are Staff, Personnel, Workforce.
-
 58857034 style essentials 2 financials 3 piece powerpoint presentation diagram infographic slide
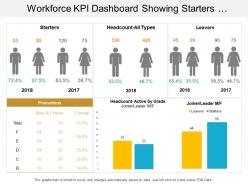
Presenting this set of slides with name - Workforce Kpi Dashboard Showing Starters Headcount Leavers Promotions And Joiners. This is a three stage process. The stages in this process are Staff, Personnel, Workforce.
-
 35103841 style essentials 2 financials 4 piece powerpoint presentation diagram infographic slide
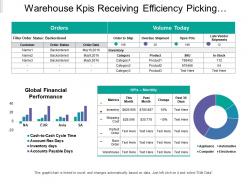
Presenting this set of slides with name - Warehouse Kpis Receiving Efficiency Picking Accuracy Backorder Rate Inventory. This is a four stage process. The stages in this process are Warehouse Kpi, Warehouse Dashboard, Warehouse Metrics.
-
 34427863 style essentials 2 financials 4 piece powerpoint presentation diagram infographic slide
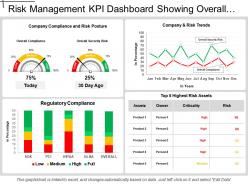
Presenting this set of slides with name - Compliance And Legal Kpi Dashboard Showing Regulatory Compliance. This is a four stage process. The stages in this process are Compliance And Legal, Legal Governance, Risk Management.
-
 54935531 style essentials 2 financials 5 piece powerpoint presentation diagram infographic slide
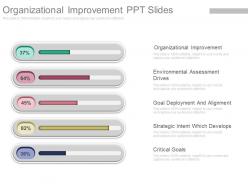
High quality of images and icons. Strikingly beautiful Presentation slide. Easily amendable PowerPoint design as can be edited smoothly. Access to demonstrate the PPT template in widescreen view. Adaptable designs as compatible with Google slides. Downloading is easy and can be altered into JPEG and PDF. Suitable for business presenters, management and the entrepreneurs.The stages in this process are organizational improvement, environmental assessment drives and much more.
-
 10936032 style essentials 2 financials 2 piece powerpoint presentation diagram infographic slide
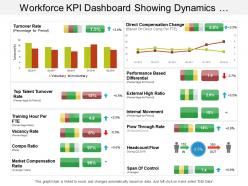
Presenting this set of slides with name - Workforce Kpi Dashboard Showing Dynamics Structure And Span Of Control. This is a two stage process. The stages in this process are Staff, Personnel, Workforce.
-
 Effective pipeline management sales customer deal tracking in dashboard
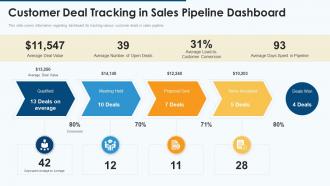
This slide covers information regarding dashboard for tracking various customer deals in sales pipeline. Increase audience engagement and knowledge by dispensing information using Effective Pipeline Management Sales Customer Deal Tracking In Dashboard. This template helps you present information on four stages. You can also present information on Qualified, Meeting Held, Proposal Sent, Terms Accepted using this PPT design. This layout is completely editable so personaize it now to meet your audiences expectations.
-
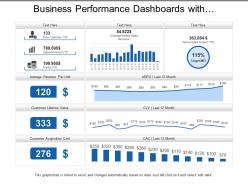 39384461 style essentials 2 financials 6 piece powerpoint presentation diagram infographic slide
Presenting, our business performance dashboards with average revenue and customer lifetime value PPT template. You can download this engaging PPT template and take a report of the full version of this PPT deck which includes editing the text, adjusting the colors according to your liking, watermark gets expelled, include your company's logo and get slides in widescreen version.
-
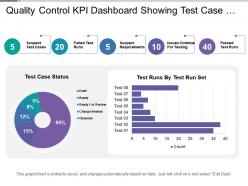 88546602 style essentials 2 financials 2 piece powerpoint presentation diagram infographic slide
Presenting this set of slides with name - Quality Control Kpi Dashboard Showing Test Case Status. This is a two stage process. The stages in this process are Quality Management, Quality Control, Quality Assurance.
-
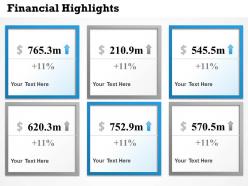 62754994 style essentials 2 financials 1 piece powerpoint presentation diagram infographic slide
We are proud to present our 0414 6 staged financial highlight diagram. Deadlines are an element of todays workplace. Our 6 staged financial highlight diagram Powerpoint Templates help you meet the demand. Just browse and pick the slides that appeal to your intuitive senses. Our 6 staged financial highlight diagram Powerpoint Templates will help you be quick off the draw. Just enter your specific text and see your points hit home.
-
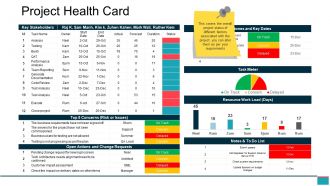 56004162 style essentials 2 financials 7 piece powerpoint presentation diagram infographic slide
Presenting this set of slides with name - Project Health Card Ppt Example File. This is a seven stage process. The stages in this process are Open Actions And Change Requests, Notes And To Do List, Milestones And Key Dates, Key Stakeholders.
-
 73329073 style essentials 2 compare 2 piece powerpoint presentation diagram infographic slide
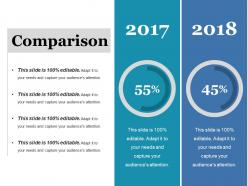
Presenting this set of slides with name - Comparison Ppt File Themes. This is a two stage process. The stages in this process are Finance, Business, Year, Comparison, Donut.
-
 83835587 style essentials 2 financials 1 piece powerpoint presentation diagram infographic slide
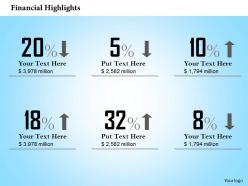
Proofing and editing can be done with ease in PPT design. Smooth functioning is ensured by the presentation slide show on all software’s. Color, style and position can be standardized, supports font size which can be read from a distance. When projected on the wide screen the PPT layout does not sacrifice on pixels or color resolution. Can be used by the technical support department, teachers, businessmen, managers and other professionals to have a setup a sequence of events.
-
 16157216 style essentials 2 financials 7 piece powerpoint presentation diagram infographic slide
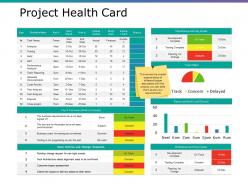
Presenting this set of slides with name - Project Health Card Ppt Samples Download. This is a seven stage process. The stages in this process are Business, Open Actions And Change Requests, Milestones And Key Dates, Marketing.
-
 71552935 style essentials 2 financials 3 piece powerpoint presentation diagram template slide
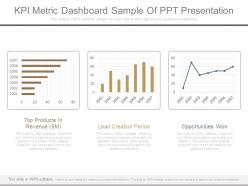
Presenting kpi metric dashboard sample of ppt presentation. This is a kpi metric dashboard sample of ppt presentation. This is a three stage process. The stages in this process are top products in revenue, lead creation period, opportunities won.
-
 8526485 style essentials 2 financials 2 piece powerpoint presentation diagram infographic slide
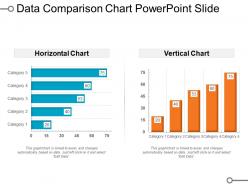
Presenting data comparison chart PowerPoint slide presentation template. You can download this slide and then save into another format such as JPG and PDF and can also display in standard and widescreen view. A user can alter this slide such as color, text, font type, font size and aspect ratio. This slide gets synced with Google Slides, Excel sheet and edit in PowerPoint. You may share this template with large segment because it has great pixel quality. You can insert the relevant content in text placeholder of this slide.
-
 50011220 style division donut 3 piece powerpoint presentation diagram infographic slide
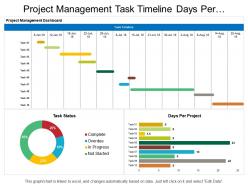
Introducing project management task timeline days per project dashboard PPT template. Access to convert the presentation design into JPG and PDF. Offer 100% access to change the values, size and style of the slides once downloaded and saved in the desired format. High quality charts, images and visuals used in the designing process. Choice to get presentation slide in standard or in widescreen view. Easy to convert in JPEG and PDF document. Compatible with Google slides. Easy and hassle-free downloading process.
-
 63274546 style division donut 6 piece powerpoint presentation diagram infographic slide
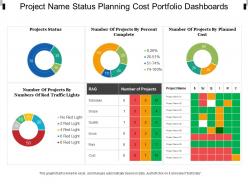
Introducing project name status planning cost portfolio dashboards PPT template. Presentable and easy to comprehend visual graphic. The presentation template can be downloaded and saved in any desired format. Valuable for the business presenters and entrepreneurs as they can showcase their business success in a creative way. Privilege of insertion of logo and trademarks for more personalization. Adaptable to wide screen view without the problem of pixilation. Can be used with Google slides. Beneficial for industry professionals, managers, executives, researchers, sales people, etc.
-
 95296544 style essentials 2 financials 4 piece powerpoint presentation diagram infographic slide
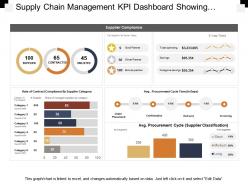
Presenting this set of slides with name - Supply Chain Management Kpi Dashboard Showing Supplier Compliance Stats. This is a four stage process. The stages in this process are Demand Forecasting, Predicting Future Demand, Supply Chain Management.
-
 3077377 style essentials 2 financials 1 piece powerpoint presentation diagram infographic slide
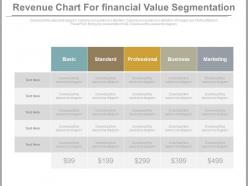
Presenting revenue chart for financial value segmentation powerpoint slides. This Power Point template slide has been crafted with graphic of revenue chart. This PPT slide contains the concept of financial value segmentation. Use this PPT slide for business and finance related presentations.
-
 41280404 style concepts 1 growth 5 piece powerpoint presentation diagram infographic slide
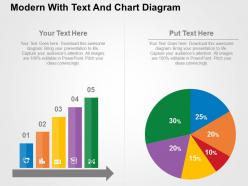
PowerPoint slides effortlessly coordinate with Google slides. Vertical bars and pie chart can have customised colors according to liking. High resolution PPT graphics leave no scope for pixilation on bigger and wider screens. Useful for data analysts, students and consumer-based companies. Amendable PPT layouts gives pin point control to the user. Supporting variety of software's, presentation design can be transformed into JPG and PDF easily.
-
 66546822 style essentials 2 financials 4 piece powerpoint presentation diagram infographic slide
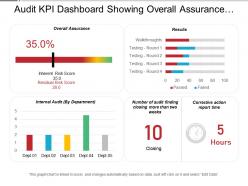
Presenting audit kpi dashboard showing overall assurance internal audit and results presentation slide. The PPT layout is extremely easy to understand as it enables you to roll out various improvements to the editable slides. You can change the text dimension, textual style and furthermore the textual style shading according to your prerequisites. Layout slide can be downloaded rapidly and taxi be spared in configuration of PDF or JPG effectively. The format slide in the wake of being downloaded can be seen in extensive screen show proportion of 16:9 or standard size presentation proportion of 4:3.
-
 46952321 style division donut 4 piece powerpoint presentation diagram infographic slide
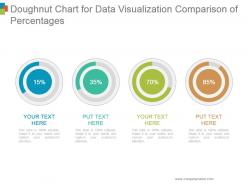
Presenting doughnut chart for data visualization comparison of percentages powerpoint slides design. This is a doughnut chart for data visualization comparison of percentages powerpoint slides design. This is a four stage process. The stages in this process are business, marketing, financial, percentage, increase.
-
 37948702 style essentials 2 financials 5 piece powerpoint presentation diagram infographic slide
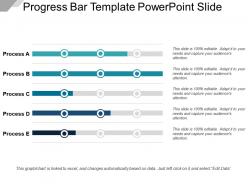
Presenting Progress Bar Template Powerpoint Slide.The designs are 100% editable in this PowerPoint template. The font size, font color, graphic colors, and slide background can be customized without any hassle. The users can add or remove the text according to their needs. This template includes a progress bar template which is designed by keeping compatibility with Google Slides in mind. It is available in both standard and widescreen size.
-
 78624752 style essentials 2 financials 4 piece powerpoint presentation diagram infographic slide
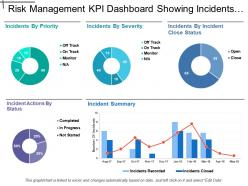
Presenting this set of slides with name - Risk Management Kpi Dashboard Showing Incidents By Priority And Severity. This is a four stage process. The stages in this process are Risk Management, Risk Assessment, Project Risk.
-
 96525001 style essentials 2 financials 2 piece powerpoint presentation diagram infographic slide
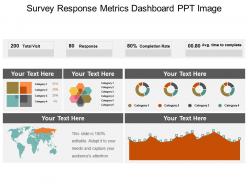
Presenting survey response metrics dashboard snapshot PPT image PPT presentation which is 100% editable. This PPT template is crafted with attractive display and unique components. This PPT slide is easy to customize and enables you to personalize it as per your own criteria. The presentation slide is fully compatible with Google slides, multiple format and software options. In case of any assistance, kindly take instructions from our presentation design services and it is easy to download in a very short span of time. The images, layouts, designs are of high quality and ensures quality in widescreen.
-
 8788121 style essentials 2 financials 6 piece powerpoint presentation diagram infographic slide
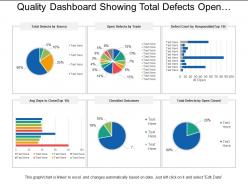
SlideTeam brings to you its totally editable and user-friendly quality dashboard showing total defects checklist outcome. This set of predesigned slides has been designed in such a manner that you can change the font style, font color and font size, etc. of the text used in the slides. After you download the PPT it can be viewed in standard size display ratio of 4:3 or widescreen display ratio of 16:9. The business template is very easy to use as it is compatible with Google Slides.
-
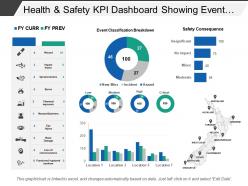 56250124 style essentials 2 financials 5 piece powerpoint presentation diagram infographic slide
Presenting the modern dashboard PPT template. This dashboard PPT design is 100% editable and is created by professionals. You can bring changes to the objects in the template like font size and font color very easily. This presentation slide is fully compatible with Google Slide and can be saved in JPG or PDF file format without any hassle. Fast download this at the click of the button.
-
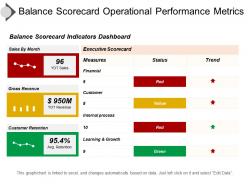 91369835 style essentials 2 financials 3 piece powerpoint presentation diagram template slide
Presenting Balance Scorecard Operational Performance Metrics Ppt Icon. You can save it into other formats like JPG & PDF after downloading this slide. You can easily represent the design in the standard or widescreen view. The template is compatible with Google Slides and editable in PowerPoint too. You can do modification in the color, text, font size, font type, diagram and aspect ratio of this slide. Sharing the template with a large segment become easy because of its splendid pixel quality. A user can easily add the related information in text placeholder of this slide.
-
 58210068 style essentials 2 financials 6 piece powerpoint presentation diagram infographic slide
Presenting this set of slides with name - Compliance And Legal Kpi Dashboard Showing High Priority Violations. This is a six stage process. The stages in this process are Compliance And Legal, Legal Governance, Risk Management.
-
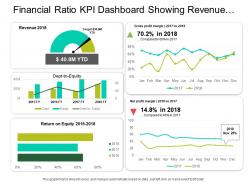 70094834 style essentials 2 financials 5 piece powerpoint presentation diagram infographic slide
Presenting this set of slides with name - Financial Ratio Kpi Dashboard Showing Revenue Net Profit Margin And Debt To Equity. This is a five stage process. The stages in this process are Accounting Ratio, Financial Statement, Financial Ratio.
-
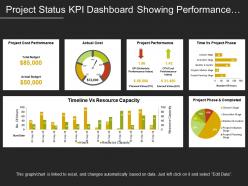 29720482 style essentials 2 financials 6 piece powerpoint presentation diagram infographic slide
Presenting this set of slides with name - Project Status Kpi Dashboard Showing Performance And Resource Capacity. This is a six stage process. The stages in this process are Project Health Card, Project Performance, Project Status.
-
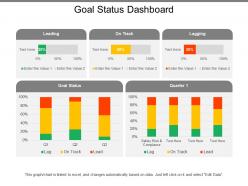 54317861 style essentials 2 financials 5 piece powerpoint presentation diagram template slide
Presenting this set of slides with name - Goal Status Dashboard. This is a five stage process. The stages in this process are Goal Status, Objective Status, Aim Status.
-
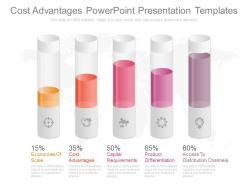 64093373 style essentials 2 financials 5 piece powerpoint presentation diagram infographic slide
The PowerPoint images as used are all vector based. No hassle of blurred image when projected on wide screen. High resolution. Compatibility with multiple software options both online and offline. Compatibility with numerous format options like JPEG, PDF, PNG, etc. Compatible with Google slides. Ease of personalization and customization. Add or delete the content as per one’s own need and situation. Used by the managers, company head, account managers, students and teachers.The stages in this process are economies of scale, cost advantages, capital requirements, product differentiation, access to distribution channels.
-
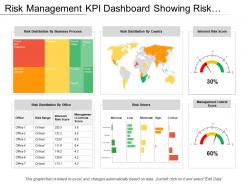 46807333 style essentials 2 financials 6 piece powerpoint presentation diagram infographic slide
Presenting this set of slides with name - Risk Management Kpi Dashboard Showing Risk Distribution By Country Office And Business Process. This is a six stage process. The stages in this process are Risk Management, Risk Assessment, Project Risk.
-
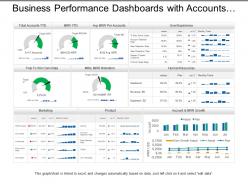 99854468 style essentials 2 dashboard 3 piece powerpoint presentation diagram infographic slide
Presenting, our business performance dashboards snapshot with accounts and mr growth PPT layout. High pixel resolution of the designs. Easy to edit and save using google slides. 100% modification of the slides granted. Apply your company name, replacing the official trademark in the slides. Valuable for the Marketing Professionals, business managers, and the directors. Includes extensive text spaces to include a title and can be easily projected to a widescreen.
-
 51719270 style essentials 2 dashboard 3 piece powerpoint presentation diagram infographic slide
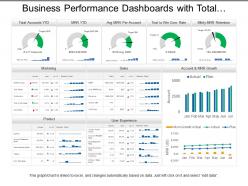
Presenting, business performance dashboards with total accounts marketing and product PowerPoint template. High-resolution PPT slide to reflect on business performance. The content is accurate and ready to use. Modifiable framework, layout, and font type, font size, and color schemes. Can be quickly transformed into PDF and JPG format. Appealing graphs for illustration and captivating figures to illustrate the idea. Can be extended to widescreen without loss of quality. Compatible with Google Slides and widescreens.
-
 25670342 style essentials 2 financials 4 piece powerpoint presentation diagram infographic slide
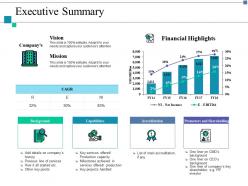
This is a four stage process. The stages in this process are Background, Capabilities, Accreditation, Vision, Mission.
-
 27163987 style essentials 2 financials 5 piece powerpoint presentation diagram infographic slide
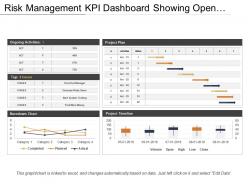
Presenting status KPI dashboard showing project plan and burndown chart PowerPoint slides. This layout is Compatible with Google slides. Easy to put in company logo, trademark or name; accommodate words to support the key points. Images do no blur out even when they are projected on large screen.PPT template can be utilized by sales and marketing teams and business managers. Instantly downloadable slide and supports formats like JPEG and PDF. Adjust colors, text and fonts as per your business requirements.
-
 24947383 style essentials 2 financials 2 piece powerpoint presentation diagram infographic slide
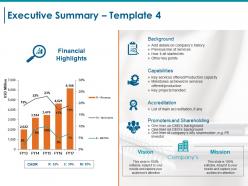
Presenting this set of slides with name - Executive Summary Ppt Styles Graphics Pictures. This is a two stage process. The stages in this process are Background, Capabilities, Accreditation, Promoters And Shareholding, Cagr.
-
 75694196 style essentials 2 financials 6 piece powerpoint presentation diagram infographic slide
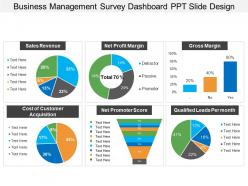
Presenting business management survey dashboard snapshot PPT slide design PowerPoint diagram which is 100% editable. This PPT template is data driven i.e. excel linked and is easy to customize and enables you to personalize it as per your own criteria. The presentation slide is fully compatible with Google slides, multiple format and software options. In case of any assistance, kindly take instructions from our presentation design services and it is easy to download in a very short span of time. The images, layouts, designs are of high quality and ensures quality in widescreen.
-
 72882880 style essentials 2 financials 4 piece powerpoint presentation diagram infographic slide
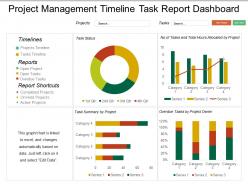
Introducing project management timeline task report dashboard snapshot PPT template. An easy access to make the desired changes or edit it anyways. Wide screen view of the slides. Easy conversion into Jpeg or Pdf format. The PPT images offer compatibility with Google Slides. High resolution icons for clear message delivery. Unique and informational content. Valuable for business professionals, sales representatives, marketing professionals, students and selling investigators. High quality charts and visuals used in the designing process. They enhance the performance of the presentation.
-
 93288526 style essentials 2 financials 3 piece powerpoint presentation diagram infographic slide
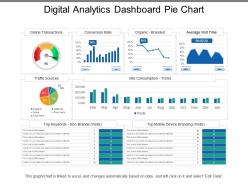
Presenting this set of slides with name - Digital Analytics Dashboard Pie Chart. This is a five stage process. The stages in this process are Digital Analytics, Digital Dashboard, Digital Kpis.
-
 37183820 style division donut 5 piece powerpoint presentation diagram infographic slide
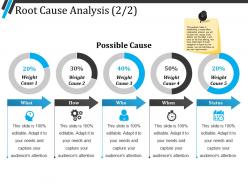
Presenting Root Cause Analysis PPT Summary which is designed professionally for your convenience. You can change the color, fonts, font size, and font types of the template as per the requirements. The slide is readily available in both 4:3 and 16:9 aspect ratio. It is adaptable with Google Slides which makes it accessible at once. Can be converted into formats like PDF, JPG, and PNG.
-
 97549429 style essentials 2 financials 3 piece powerpoint presentation diagram infographic slide
Presenting this set of slides with name - Business Kpi Dashboard Showing Marketing Spend And Return On Investment. This is a three stage process. The stages in this process are Business Dashboard, Business Kpi, Business Performance.
-
 49564262 style essentials 2 financials 5 piece powerpoint presentation diagram infographic slide
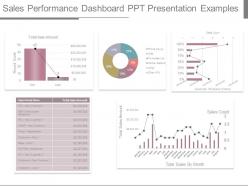
Presenting sales performance dashboard ppt presentation examples. This is a sales performance dashboard ppt presentation examples. This is a five stage process. The stages in this process are total sale amount, total sales amount, sales count, total sales by month, record count.
-
 62677579 style concepts 1 growth 4 piece powerpoint presentation diagram infographic slide
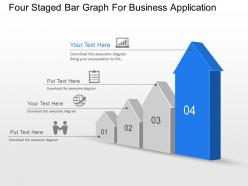
We are proud to present our four staged bar graph for business application powerpoint template slide. This power point template diagram has been crafted with graphic of four staged bar graph. This PPT diagram contains the concept of business application. Use this PPT diagram for business and finance related presentations.
-
 81755669 style essentials 2 financials 1 piece powerpoint presentation diagram infographic slide
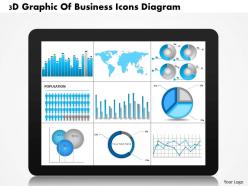
Express download and can be easily integrate in the presentation. Presentation template attainable in standard and widescreen view. PowerPoint design designed with high quality resolution design. Easily editable as color, text and layout are editable as required. PPT slide available in similar designs with different nodes and stages. Downloadable with different nodes and stages. Suitable for corporate management experts, business analysis team, entrepreneurs, learners, educators etc.
-
 Global Banking And Markets Goldman Sach Company Profile CP SS
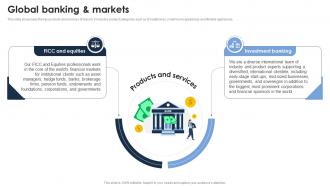
This slide showcases the key products and services of Xiaomi. It includes product categories such as Smartphones, smart home appliances and lifestyle appliances. Increase audience engagement and knowledge by dispensing information using Global Banking And Markets Goldman Sach Company Profile CP SS This template helps you present information on two stages. You can also present information on Investment Banking, FICC And Equities using this PPT design. This layout is completely editable so personaize it now to meet your audiences expectations.
-
 71981837 style essentials 2 financials 6 piece powerpoint presentation diagram infographic slide
Presenting employee survey motivation PowerPoint slide show. PPT is useful for HR managers, entrepreneurs for employee satisfaction and motivation related slideshows. You can download and convert the PPT design into JPEG and PDF formats. PPT is fully editable. Modify and customize the design template by changing font type, color, size, shape, background, style and other related graphics. You can open the design with Google Slides and PowerPoint.
-
 23990224 style essentials 2 financials 6 piece powerpoint presentation diagram infographic slide
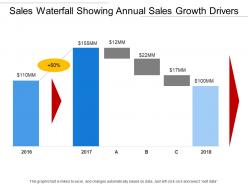
Presenting the Sales Waterfall Showing Annual Sales Growth Drivers PowerPoint presentation slide. You can edit this template in PowerPoint and use it in Google slides also. The PPT layout is totally editable. You can add relevant content in the text holders provided. The image has a high resolution so that it does not blur on being enlarged. The slide is available in both standard and wide screen formats. So, click, edit and present.
-
 22338896 style concepts 1 growth 3 piece powerpoint presentation diagram infographic slide
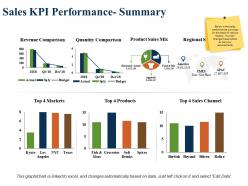
Presenting this set of slides with name - Sales Kpi Performance Summary Revenue Comparison Product Sales Mix. This is a three stage process. The stages in this process are Revenue Comparison, Quantity Comparison, Product Sales Mix, Regional Sales Mix, Top Sales Channel.
-
 10106722 style essentials 2 financials 3 piece powerpoint presentation diagram infographic slide
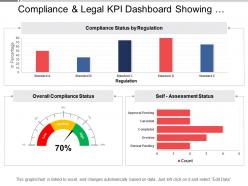
Presenting this set of slides with name - Compliance And Legal Kpi Dashboard Showing Overall Compliance Status. This is a three stage process. The stages in this process are Compliance And Legal, Legal Governance, Risk Management.
-
 8333056 style essentials 2 financials 4 piece powerpoint presentation diagram template slide
Presenting budget report powerpoint topics. This is a budget report powerpoint topics. This is four stage process. The stages in this process are budget, incurred, planned, forecasted, project, incurred, future scheduled, remaining, amount, expenses, time and fees, total.
-
 51934077 style essentials 2 financials 3 piece powerpoint presentation diagram infographic slide
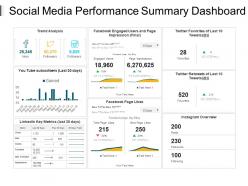
Presenting Social Media Performance Summary Dashboard Presentation Pictures PPT slide. This presentation design has been professionally designed, is fully editable in PowerPoint and is compatible with Google slides as well. You can customize the font type, font size, colors of the diagram, background color and add the company logo. High quality graphs, charts, tables and icons ensure that there is no deteriorating in quality on enlarging their size. Fast download at click of a button.
-
 80418818 style essentials 2 financials 2 piece powerpoint presentation diagram template slide
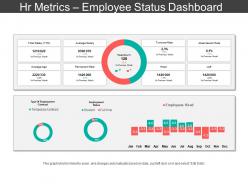
Presenting HR Metrics Employee Status Dashboard Snapshot PPT Slide Templates which is designed professionally for your convenience. Change the color, font, font size, and font type of the slides as per your requirements. The template is compatible with Google Slides which makes it easily accessible at once. Open and save your presentation in various formats like PDF, JPG, and PNG. Freely access your template in both 4:3 and 16:9 aspect ratio.
-
 22511509 style essentials 2 financials 3 piece powerpoint presentation diagram infographic slide
Presenting this set of slides with name - Marketing Kpi Dashboard Showing Visits Traffic Sources And Bounce Rate. This is a three stage process. The stages in this process are Marketing, Branding, Promoting.
-
 8568620 style variety 1 silhouettes 6 piece powerpoint presentation diagram infographic slide
Presenting this set of slides with name - Command Center Person Handling Computer System Screen. This is a six stage process. The stages in this process are Command Room, Control Centre, Control Room.
-
 67184523 style essentials 2 financials 6 piece powerpoint presentation diagram infographic slide
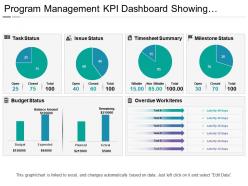
Presenting Program Management KPI Dashboard Showing Timesheet Summary PPT slide. The Program management KPI dashboard PowerPoint template designed professionally by the team of SlideTeam to present the record of timesheet summary to do any task. The pie chart and line chart figures along with that the text in the timesheet summary dashboard slide are customizable in PowerPoint. A user can illustrate the specific time to do any task because the pie chart dashboard template gets linked with Excel Sheet along with that it is also compatible with Google Slide. A user can alter the font size, font type, color, as well as dimensions of the pie and line chart to present the specific time.


