- Sub Categories
-
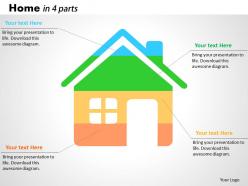 0414 home graphics business bar chart powerpoint graph
Fast and easy to download in quick steps. Add text as per context. Presentation icons with fully modifiable color and contrast as per your need. Change orientation and sizes of PPT infographics according to need. No change in resolution on editing and no pixelation on wide screen projection. Ideal for real estate developers, infrastructure firms, portfolio managers etc.
-
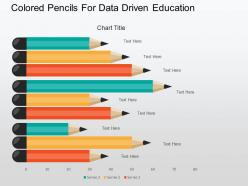 Colored pencils for data driven education powerpoint slides
Simple and convenient instantaneous download. Absolutely editable text as per the context of your presentation. Change orientation and sizes of PPT images to your liking. Insert company name, logo, tagline, watermark etc. Totally modifiable color scheme and contrast. High resolution PPT infographics that do not pixelate on wide screen projection.
-
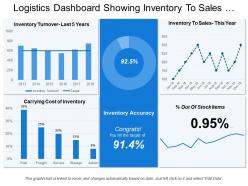 Logistics dashboard showing inventory to sales and inventory turnover
Presenting Logistics Dashboard Showing Inventory To Sales And Inventory Turnover PPT slide. The inventory to sale dashboard PowerPoint template designed professionally by the team of SlideTeam to present the annual report to clients and investors too. The different charts such as bar, line and many other, along with that the text in the inventory dashboard slide are customizable in PowerPoint. The logistics inventory dashboard slide is compatible with Google Slide. An individual can make changes in the font size, font type, color and dimensions of the different icons according to the requirement. This graphical inventory slide gets linked with Excel Data Sheet.
-
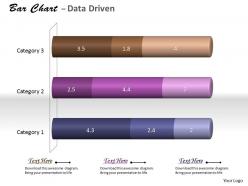 Data driven 3d classification of data chart powerpoint slides
We are proud to present our data driven 3d classification of data chart powerpoint slides. Our Data Driven 3D Classification Of Data Chart Powerpoint Slides Power Point Templates Will Provide Weight To Your Words. They Will Bring Out The Depth Of Your Thought Process. Words Like Arrows Fly Straight And True. Use Our Data Driven 3D Classification Of Data Chart Powerpoint Slides Power Point Templates To Make Them Hit Bulls eye Every time.
-
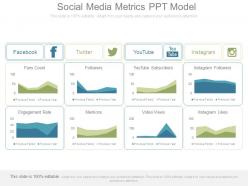 Social media metrics ppt model
Presenting social media metrics ppt model. This is a social media metrics ppt model. This is a eight stage process. The stages in this process are facebook, twitter, youtube, instagram, fans count, followers, youtube subscribers, instagram followers, engagement rate, mentions, video views, instagram likes.
-
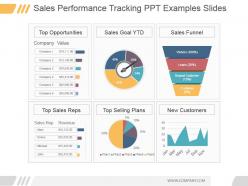 Sales performance tracking ppt examples slides
Presenting sales performance tracking ppt examples slides. This is a sales performance tracking ppt examples slides. This is a four stage process. The stages in this process are top opportunities, sales goal ytd, sales funnel, company, value, company, visitors, leads, repeat customer, customer, top sales reps, top selling plans, new customers, plan, jan, mar, may, jul, sep, nov, sales rep, mary, emma, michael, john.
-
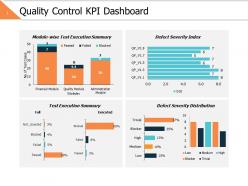 Quality control kpi dashboard ppt powerpoint presentation gallery diagrams
Presenting this set of slides with name - Quality Control Kpi Dashboard Ppt Powerpoint Presentation Gallery Diagrams. This is a four stage process. The stages in this process are Business, Management, Strategy, Analysis, Finance.
-
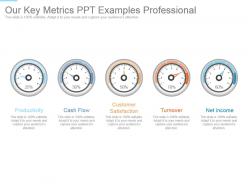 Our key metrics ppt examples professional
Presenting our key metrics ppt examples professional. This is a our key metrics ppt examples professional. This is a five stage process. The stages in this process are productivity, cash flow, customer satisfaction, turnover, net income.
-
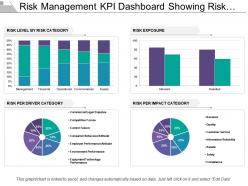 Risk Management Kpi Dashboard Showing Risk Level Exposure And Impact
Presenting this set of slides with name - Risk Management Kpi Dashboard Showing Risk Level Exposure And Impact Category. This is a four stage process. The stages in this process are Risk Management, Risk Assessment, Project Risk.
-
 1214 four magnifying glasses with pie for data analysis powerpoint slide
We are proud to present our 1214 four magnifying glasses with pie for data analysis powerpoint slide. Four magnifying glasses are used to craft this power point template slide. This PPT slide also contains the graphic of pie graph. This PPT contains the concept of data driven search. This PPT can be used for business and finance related presentations
-
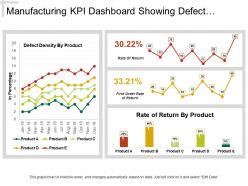 Manufacturing kpi dashboard showing defect density and rate of return
Presenting this set of slides with name - Manufacturing Kpi Dashboard Showing Defect Density And Rate Of Return. This is a four stage process. The stages in this process are Manufacturing, Production, Manufacture.
-
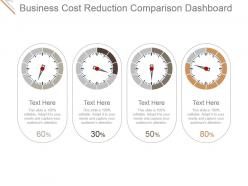 Business cost reduction comparison dashboard snapshot ppt ideas
Presenting business cost reduction comparison dashboard ppt ideas. This is a business cost reduction comparison dashboard snapshot ppt ideas. This is a four stage process. The stages in this process are business, meter, measure, reduction, cost.
-
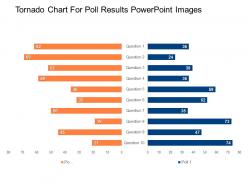 Tornado chart for poll results powerpoint images
Presenting tornado chart for poll results PowerPoint images PPT slide. PPT has impressive use of picture quality. Images do not pixelate when projected on a wide screen. Professionally equipped and aesthetically designed visuals. PowerPoint is compatible with a large set of software options available both online and offline and also compatible with multiple format options. It is thoroughly editable slide design background. Modify the content with ease. There is freedom to personalize the content with company name and logo. Used by investors, stakeholders, marketers, vendors, salespeople, teachers and students.
-
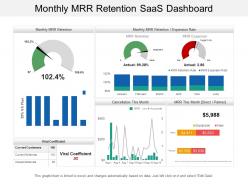 Monthly mrr retention saas dashboard
Offering monthly MRR retention Saas dashboard PPT template. Access to convert the presentation design into JPG and PDF. Offer 100% access to change the values, size and style of the slides once downloaded and saved in the desired format. High quality charts, images and visuals used in the designing process. Choice to get presentation slide in standard or in widescreen view. Easy to convert in JPEG and PDF document. Compatible with Google slides. Easy and hassle free downloading process.
-
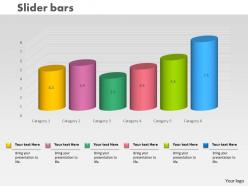 0414 financial ratio slider column chart powerpoint graph
Flexible option for conversion in PDF or JPG formats. Professionally designed presentation slides. Fully adjustable with Google slides. Can be easily changed as the PPT slide chart is completely editable. Personalize the presentation with individual company name and logo. Suitable for finance experts, accounts team professionals, etc. Download and save the presentation in desired format.
-
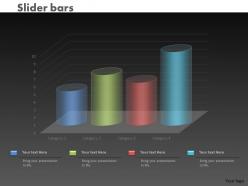 0414 slider column chart data illustration powerpoint graph
Amendable presentation design with amazing picture quality. Modification is possible with color, text, font and shape. Excel linked design so you can make changes in the excel sheet and the design will change accordingly. Prompt download and can be changed in JPEG and PDF format. Gives a specialized effect to your Presentation template. Alternate to customize the design by adding business badge, icon and symbol. PowerPoint slide exhibited in standard and widescreen view. Useful for marketing people, corporate managers, revenue department and human resource teams.
-
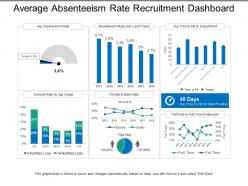 Average absenteeism rate recruitment dashboard
Presenting this set of slides with name - Average Absenteeism Rate Recruitment Dashboard. This is a six stage process. The stages in this process are Staffing Plan, Recruitment, Staff Management.
-
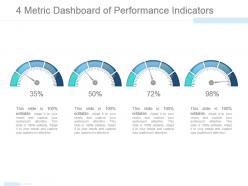 4 metric dashboard of performance indicators example of ppt
Presenting 4 metric dashboard of performance indicators example of ppt. This is a 4 metric dashboard of performance indicators example of ppt. This is a four stage process. The stages in this process are dashboard, finance, percentage, business, marketing.
-
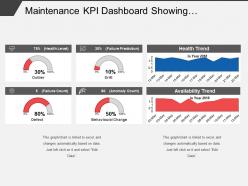 Maintenance kpi dashboard showing preventive maintenance
Presenting this set of slides with name - Maintenance Kpi Dashboard Showing Preventive Maintenance. This is a six stage process. The stages in this process are Maintenance, Preservation, Conservation.
-
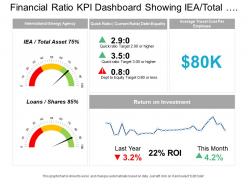 Financial ratio kpi dashboard showing iea total assets and return on investment
Presenting this set of slides with name - Financial Ratio Kpi Dashboard Showing Iea Total Assets And Return On Investment. This is a three stage process. The stages in this process are Accounting Ratio, Financial Statement, Financial Ratio.
-
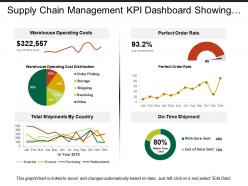 Supply chain management kpi dashboard showing warehouse operating costs
Presenting predesigned Supply Chain Management KPI Dashboard Showing Warehouse Operating Costs PPT slide. Download of the template design is simple. You can modify the layout font type, font size, colors and the background as per needs. Template slide is fully flexible with Google Slides and other online software’s. You can alter the design using the instructional slides provided with the template. You can remove the watermark with your brand name, trademark, signature or logo. You can save the template into PNG or JPEG formats. Supreme quality layouts are used to create this template which is editable in PowerPoint. Sample content can be replaced with your presentation content.
-
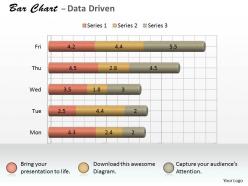 Data driven 3d bar chart as research tool powerpoint slides
We are proud to present our data driven 3d bar chart as research tool powerpoint slides. Bar charts compare distinct items or show single items at distinct intervals.This PPT diagram is one of the easiest ways to compare numbers. Make your presenations more interesting than just talk or print
-
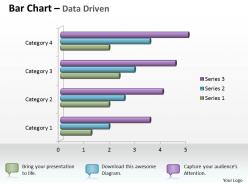 Data driven 3d bar chart for business statistics powerpoint slides
We are proud to present our data driven 3d bar chart for business statistics powerpoint slides. This Professionally designed PowerPoint template shows bar chart for business statistics. Using visual representations to present data and evaluation of activities makes audience easier to understand.
-
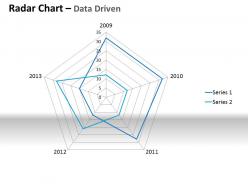 Data driven plotting the business values powerpoint slides
We are proud to present our data driven plotting the business values powerpoint slides. This Radar chart is a very effective tool for comparing multiple entities based on different characteristics. This unique image makes your presentations professional and interactive. Deliver amazing presentations to mesmerize your audience.
-
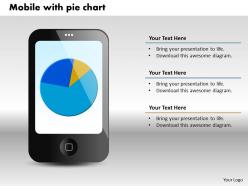 0414 mobile display business pie chart powerpoint graph
They are prodigiously devised PPT template expounding about the significance of Pie chart in business. All the features like verse, themes, figures etc. of these Presentation designs are totally amendable. They are also quite feasible for business experts, management scholars and professionals etc. These Presentation graphics can be easily adaptable with the Google slides and other software’s. They are also easily exportable into PDF or JPG file formats.
-
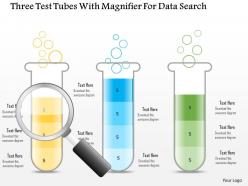 1214 three test tubes with magnifier for data search powerpoint slide
We are proud to present our 1214 three test tubes with magnifier for data search powerpoint slide. Three test tubes and magnifier are used to craft this power point template slide. This PPT slide contains the concept of data search. This PPT slide can be used for data related presentation.
-
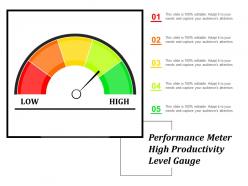 Performance meter high productivity level gauge
Presenting, the performance meter PowerPoint Presentation Slide. This Presentation has been designed professionally and is fully editable. You can customize the font size, font type, colors, and even the background. This Template is obedient with Google Slide and can be saved in JPG or PDF format without any hassle. Fast download at the click of the button.
-
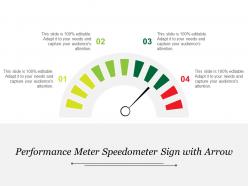 Performance meter speedometer sign with arrow
This highly versatile, innovative design is completely editable; you can modify the design the way you want. Slides are fully compatible with Google Slides and MS PowerPoint software. Instant and quick downloading available; you can save the design into your system into various formats such as JPEG or PDF. Both standard and wide screen view are available; no effect on design quality when opened on wide screen view.
-
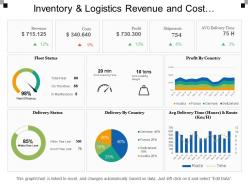 Inventory and logistics revenue and cost dashboards
Presenting this set of slides with name - Inventory And Logistics Revenue And Cost Dashboards. This is a three stage process. The stages in this process are Inventory And Logistics, Inventory Management, Warehousing And Inventory Management.
-
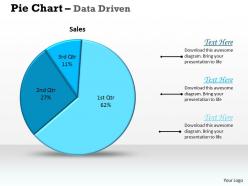 Data driven pie chart for sales process powerpoint slides
We are proud to present our data driven pie chart for sales process powerpoint slides. This PowerPoint diagram can be used to compare sets of business data. You can see entire business processes at a glance using this diagram. You can clarify what works and what doesnt in your teams task and information flow, analyze problems, and identify areas for improvement
-
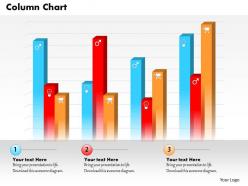 0514 data driven sales and marketing chart powerpoint slides
We are proud to present our 0514 data driven sales and marketing chart powerpoint slides. Data driven sales and marketing concept and analysis is can be display with our unique Business Power Point template. Get good remarks on your efforts of making presentations.
-
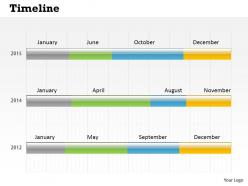 0514 three way chart data driven time line diagram powerpoint slides
Can be used by teachers, marketing professionals, hospital staff, managers, industries and NGO’s. PPT icon is easy for proofing and editing. PowerPoint presentation is compatible with Microsoft 2010 and 2013 versions. Can be viewed in 4: 3 standard screen size or 16:9 wide screen size. All images are 100% editable in the presentation slide.
-
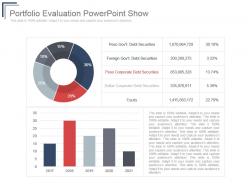 Portfolio evaluation powerpoint show
Presenting portfolio evaluation powerpoint show. This is a portfolio evaluation powerpoint show. This is a two stage process. The stages in this process are peso govt debt securities, foreign govt debt securities, peso corporate debt securities, dollar corporate debt securities, equity.
-
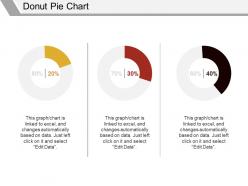 Donut pie chart powerpoint presentation
Presenting Donut Pie Chart Powerpoint Presentation PowerPoint slide. You can change the color, font size, font type and shapes of this PPT layout according to your needs. This PPT template is compatible with Google Slides and is available in both 4:3 and 16:9 aspect ratios. This ready to use PowerPoint presentation can be downloaded in various formats like PDF, JPG and PNG.
-
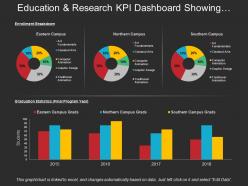 Education and research kpi dashboard snapshot showing enrolment breakdown
Presenting education and research KPI dashboard snapshot showing enrolment breakdown PPT slide. The student enrolment dashboard PowerPoint slide designed by the professional team of SlideTeam. The enrolment page KPI report template is fully editable in PowerPoint. The research enrolment KPI report PPT template is compatible with Google Slide so a user can share this enrolment dashboard slide with others. A user can make changes in the font size, font type, color as well as dimensions of the campus and college dashboard slide as per the requirement. You may edit the value in the enrollment reporting system dashboard template as the slide gets linked with the Excel sheet.
-
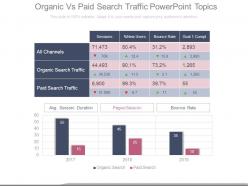 Organic vs paid search traffic powerpoint topics
Presenting organic vs paid search traffic powerpoint topics. This is a organic vs paid search traffic powerpoint topics. This is a four stage process. The stages in this process are all channels, organic search traffic, paid search traffic, sessions, new users, bounce rate, avg session duration, pages session, bounce rate.
-
 Employees who leave within first 6 months powerpoint shapes
Presenting employees who leave within first 6 months powerpoint shapes. This is a employees who leave within first 6 months powerpoint shapes. This is a three stage process. The stages in this process are employees left job within the first 6 months, felt their boss was a jerk, work was different than they expected, changed their mind on work type.
-
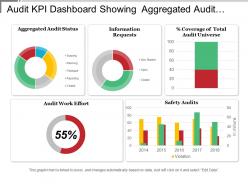 Audit kpi dashboard showing aggregated audit status and audit work effort
Presenting this set of slides with name - Audit Kpi Dashboard Showing Aggregated Audit Status And Audit Work Effort. This is a five stage process. The stages in this process are Audit, Examine, Survey.
-
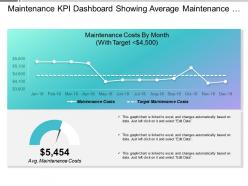 Maintenance kpi dashboard showing average maintenance costs
Presenting this set of slides with name - Maintenance Kpi Dashboard Showing Average Maintenance Costs. This is a one stage process. The stages in this process are Maintenance, Preservation, Conservation.
-
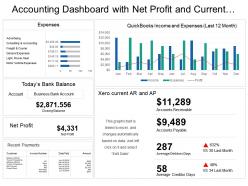 Accounting dashboard with net profit and current accounts payable
Presenting accounting dashboard with net profit and current accounts payable PPT slideshow. Makes the information clear in the mind of the audience. Editable visuals, colors and charts. Easy to edit and customize as per your needs. Beneficial for industry professionals, technologists, managers, executives, researchers, sales people, etc. Flexible presentation designs can be presented in standard and widescreen view. Privilege of insertion of logo and trademarks for more personalization. Easy to download and save. Highly beneficial PowerPoint Slide for highlighting financial data.
-
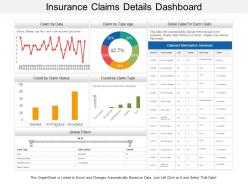 Insurance claims details dashboard
Presenting this set of slides with name - Insurance Claims Details Dashboard. This is a three stage process. The stages in this process are Assurance, Surety, Insurance.
-
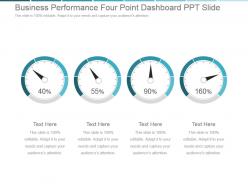 Business performance four point dashboard snapshot ppt slide
Presenting business performance four point dashboard snapshot ppt slide. This is a business performance four point dashboard ppt slide. This is a four stage process. The stages in this process are business, success, dashboard, finance, strategy.
-
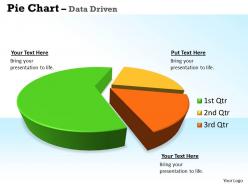 Data driven 3d pie chart for business statistics powerpoint slides
We are proud to present our data driven 3d pie chart for business statistics powerpoint slides. Put The Wind In Your Sails With Our Data Driven 3D Pie Chart For Business Statistics Powerpoint Slides Power Point Templates. Skim Smoothly Over The Choppy Waters Of The Market. Let Our Data Driven 3D Pie Chart For Business Statistics Powerpoint Slides Power Point Templates Give The Updraft To Your Ideas. See Them Soar To Great Heights With Ease.
-
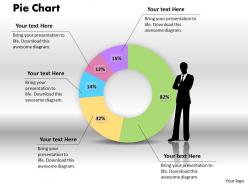 0414 human character with pie chart powerpoint graph
Extremely useful presentation tool to enhance the performance of your presentations. Does not make the information look messed up. Summarises large data set in a visually appealing way. Well matched framework with Google Slides. Allows changing the formats into JPG and PDF. Equipped with high-resolution pie chart which can even be viewed in big screens without compromising the quality.
-
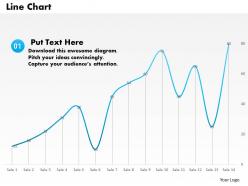 0514 3d linear growth for business powerpoint slides
Pixel-friendly images and graphics in the icons. No effect on picture quality when used on a wide screen display. Attune well with the major online and offline softwares. Allow instant customization of the slide icons and the graphics. Provided instructions to customize the content and the slide icons. 100% editable slide icons. Useful for the business entrepreneurs and the marketing individuals.
-
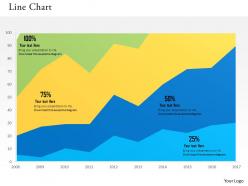 0514 data driven 3d line chart graphic powerpoint slides
We are proud to present our 0514 data driven 3d line chart graphic powerpoint slides. This Business Power Point template is designed with data driven line chart to highlight the result in any business presentation.
-
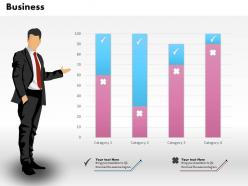 0514 data driven business bar graph business chart powerpoint slides
Use of Pixel friendly icons and the graphics. Allow to edit the style, background and the color of PowerPoint slides after downloading. Trouble free insertion of trademark or company logo. Save it in the JPG or PDF format. Easy to enter the data and the information in the slides. Useful for the Business leaders, employees, Human Resource department and the managers.
-
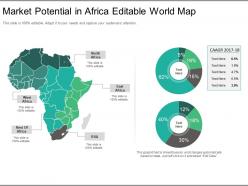 Market potential in africa editable world map ppt model
Presenting market potential in africa editable world map ppt model. This is a market potential in africa editable world map ppt model. This is a three stage process. The stages in this process are north africa, east africa, rsa, rest of africa, west africa.
-
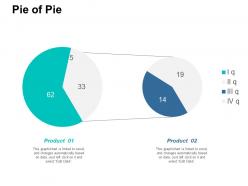 Pie of pie ppt summary background designs
Presenting this set of slides with name - Pie Of Pie Ppt Summary Background Designs. This is a two stage process. The stages in this process are Percentage, Product, Business, Management, Marketing.
-
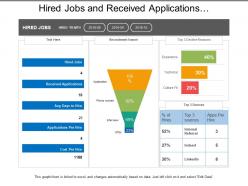 Hired jobs and received applications recruitment dashboard
Presenting this set of slides with name - Hired Jobs And Received Applications Recruitment Dashboard. This is a three stage process. The stages in this process are Staffing Plan, Recruitment, Staff Management.
-
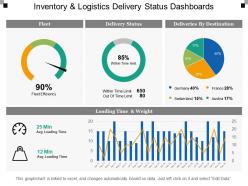 Inventory and logistics delivery status dashboards
Presenting this set of slides with name - Inventory And Logistics Delivery Status Dashboards. This is a four stage process. The stages in this process are Inventory And Logistics, Inventory Management, Warehousing And Inventory Management.
-
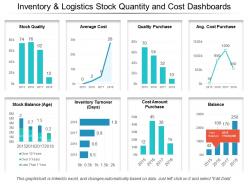 Inventory and logistics stock quantity and cost dashboards
Presenting this set of slides with name - Inventory And Logistics Stock Quantity And Cost Dashboards. This is a four stage process. The stages in this process are Inventory And Logistics, Inventory Management, Warehousing And Inventory Management.
-
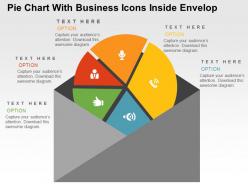 Pie chart with business icons inside envelop powerpoint slides
Pie chart with business icons inside envelop PPT Slide. Easy to use and edit. Colors, icons and layout can be easily changed as the PPT slide is completely editable. Simply click to add company logo, trademark or name. This PPT Slide is available in both Standard and Widescreen slide size. Quick and easy downloadable process. Flexible option for conversion in PDF or JPG formats. Can use with Google slides.
-
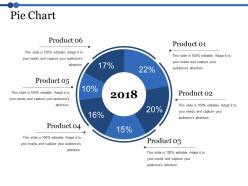 Pie chart ppt backgrounds
Pie Chart PPT Backgrounds PowerPoint template- a well-designed pie chart slide for visual presentation of data. This versatile PPT slide has both the standard as well as the wide-screen version available. You can easily choose from a variety of fonts, color schemes, images, and orientations on the PowerPoint interface to customize this PPT slide for your needs. This PPT model is compatible with Google Slides as well as Microsoft PowerPoint.
-
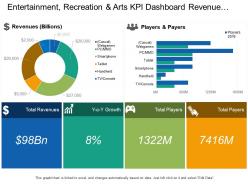 Entertainment recreation and arts kpi dashboard revenue players and payers
Presenting this set of slides with name - Entertainment Recreation And Arts Kpi Dashboard Revenue Players And Payers. This is a four stage process. The stages in this process are Entertainment, Recreation And Arts, Attractions, Culture, Entertainment.
-
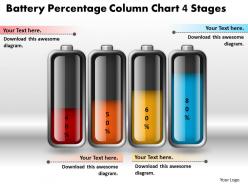 0414 battery percentage column chart 4 stages powerpoint graph
Businessmen, micro, small and medium enterprises can use the PPT layout to read and mark their performance in visual manner. PowerPoint presentation ensures different colored background from the text. Art graphic and color scheme used is 100% editable in the presentation slide. Compatible with Google slides. There is no space constrain in the PowerPoint design and can be edited in user oriented manner.
-
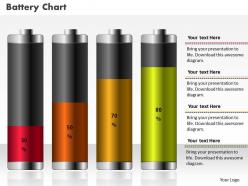 0414 percentage increase in battery column chart powerpoint graph
Useful for professionals working in corporates and college going students studying finance. Easily convertible into JPEG and PDF. High resolution graphics will not pixilate on bigger or wider screen. Customisable PPT layout in terms of orientation, design, color and text. Add titles and sub-titles as it has ample space. Compatible with Google slides and runs with all softwares. Company’s name, logo and trademark can be added conveniently. Easy to download due to small size.
-
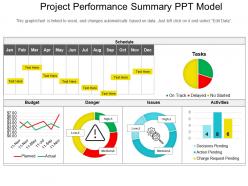 Project performance summary ppt model
Presenting a PPT template named Project performance Summary PPT Model. It is a professionally designed template with relevant visuals and subject driven content. Get easy access to the customizable slide which is linked with the Excel sheet. You can edit the colour, text and font size as per your need. You can add or delete the content if required. The slide is compatible with Google Slides and can be exported in both PDF as well as JPG formats. You can avail this PPT slide both in standard as well as widescreen size.
-
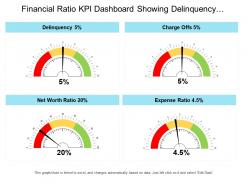 Financial ratio kpi dashboard snapshot showing delinquency charge offs and net worth ratio
Presenting this set of slides with name - Financial Ratio Kpi Dashboard Snapshot Showing Delinquency Charge Offs And Net Worth Ratio. This is a four stage process. The stages in this process are Accounting Ratio, Financial Statement, Financial Ratio.
-
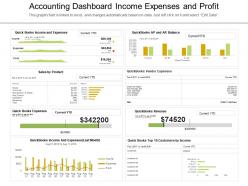 Accounting dashboard income expenses and profit
Presenting this set of slides with name - Accounting Dashboard Income Expenses And Profit. This is a six stage process. The stages in this process are Accounting, Bookkeeping, Auditing, Finance.


