- Sub Categories
-
 Government and public works kpi dashboard showing service request count and time to close
Presenting this set of slides with name - Government And Public Works Kpi Dashboard Showing Service Request Count And Time To Close. This is a five stage process. The stages in this process are Government And Public Works, Government And Public Tasks.
-
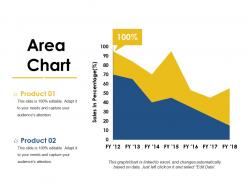 Area chart powerpoint ideas
Presenting this set of slides with name - Area Chart Powerpoint Ideas. This is two a stage process. The stages in this process are Area Chart, Finance, Analysis, Sales, Business.
-
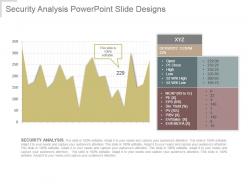 Security analysis powerpoint slide designs
Presenting security analysis powerpoint slide designs. This is a security analysis powerpoint slide designs. This is a one stage process. The stages in this process are open, pt close, high, low.
-
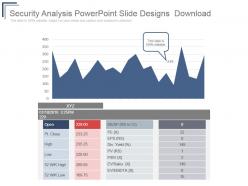 Security analysis powerpoint slide designs download
Presenting security analysis powerpoint slide designs download. This is a security analysis powerpoint slide designs download. This is a two stage process. The stages in this process are success, business, marketing, presentation, management.
-
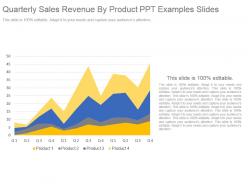 Quarterly sales revenue by product ppt examples slides
Presenting quarterly sales revenue by product ppt examples slides. This is a quarterly sales revenue by product ppt examples slides. This is a four stage process. The stages in this process are product.
-
 Marketing analytics kpis powerpoint slide designs
Presenting the slide named Marketing Analytics KPIs PowerPoint Slide Designs. This template with high-quality graphics is professionally designed. With an option to change the size, style, and color of the font, this slide is editable. You can customize the text and color of the diagram as well as the background as per your discretion. The slide is compatible with Google Slides, which make it easily accessible. This PPT slide is excel-linked. You can customize and save the file as JPG or PDF.
-
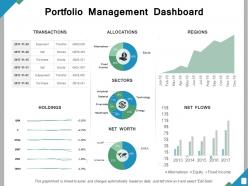 Portfolio management dashboard ppt powerpoint presentation file guide
Presenting this set of slides with name - Portfolio Management Dashboard Ppt Powerpoint Presentation File Guide. This is a five stage process. The stages in this process are Percentage, Product, Management, Marketing, Business.
-
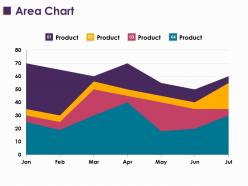 Area chart ppt layouts ideas
Presenting this set of slides with name - Area Chart Ppt Layouts Ideas. This is a four stage process. The stages in this process are Business, Management, Strategy, Analysis, Marketing.
-
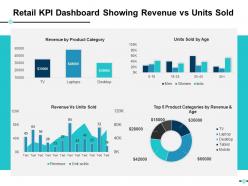 Retail kpi dashboard showing revenue vs units sold ppt slides example file
Presenting this set of slides with name - Retail Kpi Dashboard Showing Revenue Vs Units Sold Ppt Slides Example File. This is a four stage process. The stages in this process are Business, Management, Strategy, Analysis, Marketing.
-
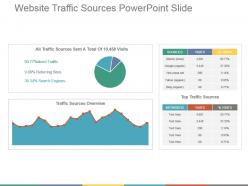 Website traffic sources powerpoint slide
Presenting website traffic sources powerpoint slide. This is a website traffic sources powerpoint slide. This is a two stage process. The stages in this process are direct traffic, referring sites, search engines.
-
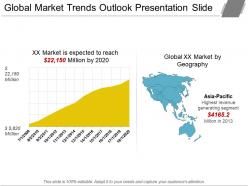 Global market trends outlook presentation slide
Presenting global market trends outlook presentation slide. This is a global market trends outlook presentation slide. This is a two stage process. The stages in this process are global market by geography, asia pacific, highest revenue generating segment.
-
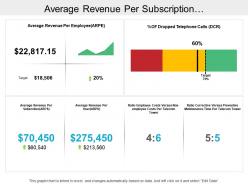 Average revenue per subscription telecommunications dashboard
Presenting this set of slides with name - Average Revenue Per Subscription Telecommunications Dashboard. High quality pixels used in the PowerPoint design and ensures no pixilation when projected on both standard and wide screen display. Easily downloadable and save PPT slide. Presentation template can be projected in JPG and PDF format. Entirely editable as color, text and font can be edited. PPT design can form an integral part of multiple business topics presentation. Matching designs comes with different nodes and stages. Presentation diagram works well with Google slides.
-
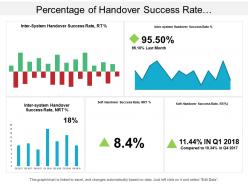 Percentage of handover success rate telecommunications dashboard
Presentation slide has eye-catching and engaging quality. PPT template is familiar with Google slides. Easy to download and saves a lot of time. PowerPoint design is quick to download and easy to share. Decorate it by adding corporation designation and image. Presentation graphic provides adjustment in text, color and design. Presentation is easy to showcase in both standard and widescreen view. Resolution PowerPoint design with great picture quality. Design compatible with other softwares.
-
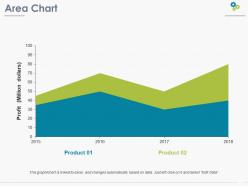 Area chart ppt pictures background images
Presenting this set of slides with name - Area Chart Ppt Pictures Background Images. This is a two stage process. The stages in this process are Profit, Area Chart, Years, Business, Marketing.
-
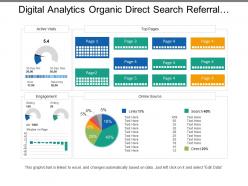 Digital analytics organic direct search referral social ppt example
Presenting this set of slides with name - Digital Analytics Organic Direct Search Referral Social Ppt Example. This is a five stage process. The stages in this process are Digital Analytics, Digital Dashboard, Digital Kpis.
-
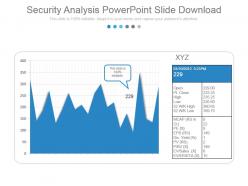 Security analysis powerpoint slide download
Presenting security analysis powerpoint slide download. This is a security analysis powerpoint slide download. This is a one stage process. The stages in this process are open, port close, high, low.
-
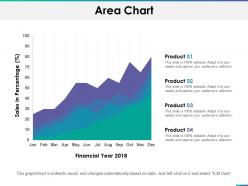 Area chart ppt summary tips
Presenting this set of slides with name - Area Chart Ppt Summary Tips. This is a four stage process. The stages in this process are Business, Management, Strategy, Analysis, Marketing.
-
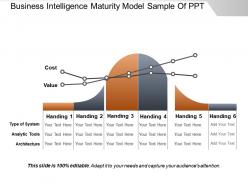 Business intelligence maturity model sample of ppt
Presenting business intelligence maturity model sample of PPT design. PPT can be downloaded and converted into JPEG and PDF formats. You can view the slideshow on normal and full screen design previews. The biggest advantage of downloading this PPT design is that it is fully editable. You can change the font type, color, size, shape, background according to your business preferences. PPT is compatible with multiple software e.g. Google Slides and Microsoft PowerPoint.
-
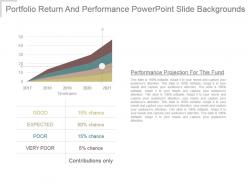 Portfolio return and performance powerpoint slide backgrounds
Presenting portfolio return and performance powerpoint slide backgrounds. This is a portfolio return and performance powerpoint slide backgrounds. This is a four stage process. The stages in this process are good, expected, poor, very poor, contributions only.
-
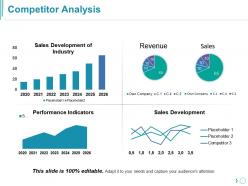 Competitor analysis presentation images
Presenting this set of slides with name - Competitor Analysis Presentation Images. This is a four stage process. The stages in this process are Competitor Analysis, Finance, Compare, Strategy, Analysis, Business.
-
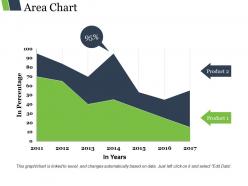 Area chart ppt design
Presenting area chart ppt design. This is a area chart ppt design. This is a two stage process. The stages in this process are product, in years, in percentage, percentage, finance.
-
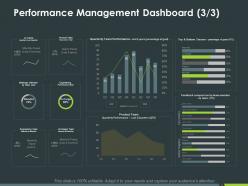 Performance management dashboard analysis ppt powerpoint presentation inspiration example
Presenting this set of slides with name - Performance Management Dashboard Analysis Ppt Powerpoint Presentation Inspiration Example. This is a seven stages process. The stages in this process are Finance, Marketing, Management, Investment, Analysis.
-
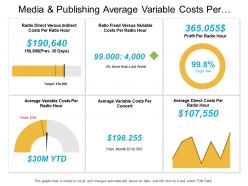 Media and publishing average variable costs per concert dashboard
Presenting this set of slides with name - Media And Publishing Average Variable Costs Per Concert Dashboard. This is a six stage process. The stages in this process are Media And Publishing, Media Communication.
-
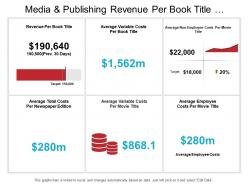 Media and publishing revenue per book title dashboard
Presenting this set of slides with name - Media And Publishing Revenue Per Book Title Dashboard. This is a six stage process. The stages in this process are Media And Publishing, Media Communication.
-
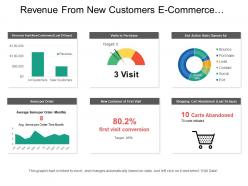 Revenue from new customers e commerce dashboard
Presenting this set of slides with name - Revenue From New Customers E Commerce Dashboard. This is a six stage process. The stages in this process are Mercantilism, Commercialism, Ecommerce.
-
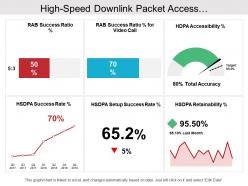 High speed downlink packet access telecommunications dashboard
Presenting this set of slides with name - High Speed Downlink Packet Access Telecommunications Dashboard. Innovative PowerPoint slide as it is accessible with different nodes and stages. Presentation template can display in standard and widescreen view. Amendable PPT design as color, text and shape can be edited. Downloading is rapid and easy to share even with large audience. PowerPoint graphic works well with Google slide. Variable design can be changed into JPEG and PDF document. Preference to amend and add business details at any stage before delivering.
-
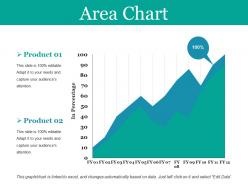 Area chart ppt summary
Presenting this set of slides with name - Area Chart Ppt Summary. This is a two stage process. The stages in this process are Area Chart, Finance, Analysis, Business, Management.
-
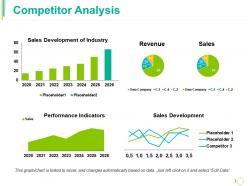 Competitor analysis ppt guide
Presenting this set of slides with name - Competitor Analysis Ppt Guide. This is a four stage process. The stages in this process are Development Of Industry, Revenue, Sales, Sales Development, Performance Indicators.
-
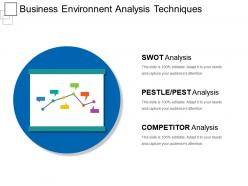 Business environment analysis techniques powerpoint graphics
Presenting business environment analysis techniques PowerPoint graphics PPT slide. You can download this infographic business environment template and save it into JPEG format or PDF format. Get this fully customizable slide in which you can change anything as per your wants. This can be downloaded in 2 screen sizes i.e. standard screen and widescreen. Its high resolution graphics do not pixelate when viewed on widescreen. Add the related data in text placeholder and customize it in the way you like.
-
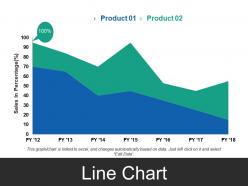 Line chart ppt images template 2
Presenting line chart ppt images template 2. This is a line chart ppt images template 2. This is a two stage process. The stages in this process are product, sales in percentage, area chart, percentage, financial.
-
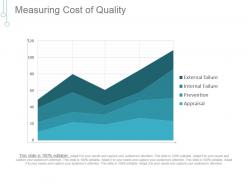 Measuring cost of quality ppt background template
Presenting measuring cost of quality ppt background template. This is a measuring cost of quality ppt background template. This is a four stage process. The stages in this process are external failure, internal failure, prevention, appraisal.
-
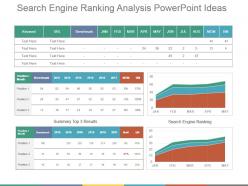 Search engine ranking analysis powerpoint ideas
Presenting search engine ranking analysis powerpoint ideas. This is a search engine ranking analysis powerpoint ideas. This is a three stage process. The stages in this process are business, management, analysis, strategy, success.
-
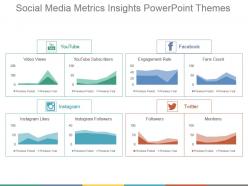 Social media metrics insights powerpoint themes
Presenting to you the social media metrics PowerPoint template. This slide is fully customizable PowerPoint template to communicate your ideas clearly. You can easily edit the charts and graphs in excel sheet. This presentation slide is designed with elegant shapes and visuals. You can convert this slide into numerous format options like JPEG, JPG or PDF. This template gives a professional outlook to your PowerPoint presentation. It is easy to customize each graphics and text as per your need. You can download it easily at a click of button.
-
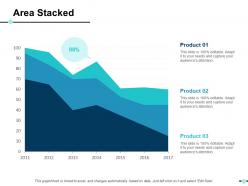 Area stacked ppt show microsoft
Presenting this set of slides with name - Area Stacked Ppt Show Microsoft. This is a three stage process. The stages in this process are Business, Management, Strategy, Analysis, Marketing.
-
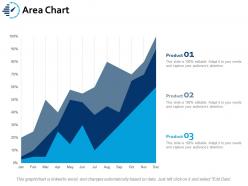 Area chart ppt portfolio examples
Presenting this set of slides with name - Area Chart Ppt Portfolio Examples. This is a three stage process. The stages in this process are Business, Management, Strategy, Sales, Marketing.
-
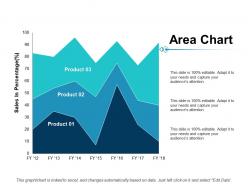 Area chart ppt inspiration professional
Presenting this set of slides with name - Area Chart Ppt Inspiration Professional. This is a three stage process. The stages in this process are Business, Management, Strategy, Analysis, Marketing.
-
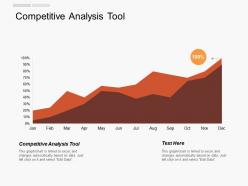 Competitive analysis tool ppt powerpoint presentation layouts professional cpb
Presenting this set of slides with name - Competitive Analysis Tool Ppt Powerpoint Presentation Layouts Professional Cpb. This is an editable two stages graphic that deals with topics like Competitive Analysis Tool to help convey your message better graphically. This product is a premium product available for immediate download, and is 100 percent editable in Powerpoint. Download this now and use it in your presentations to impress your audience.
-
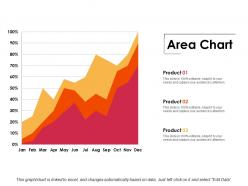 Area chart ppt professional tips
Presenting this set of slides with name - Area Chart Ppt Professional Tips. This is a three stage process. The stages in this process are Business, Management, Strategy, Analysis, Marketing.
-
 Area chart finance marketing ppt powerpoint presentation styles diagrams
Presenting this set of slides with name - Area Chart Finance Marketing Ppt Powerpoint Presentation Styles Diagrams. This is a three stages process. The Stages in this process are Area Chart, Finance, Marketing, Management, Business.
-
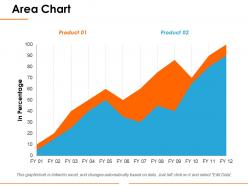 Area chart ppt microsoft
Presenting this set of slides with name - Area Chart Ppt Microsoft. This is a two stage process. The stages in this process are Area Chart, In Percentage, Business, Marketing, Finance.
-
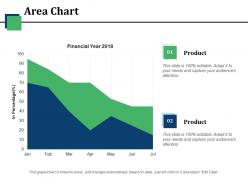 Area chart ppt visual aids
Presenting this set of slides with name - Area Chart Ppt Visual Aids. This is a two stage process. The stages in this process are Financial Year, In Percentage, Business, Marketing, Strategy.
-
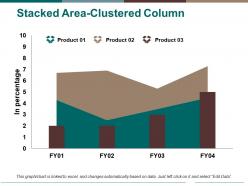 Stacked area clustered column ppt pictures graphics design
Presenting stacked area clustered column PPT pictures graphics design PPT slide. The area clustered infographic PowerPoint template designed professionally by the team of SlideTeam to describe different business statistics, for example, production volume and sales, across several periods. The infographic area clustered slide represents value and that gets edited as a user can link this slide with the Excel. The area graphic picture design slide is customizable in PowerPoint as well as compatible with Google Slide. A user can edit the area clustered design slide such as font size, font type, color and dimensions to show the desired comparison among three products.
-
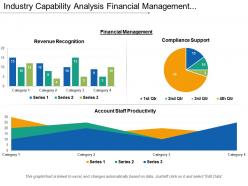 Industry capability analysis financial management manufacturing sales marketing it 1
Presenting this set of slides with name - Industry Capability Analysis Financial Management Manufacturing Sales Marketing It 1. This is a three stage process. The stages in this process are Industry Capability Analysis, Industry Potential Analysis, Industry Competency Analysis.
-
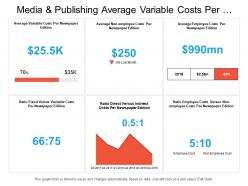 Media and publishing average variable costs per edition dashboard
Presenting this set of slides with name - Media And Publishing Average Variable Costs Per Edition Dashboard. This is a six stage process. The stages in this process are Media And Publishing, Media Communication.
-
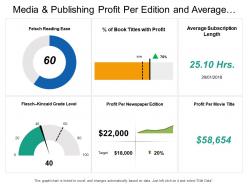 Media and publishing profit per edition and average subscription dashboard
Presenting this set of slides with name - Media And Publishing Profit Per Edition And Average Subscription Dashboard. This is a six stage process. The stages in this process are Media And Publishing, Media Communication.
-
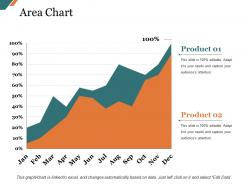 Area chart presentation visuals
Presenting this set of slides with name - Area Chart Presentation Visuals. This is a two stage process. The stages in this process are Business, Marketing, Chart, Finance, Planning.
-
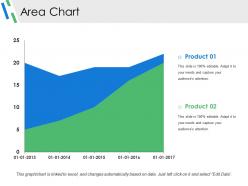 Area chart ppt slide templates
Presenting this set of slides with name - Area Chart Ppt Slide Templates. This is a two stage process. The stages in this process are Business, Marketing, Strategy, Finance, Planning.
-
 Competitor analysis ppt images gallery
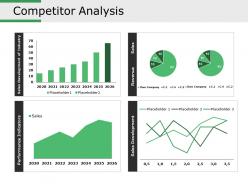
Presenting this set of slides with name - Competitor Analysis Ppt Images Gallery. This is a four stage process. The stages in this process are Business, Finance, Marketing, Strategy, Analysis.
-
 Area chart ppt icon
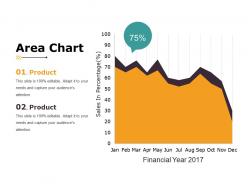
Presenting Area Chart PPT Icon template. The slide is extremely easy to download and can be saved in the popular image or document formats such as JPEG and PDF. The slideshow supports both the standard and widescreen sizes. It is having compatibility with Google Slides and other office suites. Alter the style, size, and the background of the slides. High-quality graphics ensure that pixelation does not occur.
-
 Stacked area clustered column
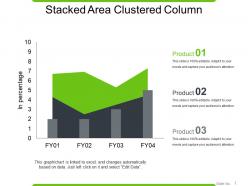
Presenting stacked area clustered column. This is a stacked area clustered column. This is a three stage process. The stages in this process are stacked area, growth, finance, marketing, strategy, business.
-
 Area chart finance ppt powerpoint presentation layouts visual aids
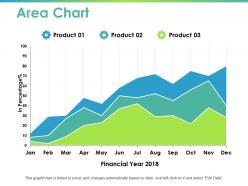
Presenting this set of slides with name - Area Chart Finance Ppt Powerpoint Presentation Layouts Visual Aids. This is a three stages process. The stages in this process are Finance, Marketing, Management, Investment, Analysis.
-
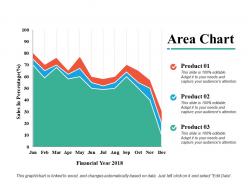 Area chart ppt powerpoint presentation diagram images
Presenting this set of slides with name - Area Chart Ppt Powerpoint Presentation Diagram Images. This is a three stage process. The stages in this process are Percentage, Product, Management, Marketing, Business.
-
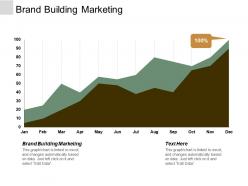 Brand building marketing ppt powerpoint presentation file graphic images cpb
Presenting this set of slides with name - Brand Building Marketing Ppt Powerpoint Presentation File Graphic Images Cpb. This is an editable two stages graphic that deals with topics like Brand Building Marketing to help convey your message better graphically. This product is a premium product available for immediate download, and is 100 percent editable in Powerpoint. Download this now and use it in your presentations to impress your audience.
-
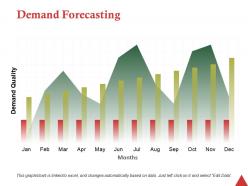 Demand forecasting ppt professional visuals
Presenting this set of slides with name - Demand Forecasting Ppt Professional Visuals. This is a three stage process. The stages in this process are Business, Management, Strategy, Analysis, Marketing.
-
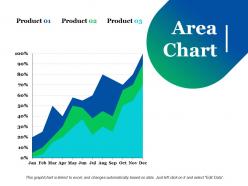 Area chart ppt pictures graphics
Presenting this set of slides with name - Area Chart Ppt Pictures Graphics. This is a three stage process. The stages in this process are Business, Management, Strategy, Analysis, Marketing.
-
 Area chart ppt slides clipart images
Presenting this set of slides with name - Area Chart Ppt Slides Clipart Images. This is a two stage process. The stages in this process are Area Chart, Marketing, Strategy, Planning, Finance.
-
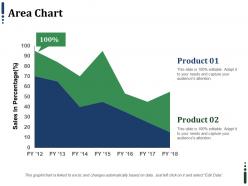 Area chart ppt infographics objects
Presenting the flat mountain design PowerPoint template. This creative PowerPoint template is designed under the strict supervision of professionals and is 100% customizable in PowerPoint. It is easy to edit the objects like font color and font size in this slide and save it in JPG or PDF file format. This template is fully compatible with Google Slide. Click on the download button to download this PPT template.
-
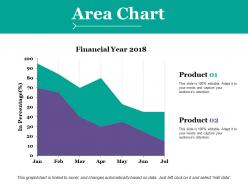 Area chart ppt outline layout
Presenting area chart PPT outline layout. Brilliant picture quality as pixels doesn’t break on both standard and widescreen view. Presentation slide is accepted with Google slides and can be merged as required. PowerPoint design comes with access to modify the content with enterprise details. Similar designs are accessible with different nodes and stages as required. Rapid download and can be delivered into other software formats such as JPG and PDF.
-
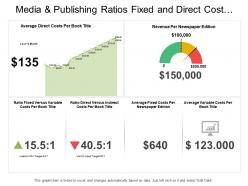 Media and publishing ratios fixed and direct cost dashboard
Presenting this set of slides with name - Media And Publishing Ratios Fixed And Direct Cost Dashboard. This is a two stage process. The stages in this process are Media And Publishing, Media Communication.
-
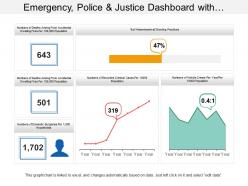 Emergency police and justice dashboard with absenteeism at shooting practice
Presenting this set of slides with name - Emergency Police And Justice Dashboard With Absenteeism At Shooting Practice. This is a four stage process. The stages in this process are Emergency, Police And Justice, Police And Emergency Services, Justice And Public Security.


