- Sub Categories
-
 School enrollment by level of school by type of school for population 3 years over for male us year 2017
Presenting this set of slides with name - School Enrollment By Level Of School By Type Of School For Population 3 Years Over For Male US Year 2017. School Enrollment By Level Of School By Type Of School For The Population 3 Years And Over For Male In The U.S For The Year 2017. This is part of our Data and Statistics products selection, and you will need a Paid account to download the actual report with accurate data. Downloaded report will contain the actual editable graph with the actual data, an excel table with the actual data, the exact source of the data and the release date. This graph shows school enrollment by level and type of school of male enrolled with different education levels for population 3 years and over in the U.S for the year 2017. It covers topic School Enrollment by School Type for male for region USA and is for date range 2017. Download it immediately and use it for your business.
-
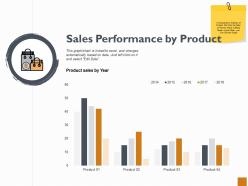 Sales performance by product analysis ppt powerpoint presentation outline styles
Presenting this set of slides with name - Sales Performance By Product Analysis Ppt Powerpoint Presentation Outline Styles. This is a four stages process. The stages in this process are Finance, Marketing, Management, Investment, Analysis.
-
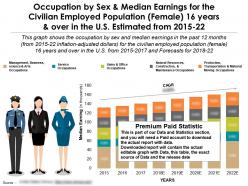 Occupation by median earnings sex for civilian female 16 years over in us estimated 2015-22
Presenting this set of slides with name - Occupation By Median Earnings Sex For Civilian Female 16 Years Over In US Estimated 2015-22. Occupation By Sex And Median Earnings For The Civilian Employed Population Female 16 Years And Over In The U.S Estimated From 2015 to 22. This is part of our Data and Statistics products selection, and you will need a Paid account to download the actual report with accurate data. Downloaded report will contain the actual editable graph with the actual data, an excel table with the actual data, the exact source of the data and the release date. This graph shows the occupation by sex and median earnings in the past 12 months from 2015 to 22 inflation adjusted dollars for the civilian employed population 16 years and over in the U.S from 2015 to 2017 and Forecasts for 2018 to 22. It covers topic Occupation by sex and median earnings for civilian employed females for region USA and is for date range 2015 to 22. Download it immediately and use it for your business.
-
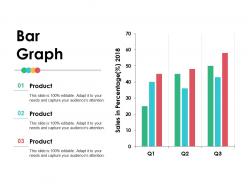 Bar graph ppt infographic template gallery
Presenting this set of slides with name - Bar Graph Ppt Infographic Template Gallery. This is a three stage process. The stages in this process are Business, Management, Strategy, Analysis, Icons.
-
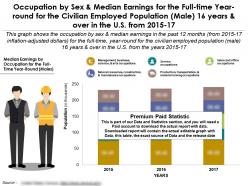 Occupation by sex median earnings full time year round civilian employed population male 16 years in us 2015-17
Presenting this set of slides with name - Occupation By Sex Median Earnings Full Time Year Round Civilian Employed Population Male 16 Years In US 2015-17. Occupation By Sex And Median Earnings For The Full Time Year Round For The Civilian Employed Population Male 16 Years And Over In The U.S From 2015 TO 17. This is part of our Data and Statistics products selection, and you will need a Paid account to download the actual report with accurate data. Downloaded report will contain the actual editable graph with the actual data, an excel table with the actual data, the exact source of the data and the release date. This graph shows the occupation by sex and median earnings in the past 12 months from 2015 TO 17 inflation adjusted dollars for the full time year round for the civilian employed population 16 years and over in the U.S from the years 2015 TO 17. It covers topic Occupation by median earnings for full time year round civilian employed males for region USA and is for date range 2015 TO 17. Download it immediately and use it for your business.
-
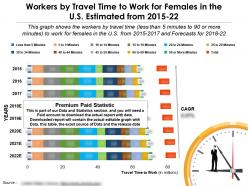 Workers by travel time to work for females in the us estimated 2015-22
Presenting this set of slides with name - Workers By Travel Time To Work For Females In The US Estimated 2015-22. Workers By Travel Time To Work For Females In The U.S Estimated From 2015 to 22. This is part of our Data and Statistics products selection, and you will need a Paid account to download the actual report with accurate data. Downloaded report will contain the actual editable graph with the actual data, an excel table with the actual data, the exact source of the data and the release date. This graph shows the workers by travel time less than 5 minutes to 90 or more minutes to work for females in the U.S from 2015 to 2017 and Forecasts for 2018 to 22. It covers topic Workers by travel time to work for females for region USA and is for date range 2015 to 22. Download it immediately and use it for your business.
-
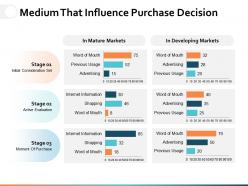 Medium that influence purchase decision ppt powerpoint presentation file master slide
Presenting this set of slides with name - Medium That Influence Purchase Decision Ppt Powerpoint Presentation File Master Slide. This is a three stage process. The stages in this process are Percentage, Product, Business, Management, Marketing.
-
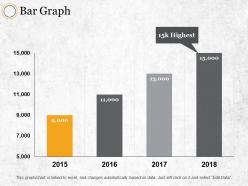 Bar graph ppt summary graphics download
Presenting this set of slides with name - Bar Graph Ppt Summary Graphics Download. This is a four stage process. The stages in this process are Percentage, Product, Management, Marketing, Business.
-
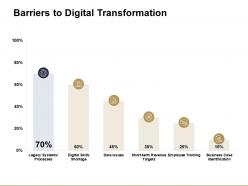 Barriers to digital transformation ppt powerpoint presentation diagram lists
Presenting this set of slides with name - Barriers To Digital Transformation Ppt Powerpoint Presentation Diagram Lists. This is a two stage process. The stages in this process are Data Issues, Employee Training, Processes, Legacy Systems, Marketing.
-
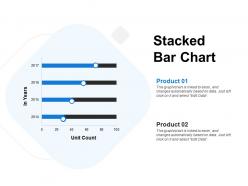 Stacked bar chart investment ppt powerpoint presentation infographics graphics download
Presenting this set of slides with name - Stacked Bar Chart Investment Ppt Powerpoint Presentation Infographics Graphics Download. This is a two stage process. The stages in this process are Finance, Analysis, Business, Investment, Marketing.
-
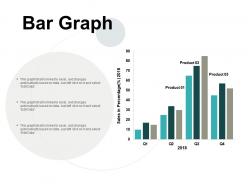 Bar graph planning finance ppt powerpoint presentation pictures format ideas
Presenting this set of slides with name - Bar Graph Planning Finance Ppt Powerpoint Presentation Pictures Format Ideas. This is a three stage process. The stages in this process are Finance, Analysis, Business, Investment, Marketing.
-
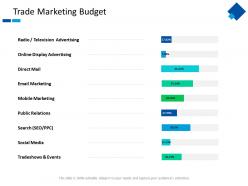 Trade marketing budget mobile marketing ppt powerpoint presentation layouts files
Presenting this set of slides with name - Trade Marketing Budget Mobile Marketing Ppt Powerpoint Presentation Layouts Files. This is a nine stages process.The stages in this process are Mobile Marketing, Public Relations, Social Media, Online Display Advertising, Email Marketing.
-
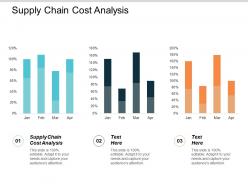 Supply chain cost analysis ppt powerpoint presentation styles maker cpb
Presenting this set of slides with name - Supply Chain Cost Analysis Ppt Powerpoint Presentation Styles Maker Cpb. This is an editable three stages graphic that deals with topics like Supply Chain Cost Analysis to help convey your message better graphically. This product is a premium product available for immediate download, and is 100 percent editable in Powerpoint. Download this now and use it in your presentations to impress your audience.
-
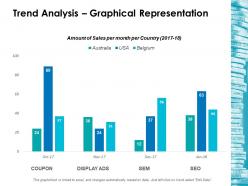 Trend analysis graphical representation ppt layouts graphics
Presenting this set of slides with name - Trend Analysis Graphical Representation Ppt Layouts Graphics. This is a four stage process. The stages in this process are Business, Management, Strategy, Analysis, Marketing.
-
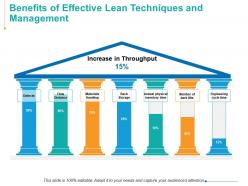 Benefits of effective lean techniques and management ppt powerpoint presentation tips
Presenting this set of slides with name - Benefits Of Effective Lean Techniques And Management Ppt Powerpoint Presentation Tips. This is a seven stage process. The stages in this process are Defects, Flow Distance, Materials Handling, Rack Storage, Planning.
-
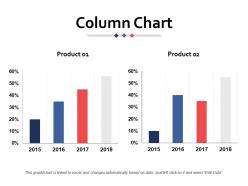 Column chart ppt inspiration guide
Presenting this set of slides with name - Column Chart Ppt Inspiration Guide. This is a two stage process. The stages in this process are Business, Management, Strategy, Analysis, Marketing.
-
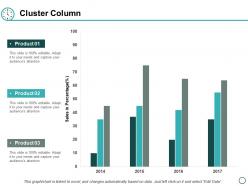 Cluster column analysis ppt powerpoint presentation inspiration vector
Presenting this set of slides with name - Cluster Column Analysis Ppt Powerpoint Presentation Inspiration Vector. This is a three stages process. The stages in this process are Cluster Column, Finance, Marketing, Business, Analysis.
-
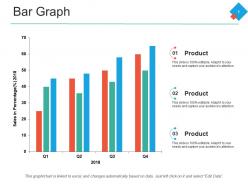 Bar graph ppt powerpoint presentation pictures visual aids
Presenting this set of slides with name - Bar Graph Ppt Powerpoint Presentation Pictures Visual Aids. This is a three stage process. The stages in this process are Business, Management, Strategy, Analysis, Marketing.
-
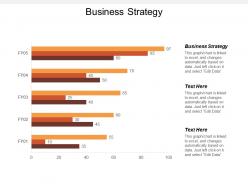 Business strategy ppt powerpoint presentation file background cpb
Presenting this set of slides with name - Business Strategy Ppt Powerpoint Presentation File Background Cpb. This is an editable three stages graphic that deals with topics like Business Strategy to help convey your message better graphically. This product is a premium product available for immediate download, and is 100 percent editable in Powerpoint. Download this now and use it in your presentations to impress your audience.
-
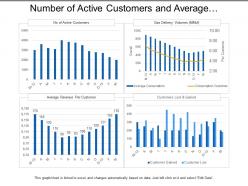 Number of active customers and average revenue utilities dashboard
Presenting this set of slides with name - Number Of Active Customers And Average Revenue Utilities Dashboard. This is a four stage process. The stages in this process are Utilities, Use, Advantage.
-
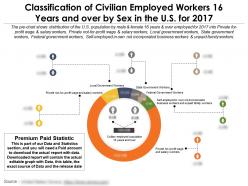 Classification of civilian employed workers 16 years and over by sex in the us for 2017
Classification Of Civilian Employed Workers 16 Years And Over By Sex In The Us For 2017. This is part of our Data and Statistics products selection, and you will need a Paid account to download the actual report with accurate data. Downloaded report will contain the actual editable graph with the actual data, an excel table with the actual data, the exact source of the data and the release date.The pie chart shows distribution of the US population by male and female 16 years and over employed for 2017 into Private for profit wage and salary workers, Private not for profit wage and salary workers, Local government workers State government workers Federal government workers Self employed in own not incorporated business workers and unpaid family workers. It covers topic Civilian Employed Workers by Sex for region USA and is for date range 2017. Download it immediately and use it for your business.
-
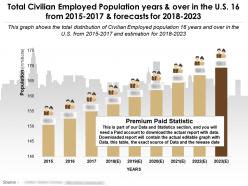 Total civilian employed population years and over in the us 16 from 2015-2017 and forecasts for 2018-2023
Total Civilian employed population 16 years and over in the US from 2015 to 2017 and Forecasts for 2018 to 2023. This is part of our Data and Statistics products selection, and you will need a Paid account to download the actual report with accurate data. Downloaded report will contain the actual editable graph with the actual data, an excel table with the actual data, the exact source of the data and the release date. This graph shows the total distribution of Civilian Employed population 16 years and over by male and female in the U.S. from 2015 to 2017 and estimation for 2018 to 2023. It covers topic Civilian Employed population by Sex for region USA and is for date range 2015 to 23. Download it immediately and use it for your business.
-
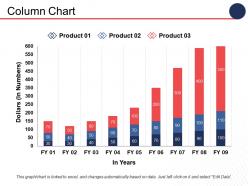 Column chart finance ppt summary example introduction
This is a three stage process. The stages in this process are Finance, Marketing, Analysis, Business, Investment.
-
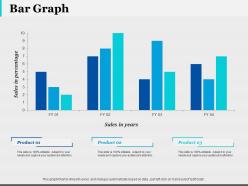 Bar graph finance ppt infographic template infographic template
This is a three stage process. The stages in this process are Finance, Analysis, Business, Investment, Marketing.
-
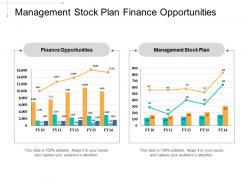 Management stock plan finance opportunities presentation solution predictive analytics cpb
This is an editable two stages graphic that deals with topics like Management Stock Plan, Finance Opportunities, Presentation Solution, Predictive Analytics to help convey your message better graphically. This product is a premium product available for immediate download, and is 100 percent editable in Powerpoint. Download this now and use it in your presentations to impress your audience.
-
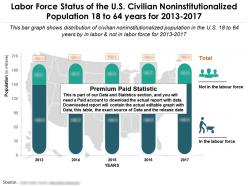 Labor force status of the us civilian noninstitutionalized population 18 to 64 years for 2013-2017
Presenting this set of slides with name - Labor Force Status Of The Us Civilian Noninstitutionalized Population 18 To 64 Years For 2013-2017. Labor Force Status of the U.S. Civilian Noninstitutionalized Population 18 to 64 years for 2013 TO 2017. This is part of our Data and Statistics products selection, and you will need a Paid account to download the actual report with accurate data. Downloaded report will contain the actual editable graph with the actual data, an excel table with the actual data, the exact source of the data and the release date. This bar graph shows distribution of civilian noninstitutionalized population in the U.S. 18 to 64 years by in labor and not in labor force for 2013 TO 2017. It covers topic Civilian Noninstitutionalized Labor Force Status for region USA and is for date range 2013 TO 2017. Download it immediately and use it for your business.
-
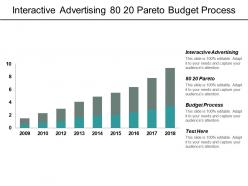 Interactive advertising 80 20 pareto budget process control strategies cpb
Presenting this set of slides with name - Interactive Advertising 80 20 Pareto Budget Process Control Strategies Cpb. This is an editable four stages graphic that deals with topics like Interactive Advertising, 80 20 Pareto, Budget Process, Control Strategies to help convey your message better graphically. This product is a premium product available for immediate download, and is 100 percent editable in Powerpoint. Download this now and use it in your presentations to impress your audience.
-
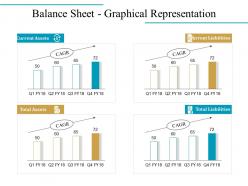 Balance sheet graphical representation good ppt example
Presenting this set of slides with name - Balance Sheet Graphical Representation Good Ppt Example. This is a four stage process. The stages in this process are Current Assets, Current Liabilities, Total Liabilities, Total Assets, Business.
-
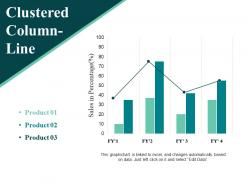 Clustered column line powerpoint presentation templates
Presenting this set of slides with name - Clustered Column Line Powerpoint Presentation Templates. This is a four stage process. The stages in this process are Sales In Percentage, Graph, Business, Marketing, Strategy.
-
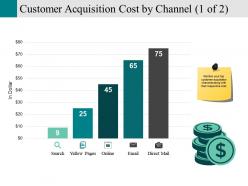 Customer acquisition cost by channel powerpoint slide
Presenting this set of slides with name - Customer Acquisition Cost By Channel Powerpoint Slide. This is a five stage process. The stages in this process are In Dollar, Search, Yellow Pages, Online, Email.
-
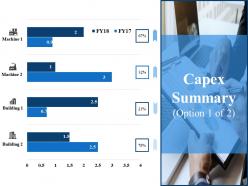 Capex summary ppt topics
Presenting this set of slides with name - Capex Summary Ppt Topics. This is a four stage process. The stages in this process are Finance, Analysis, Marketing, Business, Strategy.
-
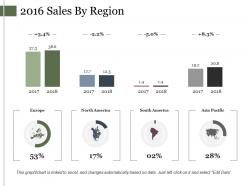 2016 sales by region example of ppt
Presenting this set of slides with name - 2016 Sales By Region Example Of Ppt. This is a eight stage process. The stages in this process are Europe, North America, South America, Asia Pacific.
-
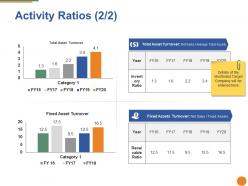 Activity ratios ppt pictures design inspiration
Presenting this set of slides with name - Activity Ratios Ppt Pictures Design Inspiration. This is a two stage process. The stages in this process are Bar, Business, Marketing, Strategy, Planning.
-
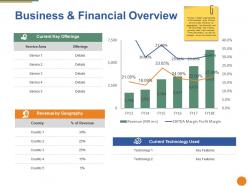 Business and financial overview ppt pictures example topics
Presenting this set of slides with name - Business And Financial Overview Ppt Pictures Example Topics. This is a two stage process. The stages in this process are Bar, Business, Marketing, Strategy, Planning.
-
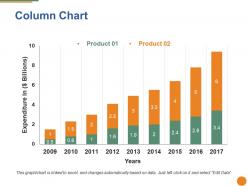 Column chart ppt pictures graphics design
Presenting this set of slides with name - Column Chart Ppt Pictures Graphics Design. This is a two stage process. The stages in this process are Bar, Business, Marketing, Strategy, Planning.
-
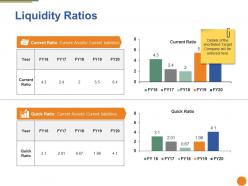 Liquidity ratios ppt pictures objects
Presenting this set of slides with name - Liquidity Ratios Ppt Pictures Objects. This is a two stage process. The stages in this process are Bar, Business, Marketing, Strategy, Planning.
-
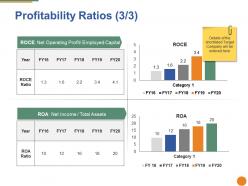 Profitability ratios ppt portfolio files
Presenting this set of slides with name - Profitability Ratios Ppt Portfolio Files. This is a two stage process. The stages in this process are Bar, Business, Marketing, Strategy, Planning.
-
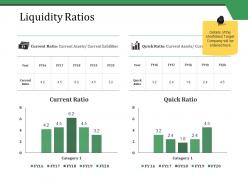 Liquidity ratios ppt styles topics
Presenting this set of slides with name - Liquidity Ratios Ppt Styles Topics. This is a two stage process. The stages in this process are Finance, Business, Current Ratio, Quick Ratio, Marketing.
-
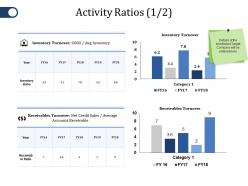 Activity ratios ppt diagram templates
Presenting this set of slides with name - Activity Ratios Ppt Diagram Templates. This is a two stage process. The stages in this process are Inventory Turnover, Receivables Turnover, Category, Year, Receivable Ratio.
-
 Profitability ratios ppt file display
Presenting this set of slides with name - Profitability Ratios Ppt File Display. This is a two stage process. The stages in this process are Eps Ratio, Pe Ratio, Category, Earning Per Share, Price To Earning Ratio.
-
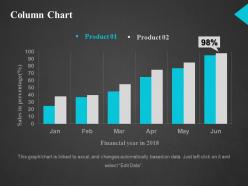 Column chart ppt designs
Presenting our Column Chart PowerPoint presentation set of slides. This graph/chart is 100% editable and downloadable. Data graphs/charts are editable via Excel that changes automatically based on the data. You can change it into different formats like PDF, JPG, and PNG as per your requirement. It can also be easily converted into a different color, font, font size, and font types of the template. The slide is available in both 4:3 and 16:9 aspect ratios. Download this template that is compatible with Google slides as well and wow your audience.
-
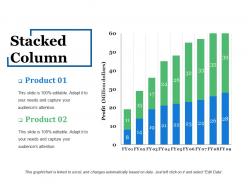 Stacked column powerpoint slide designs
Presenting this set of slides with name - Stacked Column Powerpoint Slide Designs. This is a two stage process. The stages in this process are Business, Marketing, Strategy, Planning, Bar.
-
 Social media analysis presentation graphics
Presenting this set of slides with name - Social Media Analysis Presentation Graphics. This is a four stage process. The stages in this process are Bar Graph, Marketing, Strategy, Finance, Planning.
-
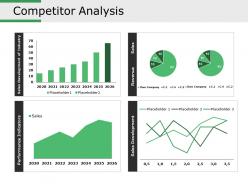 Competitor analysis ppt images gallery
Presenting this set of slides with name - Competitor Analysis Ppt Images Gallery. This is a four stage process. The stages in this process are Business, Finance, Marketing, Strategy, Analysis.
-
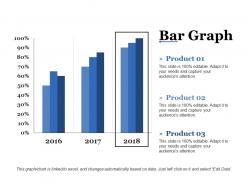 Bar graph ppt icon example topics
Presenting this set of slides with name - Bar Graph Ppt Icon Example Topics. This is a three stage process. The stages in this process are Product, Bar Graph, Growth, Year, Finance.
-
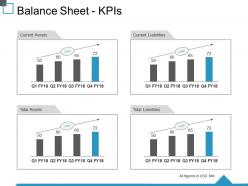 Balance sheet kpis ppt summary structure
Presenting this set of slides with name - Balance Sheet Kpis Ppt Summary Structure. This is a four stage process. The stages in this process are Current Assets, Current Liabilities, Total Assets, Total Liabilities, Business, Finance.
-
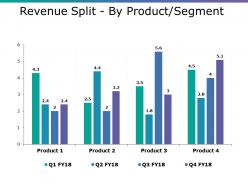 Revenue split by product segment ppt summary skills
Presenting this set of slides with name - Revenue Split By Product Segment Ppt Summary Skills. This is a four stage process. The stages in this process are Product, Bar Graph, Growth, Success, Business.
-
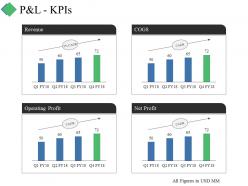 P and l kpis ppt summary styles
Presenting this set of slides with name - P And L Kpis Ppt Summary Styles. This is a four stage process. The stages in this process are Business, Marketing, Revenue, Operating Profit, Net Profit, Cogs.
-
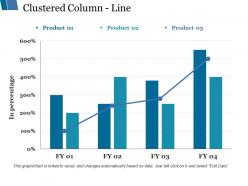 Clustered column line ppt styles graphics tutorials
Presenting this set of slides with name - Clustered Column Line Ppt Styles Graphics Tutorials. This is a three stage process. The stages in this process are Business, Marketing, Graph, In Percentage, Growth.
-
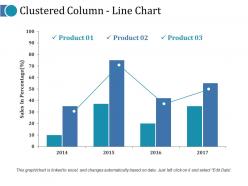 Clustered column line chart ppt infographic template mockup
Presenting this set of slides with name - Clustered Column Line Chart Ppt Infographic Template Mockup. This is a four stage process. The stages in this process are Bar Graph, Growth, Success, Product, Sales In Percentage.
-
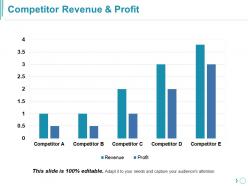 Competitor revenue and profit ppt slides download
Presenting this set of slides with name - Competitor Revenue And Profit Ppt Slides Download. This is a five stage process. The stages in this process are Business, Finance, Marketing, Strategy, Analysis, Growth.
-
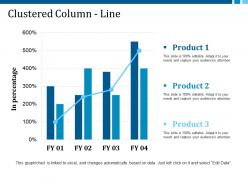 Clustered column line ppt slides format ideas
Presenting this set of slides with name - Clustered Column Line Ppt Slides Format Ideas. This is a three stage process. The stages in this process are Product, In Percentage, Bar Graph, Growth, Business.
-
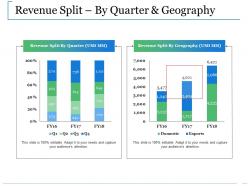 Revenue split by quarter and geography ppt slides layouts
Presenting this set of slides with name - Revenue Split By Quarter And Geography Ppt Slides Layouts. This is a two stage process. The stages in this process are Business, Financial, Marketing, Revenue Split By Quarter, Revenue Split By Geography.
-
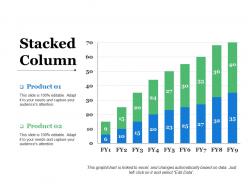 Stacked column ppt slides infographics
Presenting this set of slides with name - Stacked Column Ppt Slides Infographics. This is a two stage process. The stages in this process are Business, Marketing, Strategy, Graph, Finance.
-
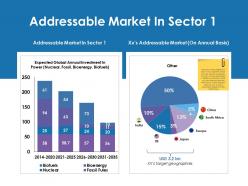 Addressable market in sector 1 ppt show background image
Presenting this set of slides with name - Addressable Market In Sector 1 Ppt Show Background Image. This is a two stage process. The stages in this process are Biofuels, Nuclear, Bioenergy, Fossil Fuels, Other.
-
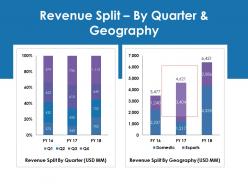 Revenue split by quarter and geography ppt gallery layout ideas
Presenting this set of slides with name - Revenue Split By Quarter And Geography Ppt Gallery Layout Ideas. This is a two stage process. The stages in this process are Revenue Split By Quarter, Revenue Split By Geography, Domestic, Exports.
-
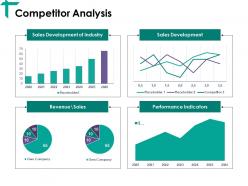 Competitor analysis ppt visual aids infographics
Presenting this set of slides with name - Competitor Analysis Ppt Visual Aids Infographics. This is a four stage process. The stages in this process are Sales Development Of Industry, Sales Development, Performance Indicators, Business, Marketing.
-
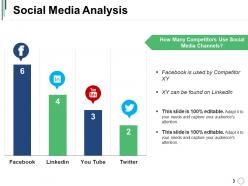 Social media analysis powerpoint slide introduction
Presenting this set of slides with name - Social Media Analysis Powerpoint Slide Introduction. This is a four stage process. The stages in this process are Bar, Marketing, Strategy, Planning, Finance.
-
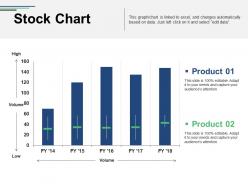 Stock chart presentation outline
Presenting this set of slides with name - Stock Chart Presentation Outline. This is a five stage process. The stages in this process are Business, Marketing, Strategy, Planning, Finance.
-
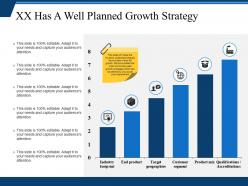 Xx has a well planned growth strategy powerpoint templates
Presenting this set of slides with name - Xx Has A Well Planned Growth Strategy Powerpoint Templates. This is a six stage process. The stages in this process are Bar Chart, Finance, Marketing, Analysis, Strategy, Investment.


