- Sub Categories
-
 Profitability ratios ppt file display
Presenting this set of slides with name - Profitability Ratios Ppt File Display. This is a two stage process. The stages in this process are Eps Ratio, Pe Ratio, Category, Earning Per Share, Price To Earning Ratio.
-
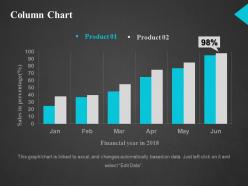 Column chart ppt designs
Presenting our Column Chart PowerPoint presentation set of slides. This graph/chart is 100% editable and downloadable. Data graphs/charts are editable via Excel that changes automatically based on the data. You can change it into different formats like PDF, JPG, and PNG as per your requirement. It can also be easily converted into a different color, font, font size, and font types of the template. The slide is available in both 4:3 and 16:9 aspect ratios. Download this template that is compatible with Google slides as well and wow your audience.
-
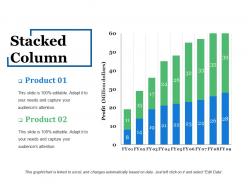 Stacked column powerpoint slide designs
Presenting this set of slides with name - Stacked Column Powerpoint Slide Designs. This is a two stage process. The stages in this process are Business, Marketing, Strategy, Planning, Bar.
-
 Social media analysis presentation graphics
Presenting this set of slides with name - Social Media Analysis Presentation Graphics. This is a four stage process. The stages in this process are Bar Graph, Marketing, Strategy, Finance, Planning.
-
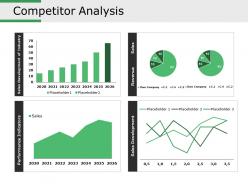 Competitor analysis ppt images gallery
Presenting this set of slides with name - Competitor Analysis Ppt Images Gallery. This is a four stage process. The stages in this process are Business, Finance, Marketing, Strategy, Analysis.
-
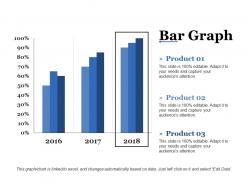 Bar graph ppt icon example topics
Presenting this set of slides with name - Bar Graph Ppt Icon Example Topics. This is a three stage process. The stages in this process are Product, Bar Graph, Growth, Year, Finance.
-
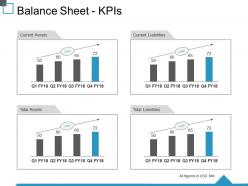 Balance sheet kpis ppt summary structure
Presenting this set of slides with name - Balance Sheet Kpis Ppt Summary Structure. This is a four stage process. The stages in this process are Current Assets, Current Liabilities, Total Assets, Total Liabilities, Business, Finance.
-
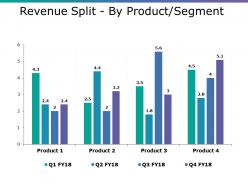 Revenue split by product segment ppt summary skills
Presenting this set of slides with name - Revenue Split By Product Segment Ppt Summary Skills. This is a four stage process. The stages in this process are Product, Bar Graph, Growth, Success, Business.
-
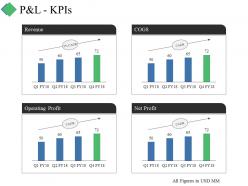 P and l kpis ppt summary styles
Presenting this set of slides with name - P And L Kpis Ppt Summary Styles. This is a four stage process. The stages in this process are Business, Marketing, Revenue, Operating Profit, Net Profit, Cogs.
-
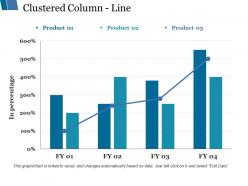 Clustered column line ppt styles graphics tutorials
Presenting this set of slides with name - Clustered Column Line Ppt Styles Graphics Tutorials. This is a three stage process. The stages in this process are Business, Marketing, Graph, In Percentage, Growth.
-
 Clustered column line chart ppt infographic template mockup
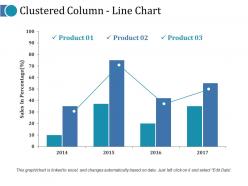
Presenting this set of slides with name - Clustered Column Line Chart Ppt Infographic Template Mockup. This is a four stage process. The stages in this process are Bar Graph, Growth, Success, Product, Sales In Percentage.
-
 Competitor revenue and profit ppt slides download
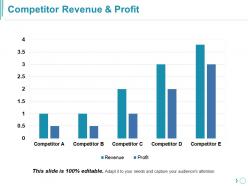
Presenting this set of slides with name - Competitor Revenue And Profit Ppt Slides Download. This is a five stage process. The stages in this process are Business, Finance, Marketing, Strategy, Analysis, Growth.
-
 Clustered column line ppt slides format ideas
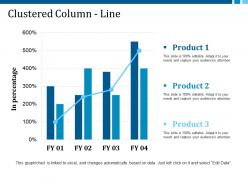
Presenting this set of slides with name - Clustered Column Line Ppt Slides Format Ideas. This is a three stage process. The stages in this process are Product, In Percentage, Bar Graph, Growth, Business.
-
 Revenue split by quarter and geography ppt slides layouts
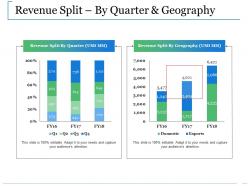
Presenting this set of slides with name - Revenue Split By Quarter And Geography Ppt Slides Layouts. This is a two stage process. The stages in this process are Business, Financial, Marketing, Revenue Split By Quarter, Revenue Split By Geography.
-
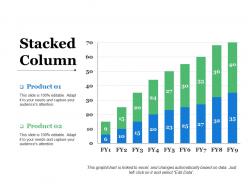 Stacked column ppt slides infographics
Presenting this set of slides with name - Stacked Column Ppt Slides Infographics. This is a two stage process. The stages in this process are Business, Marketing, Strategy, Graph, Finance.
-
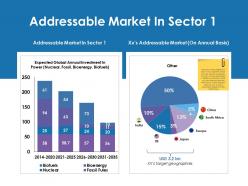 Addressable market in sector 1 ppt show background image
Presenting this set of slides with name - Addressable Market In Sector 1 Ppt Show Background Image. This is a two stage process. The stages in this process are Biofuels, Nuclear, Bioenergy, Fossil Fuels, Other.
-
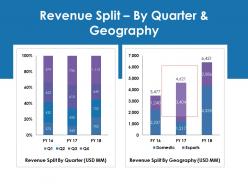 Revenue split by quarter and geography ppt gallery layout ideas
Presenting this set of slides with name - Revenue Split By Quarter And Geography Ppt Gallery Layout Ideas. This is a two stage process. The stages in this process are Revenue Split By Quarter, Revenue Split By Geography, Domestic, Exports.
-
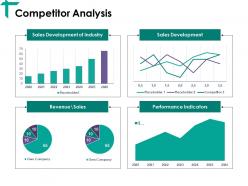 Competitor analysis ppt visual aids infographics
Presenting this set of slides with name - Competitor Analysis Ppt Visual Aids Infographics. This is a four stage process. The stages in this process are Sales Development Of Industry, Sales Development, Performance Indicators, Business, Marketing.
-
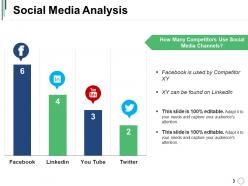 Social media analysis powerpoint slide introduction
Presenting this set of slides with name - Social Media Analysis Powerpoint Slide Introduction. This is a four stage process. The stages in this process are Bar, Marketing, Strategy, Planning, Finance.
-
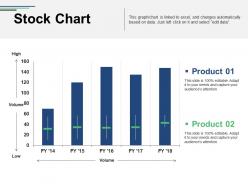 Stock chart presentation outline
Presenting this set of slides with name - Stock Chart Presentation Outline. This is a five stage process. The stages in this process are Business, Marketing, Strategy, Planning, Finance.
-
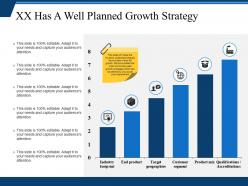 Xx has a well planned growth strategy powerpoint templates
Presenting this set of slides with name - Xx Has A Well Planned Growth Strategy Powerpoint Templates. This is a six stage process. The stages in this process are Bar Chart, Finance, Marketing, Analysis, Strategy, Investment.
-
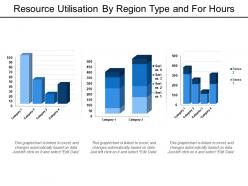 Resource utilisation by region type and for hours
Presenting this set of slides with name - Resource Utilisation By Region Type And For Hours. This is a three stage process. The stages in this process are Resource Management, Resource Utilization, Resource Allocation.
-
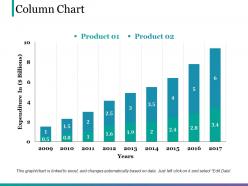 Column chart ppt infographic template
Presenting this set of slides with name - Column Chart Ppt Infographic Template. This is a two stage process. The stages in this process are Business, Years, Expenditure In, Marketing, Graph.
-
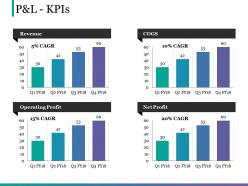 P and l kpis example ppt presentation
Presenting this set of slides with name - P And L Kpis Example Ppt Presentation. This is a four stage process. The stages in this process are Business, Revenue, Cogs, Net Profit, Operating Profit.
-
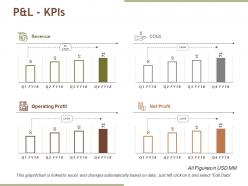 Pandl kpis presentation design
Presenting this set of slides with name - Pandl Kpis Presentation Design. This is a four stage process. The stages in this process are Bar, Business, Marketing, Strategy, Planning.
-
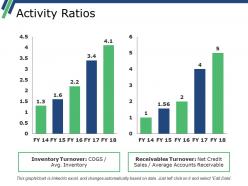 Activity ratios powerpoint slide
Presenting this set of slides with name - Activity Ratios Powerpoint Slide. This is a two stage process. The stages in this process are Business, Finance, Marketing, Strategy, Analysis.
-
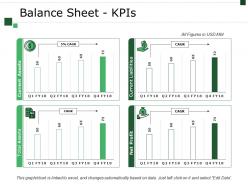 Balance sheet kpis template 4 ppt design
Presenting this set of slides with name - Balance Sheet Kpis Template 4 Ppt Design. This is a four stage process. The stages in this process are Balance Sheet, Finance, Marketing, Strategy, Business.
-
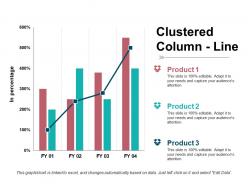 Clustered column line presentation powerpoint
Presenting a PowerPoint slide named Clustered column line presentation PowerPoint. This template with high-quality graphics is completely editable and professionally designed. With an option to change the size, style and color of the font, this slide is ready to use. You can customize the text and color of the diagram as well as the background as per your discretion. The PPT slide is compatible with Google slides which make it easily accessible. You can customize and save the file as JPG or PDF formats. Once the graph is linked to excel, it automatically changes based on the data. Download this ready to use template.
-
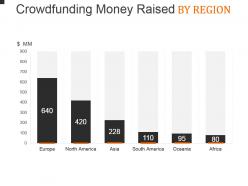 Crowdfunding money raised by region powerpoint layout
Presenting crowdfunding money raised by region powerpoint layout. This is a crowdfunding money raised by region powerpoint layout. This is a six stage process. The stages in this process are business, marketing, bar graph, presentation, management.
-
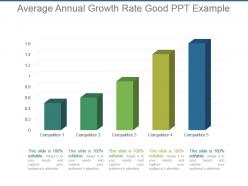 Average annual growth rate good ppt example
Presenting average annual growth rate good ppt example. This is a average annual growth rate good ppt example. This is a five stage process. The stages in this process are growth, business, marketing, success, process.
-
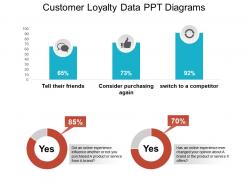 Customer loyalty data ppt diagrams
Presenting customer loyalty data ppt diagrams. This is a customer loyalty data ppt diagrams. This is a two stage process. The stages in this process are business, finance, marketing, growth, planning.
-
 Achieving sales target data driven bar graph example of ppt
Best advantage of using this wonderful PPT template is that it is fully editable. You can modify the design according to business needs. Design template makes the use of excel linked chart, where you need to insert business related data into excel sheet and design charts will get changed automatically. Design can be downloaded into JPEG and PDF formats. PPT is fully compatible with Google Slides and MS PowerPoint software.
-
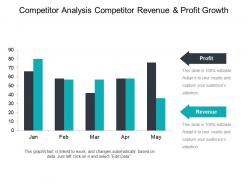 Competitor analysis competitor revenue and profit growth ppt samples
Presenting Competitor analysis competitor revenue and profit growth PPT samples PPT slide. This PPT has a stunning match of topic and visuals plus professional proficiency and brilliant craftsmanship. The presentation is thoroughly editable. Ease of personalization. Ease of customization with desired contents. Special assistance to execute the changes has been provided. PPT is compatible with multiple numbers of formats and numerous software options available both online and offline. Visuals are of high resolution. Used by marketing and business professionals, social organization professionals, students, and educators.
-
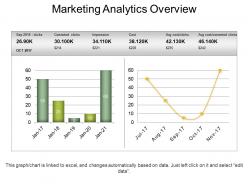 Marketing analytics overview powerpoint slide influencers
Presenting the slide named Marketing Analytics Overview PowerPoint Slide Influencers. You can change the shape, color, and graphics of any component in the slide. The text is completely editable. Its compatibility with Google Slides makes it accessible anywhere. This template can be saved in both PDF and JPG formats. You can link this slide to an Excel sheet and make changes accordingly. Avail it in both standard and widescreen size.
-
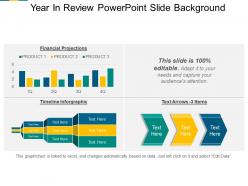 Year in review powerpoint slide background
Presenting a slide named Year-In-Review PowerPoint Slide Background. Alter the font color, size, and style. The color of the diagram and background can be formatted. Save your time with an easily available, completely editable PPT slide. The slide can be linked to the Excel sheet. Design the PowerPoint slide with a range of editable icons. You can add or edit text anywhere in the PowerPoint template. Its compatibility with Google Slides makes it accessible at once. You can customize and save the slide in PDF and JPG formats as well.
-
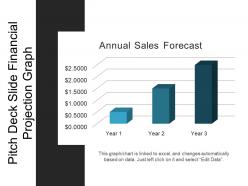 Pitch deck slide financial projection graph 1 ppt summary
Presenting Pitch Deck Slide Financial Projection Graph 1 PPT Summary. Individualize the slide as per the requirements. You are free to make any changes in the slide. Modify the colors, background, and the font of the slide. Export it in JPG, PNG, and PDF file formats. It can be projected on standard screen and widescreen as well. The slide is Google Slides friendly. Present it on a full screen without any fear of pixelation.
-
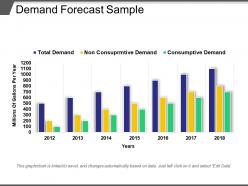 Demand forecast sample ppt slide design
Presenting Demand Forecast Sample PPT Slide Design which is designed professionally for your convenience. You can open and save your presentation into formats like PDF, PNG, and JPG. The slide is available in both 4:3 and 16:9 aspect ratio. The template is adaptable with Google Slides, which makes it easily accessible. Customize the color, fonts, font size, and font types of the template as per the requirement.
-
 Clustered column presentation visual aids
Presenting clustered column presentation visual aids. This is a clustered column presentation visual aids. This is a two stage process. The stages in this process are business, marketing, graph, success, finance.
-
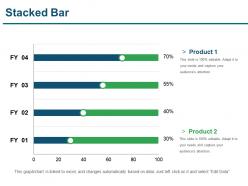 Stacked bar ppt example file
Presenting stacked bar ppt example file. This is a stacked bar ppt example file . This is a four stage process. The stages in this process are stacked bar, analysis, marketing, strategy, business.
-
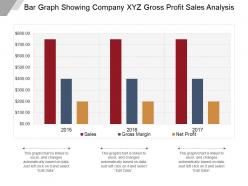 Bar graph showing company xyz gross profit sales analysis
Presenting bar graph showing company xyz gross profit sales analysis. This is a bar graph showing company xyz gross profit sales analysis. This is a three stage process. The stages in this process are gross profit, gross benefit, gross margin.
-
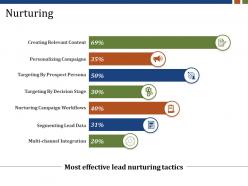 Nurturing powerpoint slide designs
Presenting nurturing powerpoint slide designs. This is a nurturing powerpoint slide designs. This is a seven stage process. The stages in this process are creating relevant content, personalizing campaigns, targeting by prospect persona, targeting by decision stage, nurturing campaign workflows, segmenting lead data, multi channel integration.
-
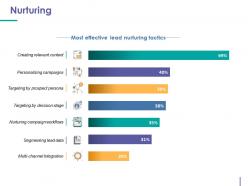 Nurturing powerpoint slide templates download
Presenting nurturing powerpoint slide templates download. This is a nurturing powerpoint slide templates download. This is a seven stage process. The stages in this process are creating relevant content, personalizing campaigns, targeting by decision stage, nurturing campaign workflows, segmenting lead data.
-
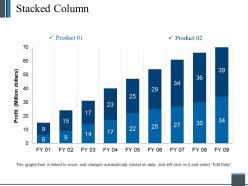 Stacked column ppt background template 2
Presenting stacked column ppt background template 2. This is a stacked column ppt background template 2. This is a nine stage process. The stages in this process are product, profit, bar graph, business, success.
-
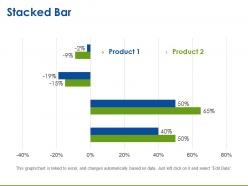 Stacked bar powerpoint layout
Presenting stacked bar powerpoint layout. This is a stacked bar powerpoint layout. This is a two stage process. The stages in this process are stacked bar, finance, marketing, strategy, business, analysis.
-
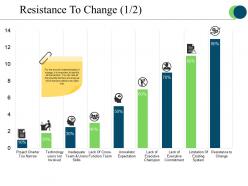 Resistance to change presentation graphics
Presenting resistance to change presentation graphics. This is a resistance to change presentation graphics. This is a nine stage process. The stages in this process are unrealistic expectation, project charter too narrow, resistance of change.
-
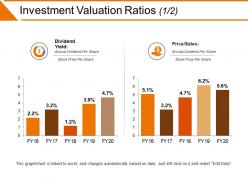 Investment valuation ratios powerpoint slide design templates
Presenting investment valuation ratios powerpoint slide design templates. This is a investment valuation ratios powerpoint slide design templates. This is a two stage process. The stages in this process are business, marketing, bar, planning, strategy.
-
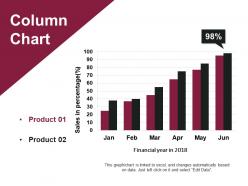 Column chart sample ppt presentation
Presenting Column Chart Sample Ppt Presentation. Get this completely customizable slide and make changes in it as per your needs. It can be transformed and saved into various formats, including JPG and PDF. Avail it in 2 screen sizes i.e., standard screen size and widescreen size. It is entirely compatible with Google Slides and major Microsoft versions. Modify the colors, background, and font style as per your requirements.
-
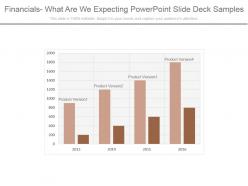 Financials what are we expecting powerpoint slide deck samples
Presenting financials what are we expecting powerpoint slide deck samples. This is a financials what are we expecting powerpoint slide deck samples. This is a four stage process. The stages in this process are business, financials, marketing, management, success.
-
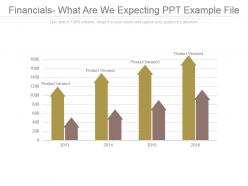 Financials what are we expecting ppt example file
Presenting financials what are we expecting ppt example file. This is a financials what are we expecting ppt example file. This is a four stage process. The stages in this process are arrows, product version, business, marketing, process, success.
-
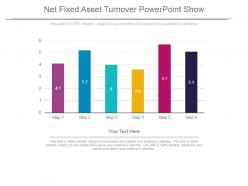 Net fixed asset turnover powerpoint show
Presenting net fixed asset turnover powerpoint show. This is a net fixed asset turnover powerpoint show. This is a six stage process. The stages in this process are business, marketing, process, analysis, success, management.
-
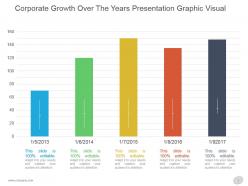 Corporate growth over the years presentation graphic visual
Presenting corporate growth over the years presentation graphic visual. This is a corporate growth over the years presentation graphic visual. This is a five stage process. The stages in this process are graph, success, business, marketing, growth.
-
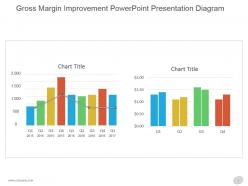 Gross margin improvement powerpoint presentation diagram
Presenting gross margin improvement powerpoint presentation diagram. This is a gross margin improvement powerpoint presentation diagram. This is a two stage process. The stages in this process are chart title, q.
-
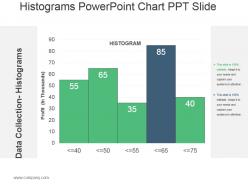 Histograms powerpoint chart ppt slide
Presenting histograms powerpoint chart ppt slide. This is a histograms powerpoint chart ppt slide. This is a five stage process. The stages in this process are data collection histograms, histogram, profit in thousands.
-
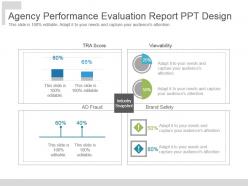 Agency performance evaluation report ppt design
Presenting agency performance evaluation report ppt design. This is a agency performance evaluation report ppt design. This is a four stage process. The stages in this process are industry snapshot, brand safety, viewability.
-
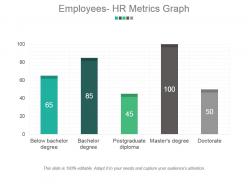 Employees hr metrics graph powerpoint images
Presenting employees hr metrics graph powerpoint images. This is a employees hr metrics graph powerpoint images. This is a five stage process. The stages in this process are below bachelor degree, bachelor degree, post graduate diploma, master degree, doctorate.
-
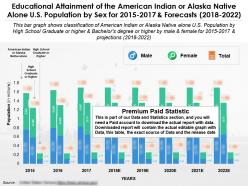 Educational attainment of the american indian or alaska native alone us population by sex for 2015-2022
Presenting this set of slides with name - Educational Attainment Of The American Indian Or Alaska Native Alone US Population By Sex For 2015-2022. Educational Attainment of the American Indian or Alaska Native alone U.S. Population by Sex for 2015 to 2017 and Forecasts 2018 to 2022. This is part of our Data and Statistics products selection, and you will need a Paid account to download the actual report with accurate data. Downloaded report will contain the actual editable graph with the actual data, an excel table with the actual data, the exact source of the data and the release date. This bar graph shows classification of American Indian or Alaska Native alone U.S. Population by High School Graduate or higher and Bachelors degree or higher by male and female for 2015 to 2017 and projections 2018 to 2022. It covers topic Educational Attainment levels of U.S. Population for region USA and is for date range 2015 to 22. Download it immediately and use it for your business.
-
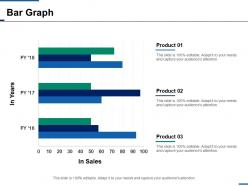 Bar graph finance business ppt infographics slide download
Presenting this set of slides with name - Bar Graph Finance Business Ppt Infographics Slide Download. This is a three stage process. The stages in this process are Finance, Analysis, Business, Investment, Marketing.
-
 Educational attainment for hispanic or latino origin categorized into sex in the us from 2015-2022
Presenting this set of slides with name - Educational Attainment For Hispanic Or Latino Origin Categorized Into Sex In The US From 2015-2022. Educational Attainment for Hispanic or Latino Origin categorized into Sex in the U.S. from 2015 TO 17 and Forecasts for 2018 TO 2022. This is part of our Data and Statistics products selection, and you will need a Paid account to download the actual report with accurate data. Downloaded report will contain the actual editable graph with the actual data, an excel table with the actual data, the exact source of the data and the release date. This graph shows the Educational Attainment levels categorized into High school graduate or higher and Bachelors degree or higher for Hispanic or Latino Origin by Male and Female in the U.S. from 2015 TO 17 and Estimations for 2018 TO 2022. It covers topic Educational Attainment levels of Hispanic or Latin Origin for region USA and is for date range 2015 TO 22. Download it immediately and use it for your business.
-
 Educational completion by sex age groups of 25 to 34 year 35 to 44 year 45 to 64 year and 65 year over in us 2017
Presenting this set of slides with name - Educational Completion By Sex Age Groups Of 25 To 34 Year 35 To 44 Year 45 To 64 Year And 65 Year Over In US 2017. Educational Attainment for the Population categorized into Age Groups of 25 to 34 years, 35 to 44 years, 45 to 64 years and 65 years and over by Sex in the U.S for 2017. This is part of our Data and Statistics products selection, and you will need a Paid account to download the actual report with accurate data. Downloaded report will contain the actual editable graph with the actual data, an excel table with the actual data, the exact source of the data and the release date. This graph shows the Educational Attainment levels categorized into High school graduate or higher and Bachelors degree or higher for Age Groups of 25 to 34 years, 35 to 44 years, 45 to 64 years and 65 years and over by Male and Female in the U.S for the Year 2017. It covers topic Educational Attainment levels by Sex for region USA and is for date range 2017. Download it immediately and use it for your business.
-
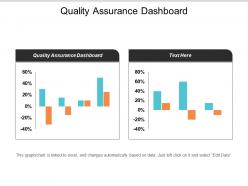 Quality assurance dashboard ppt powerpoint presentation inspiration designs download cpb
Presenting this set of slides with name - Quality Assurance Dashboard Ppt Powerpoint Presentation Inspiration Designs Download Cpb. This is an editable two stages graphic that deals with topics like to help convey your message better graphically. This product is a premium product available for immediate download, and is 100 percent editable in Powerpoint. Download this now and use it in your presentations to impress your audience.


