- Sub Categories
-
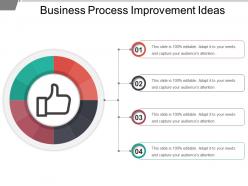 Business process improvement ideas powerpoint slide designs
Presenting business process improvement PPT slide template. This is exquisitely coordinated PPT design template beneficial for various business professionals. Easily resizable shapes, patterns, and matters etc. Genuine and admissible PPT Image with pliant data options. Adequately compatible with all operating software and all Google Slides. Easily convertible to PDF or JPG formats, unaffected high resolution PPT graphic when projected on a huge screen.
-
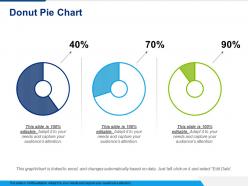 Donut pie chart powerpoint slide information
Presenting this set of slides with name - Donut Pie Chart Powerpoint Slide Information. This is a three stage process. The stages in this process are Business, Marketing, Chart, Percentage, Strategy.
-
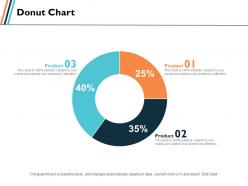 Donut chart investment ppt slides graphics template
Presenting this set of slides with name - Donut Chart Investment Ppt Slides Graphics Template. This is a three stage process. The stages in this process are Finance, Analysis, Business, Investment, marketing.
-
 Comparison ppt professional summary
Presenting this set of slides with name - Comparison Ppt Professional Summary. This is a two stage process. The stages in this process are Business, Management, Strategy, Analysis, Marketing.
-
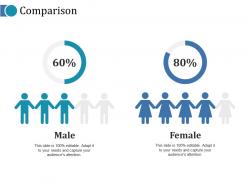 Comparison ppt infographics background image
Presenting this set of slides with name - Comparison Ppt Infographics Background Image. This is a two stage process. The stages in this process are Male, Female, Comparison, Business, Finance.
-
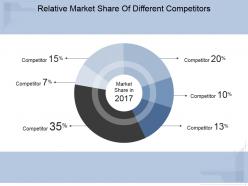 Relative market share of different competitors ppt diagrams
Presenting relative market share of different competitors ppt diagrams. This is a relative market share of different competitors ppt diagrams. This is a six stage process. The stages in this process are competitor, market share.
-
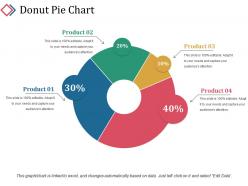 Donut pie chart powerpoint slide clipart template 1
Presenting donut pie chart powerpoint slide clipart template 1. This is a donut pie chart powerpoint slide clipart template 1. This is a four stage process. The stages in this process are product, donut pie chart, percentage, finance, business.
-
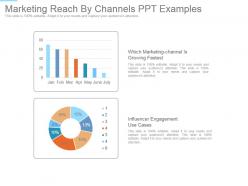 Marketing reach by channels ppt examples
Presenting marketing reach by channels ppt examples. This is a marketing reach by channels ppt examples. This is a two stage process. The stages in this process are which marketing channel is growing fastest, influencer engagement use cases.
-
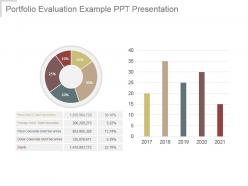 Portfolio evaluation example ppt presentation
Presenting portfolio evaluation example ppt presentation. This is a portfolio evaluation example ppt presentation. This is a two stage process. The stages in this process are peso govt debt securities, foreign govt debt securities, peso corporate debt securities, dollar corporate debt securities, equity.
-
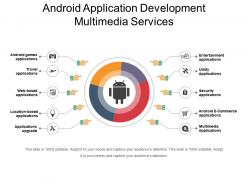 Android application development multimedia services
Presenting the Android Application Development Multimedia Services PowerPoint presentation. Modify the slideshow according to your needs. Add impressive data visualization tools like charts, graphs, tables, etc. The slide is also compatible with Google Slides and fully editable in MS PowerPoint. It can be saved into popular images or document formats like JPEG, PNG or PDF. Moreover, high-quality graphics will prevent distortion even when the user increases their size.
-
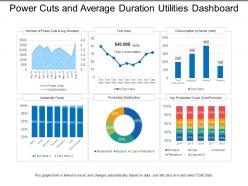 Power cuts and average duration utilities dashboard
Presenting this set of slides with name - Power Cuts And Average Duration Utilities Dashboard. This is a six stage process. The stages in this process are Utilities, Use, Advantage.
-
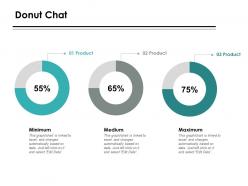 Donut chat finance ppt powerpoint presentation icon slide download
This is a three stage process. The stages in this process are Finance, Analysis, Business, Investment, Marketing.
-
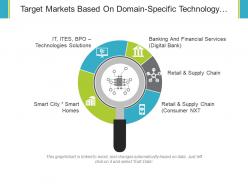 Target markets based on domain specific technology trends ppt design
Presenting target markets based on domain specific technology trends ppt design. This is a target markets based on domain specific technology trends ppt design. This is a five stage process. The stage in this process are banking and financial services, retail and supply chain, smart city smart homes, technologies solutions.
-
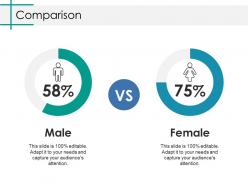 Comparison ppt inspiration slides
Presenting this set of slides with name - Comparison Ppt Inspiration Slides. This is a two stage process. The stages in this process are Male, Female, Finance.
-
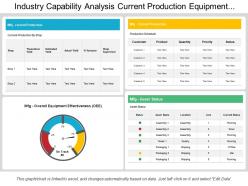 Industry capability analysis current production equipment effectiveness schedule
Presenting this set of slides with name - Industry Capability Analysis Current Production Equipment Effectiveness Schedule. This is a four stage process. The stages in this process are Industry Capability Analysis, Industry Potential Analysis, Industry Competency Analysis.
-
 Government and public works kpi dashboard showing service request count and time to close
Presenting this set of slides with name - Government And Public Works Kpi Dashboard Showing Service Request Count And Time To Close. This is a five stage process. The stages in this process are Government And Public Works, Government And Public Tasks.
-
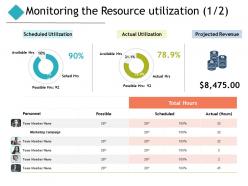 Monitoring the resource utilization projected revenue ppt powerpoint presentation pictures background
Presenting this set of slides with name - Monitoring The Resource Utilization Projected Revenue Ppt Powerpoint Presentation Pictures Background. This is a three stages Process are. The Stages in this process are Finance, Marketing, Management, Investment, Analysis.
-
 Future trends in multi channel retailing ppt show clipart images
Presenting this set of slides with name - Future Trends In Multi Channel Retailing Ppt Show Clipart Images. This is a four stage process. The stages in this process are Business, Management, Strategy, Analysis, Icons.
-
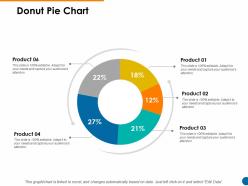 Donut pie chart ppt powerpoint presentation pictures graphic tips
Presenting this set of slides with name - Donut Pie Chart Ppt Powerpoint Presentation Pictures Graphic Tips. This is a five stage process. The stages in this process are Business, Strategy, Marketing, Analysis, Management.
-
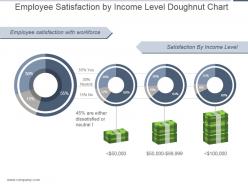 Employee satisfaction by income level doughnut chart ppt slide
Presenting employee satisfaction by income level doughnut chart ppt slide. This is a employee satisfaction by income level doughnut chart ppt slide. This is a four stage process. The stages in this process are employee satisfaction with workforce, satisfaction by income level, 55 percent yes, neutral, 15 percent no, 45 percent are either dissatisfied or neutral.
-
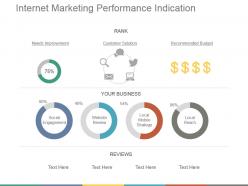 Internet marketing performance indication powerpoint guide
Presenting internet marketing performance indication powerpoint guide. This is a internet marketing performance indication powerpoint guide. This is a four stage process. The stages in this process are needs improvement, customer solution, recommended budget, social engagement, website review, local mobile strategy, local , local reach, reviews, rank.
-
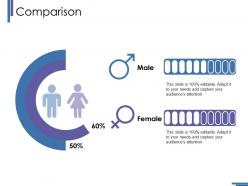 Comparison ppt ideas slide
Presenting this set of slides with name - Comparison Ppt Ideas Slide. This is a two stage process. The stages in this process are Male, Female, Comparison, Percentage, Finance.
-
 Change management sponsors ppt summary
Presenting this set of slides with name - Change Management Sponsors Ppt Summary. This is a two stage process. The stages in this process are Sponsorship, Stakeholder, Leadership, Management, Business.
-
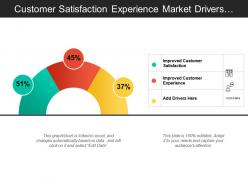 Customer satisfaction experience market drivers analysis meter with icons
Presenting this set of slides with name - Customer Satisfaction Experience Market Drivers Analysis Meter With Icons. This is a three stage process. The stages in this process are Growth Drivers, Growth Opportunity, Market Drivers.
-
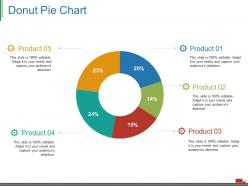 Donut pie chart ppt visual aids gallery
Presenting this set of slides with name - Donut Pie Chart Ppt Visual Aids Gallery. This is a five stage process. The stages in this process are Business, Marketing, Percentage, Chart, Process.
-
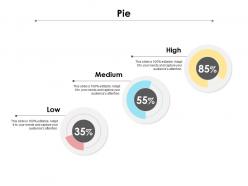 Pie ppt powerpoint presentation show inspiration
Presenting this set of slides with name - Pie Ppt Powerpoint Presentation Show Inspiration. This is a three stage process. The stages in this process are Finance, Business, Marketing, Management, Analysis.
-
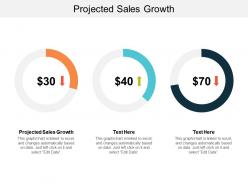 Projected sales growth ppt powerpoint presentation infographic template show cpb
Presenting this set of slides with name - Projected Sales Growth Ppt Powerpoint Presentation Infographic Template Show Cpb. This is an editable three stages graphic that deals with topics like Projected Sales Growth to help convey your message better graphically. This product is a premium product available for immediate download, and is 100 percent editable in Powerpoint. Download this now and use it in your presentations to impress your audience.
-
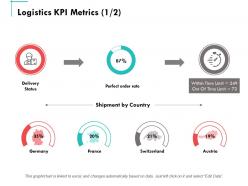 Logistics kpi metrics ppt powerpoint presentation summary samples
Presenting this set of slides with name - Logistics Kpi Metrics Ppt Powerpoint Presentation Summary Samples. This is a seven stages process. The stages in this process are Finance, Marketing, Management, Investment, Analysis.
-
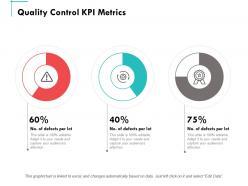 Quality control kpi metrics ppt powerpoint presentation summary elements
Presenting this set of slides with name - Quality Control Kpi Metrics Ppt Powerpoint Presentation Summary Elements. This is a three stages process. The stages in this process are Finance, Marketing, Management, Investment, Analysis.
-
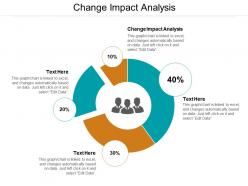 Change impact analysis ppt powerpoint presentation outline rules cpb
Presenting this set of slides with name - Change Impact Analysis Ppt Powerpoint Presentation Outline Rules Cpb. This is an editable four stages graphic that deals with topics like Change Impact Analysis to help convey your message better graphically. This product is a premium product available for immediate download, and is 100 percent editable in Powerpoint. Download this now and use it in your presentations to impress your audience.
-
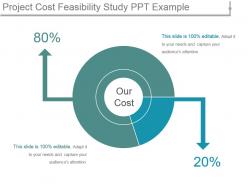 Project cost feasibility study ppt example
Presenting project cost feasibility study ppt example. This is a project cost feasibility study ppt example. This is a two stage process. The stages in this process are project cost feasibility study,our cost.
-
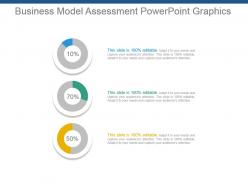 Business model assessment powerpoint graphics
Presenting business model assessment powerpoint graphics. This is a business model assessment powerpoint graphics. This is a three stage process. The stages in this process are business model, assessment, financial, presentation.
-
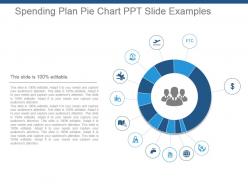 Spending plan pie chart ppt slide examples
Presenting spending plan pie chart ppt slide examples. This is a spending plan pie chart ppt slide examples. This is a twelve stage process. The stages in this process are spending plan, pie chart, presentation, process, icons.
-
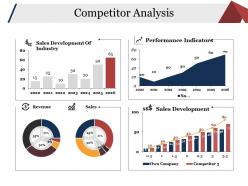 Competitor analysis powerpoint slides design
Presenting this set of slides with name - Competitor Analysis Powerpoint Slides Design. This is a four stage process. The stages in this process are Sales Development Of Industry, Performance Indicators, Revenue, Sales, Sales Development.
-
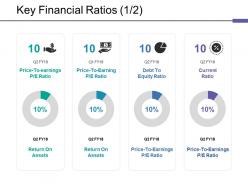 Key financial ratios ppt layouts ppt pictures
Presenting this set of slides with name - Key Financial Ratios Ppt Layouts Ppt Pictures. This is a four stage process. The stages in this process are Business, Finance, Management, Analysis, Strategy.
-
 Geographical reach by region powerpoint slides
Presenting this set of slides with name - Geographical Reach By Region Powerpoint Slides. This is a five stage process. The stages in this process are Map, Finance, Marketing, Planning, Location.
-
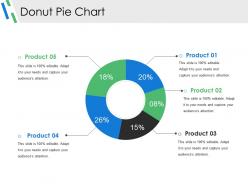 Donut pie chart presentation deck
Presenting this set of slides with name - Donut Pie Chart Presentation Deck. This is a five stage process. The stages in this process are Donut, Marketing, Strategy, Finance, Planning.
-
 Comparison ppt styles example
Presenting this set of slides with name - Comparison Ppt Styles Example. This is a two stage process. The stages in this process are Male, Female, Comparison, Business, Percentage.
-
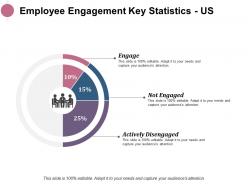 Employee engagement key statistics us actively disengaged ppt infographics display
Presenting this set of slides with name - Employee Engagement Key Statistics Us Actively Disengaged Ppt Infographics Display. This is a three stage process. The stages in this process are Actively Disengaged, Business, Marketing, Strategy, Finance.
-
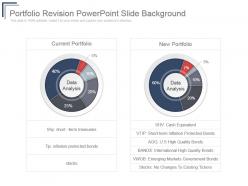 Portfolio revision powerpoint slide background
Presenting portfolio revision powerpoint slide background. This is a portfolio revision powerpoint slide background. This is a two stage process. The stages in this process are current portfolio, new portfolio.
-
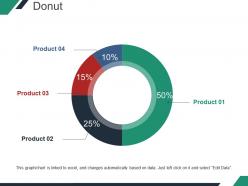 Donut ppt design template 2
Presenting donut ppt design template 2. This is a donut ppt design template 2. This is a four stage process. The stages in this process are percentage, finance, donut, business, product.
-
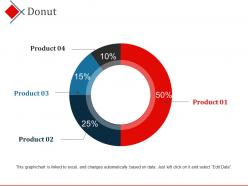 Donut powerpoint templates microsoft
Presenting donut powerpoint templates microsoft. This is a donut powerpoint templates microsoft. This is a four stage process. The stages in this process are donut, pie chart, business, marketing, process.
-
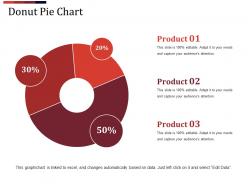 Donut pie chart powerpoint shapes template 2
Presenting donut pie chart powerpoint shapes template 2. This is a donut pie chart powerpoint shapes template 2. This is a three stage process. The stages in this process are percentage, finance, donut, business, product.
-
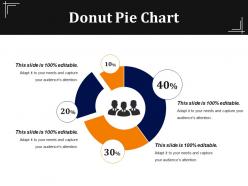 Donut pie chart presentation visual aids
Presenting donut pie chart presentation visual aids. This is a donut pie chart presentation visual aids. This is a four stage process. The stages in this process are business, marketing, strategy, planning, finance.
-
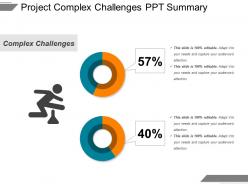 Project complex challenges ppt summary
Presenting project complex challenges PPT summary presentation slide. You can download this template and then save into another format such as JPG and PDF and can also display in standard and widescreen view. A user can alter this slide such as color, text, font type, font size and aspect ratio. This slide gets synced with Google Slides and edit it in PowerPoint. You may share this template with large segment because it has great pixel quality. You can insert the relevant content in text placeholder of this slide.
-
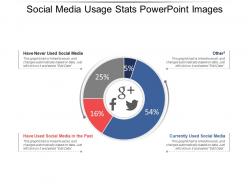 Social media usage stats powerpoint images
Presenting social media usage stats PowerPoint images PPT slide. The visuals available in the PowerPoint leave a long term impact on the viewers. The users of PPT can change the color theme, text and font. The presentation is compatible with software options, formats, and Google Slides. The visuals used are of high resolution and do not deter in quality irrespective of the screen size. The link is easy to download. This PPT is of much use to management students, teachers, and business professionals.
-
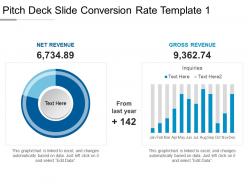 Pitch deck slide conversion rate template 1 ppt slides
Presenting Pitch Deck Slide Conversion Rate Template 1 PPT Slides. Customize the slide as per your choice. The template is entirely under your control. Change the position of the icon and modify the colors, background, font type, and font size. Save it in JPG and PDF file formats. Its compatibility with the Google Slides makes it easily accessible. Avail it in standard screen and widescreen size.
-
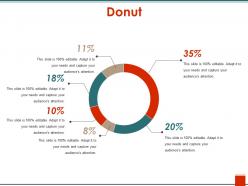 Donut ppt design
Presenting the Donut PPT Design PowerPoint slide. You can change the color, font size, font type and shapes of this PPT layout according to your needs. This PPT template is compatible with Google Slides and is available in both 4:3 and 16:9 aspect ratios. This ready to use PowerPoint presentation can be downloaded in various formats like PDF, JPG and PNG.
-
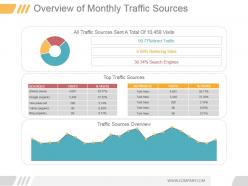 Overview of monthly traffic sources powerpoint graphics
Presenting overview of monthly traffic sources powerpoint graphics. This is a overview of monthly traffic sources powerpoint graphics. This is a three stage process. The stages in this process are all traffic sources sent a total of 10 458 visits, 50 77 percentage direct traffic, 9 89 percentage referring sites, 39 34 percentage search engines, sources, visits, direct none, google organic, vine press net, yahoo organic, bing organic, top traffic sources, keywords, visits, traffic source overview.
-
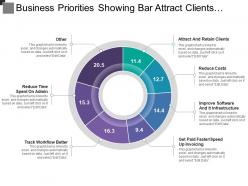 Business priorities showing bar attract clients reduce costs and track workflow
Presenting this set of slides with name - Business Priorities Showing Bar Attract Clients Reduce Costs And Track Workflow. This is a seven stage process. The stages in this process are Business Priorities, Business Goals, Business Objectives.
-
 Drill down country wise breakdown having bar graph and pie chart
Presenting this set of slides with name - Drill Down Country Wise Breakdown Having Bar Graph And Pie Chart. This is a three stage process. The stages in this process are Drill Down, Hierarchy, Top Downwards.
-
 Wholesale and retail kpi dashboard showing total stores by type employee turnover by city
Presenting the KPI dashboard presentation template. This PPT template is 100% editable in MS PowerPoint and is designed professionally. You can edit the objects in the slide like font size and font color very easily. This presentation template is 100% compatible with Google Slide and can be saved in JPG or PDF file format easily. Click on the download tab to download this presentation template.
-
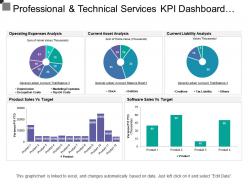 Professional and technical services kpi dashboard showing current asset and liabilities
Presenting this set of slides with name - Professional And Technical Services Kpi Dashboard Showing Current Asset And Liabilities. This is a five stage process. The stages in this process are Professional And Technical Services, Services Management, Technical Management.
-
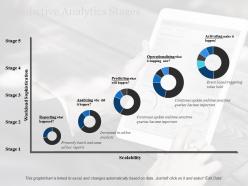 Predictive analytics stages activating ppt professional layout ideas
Presenting this set of slides with name - Predictive Analytics Stages Activating Ppt Professional Layout Ideas. This is a five stage process. The stages in this process are Workload Sophistication, Donut, Process, Finance, Planning.
-
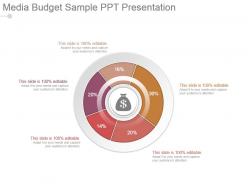 Media budget sample ppt presentation
Presenting media budget sample ppt presentation. Presenting media budget sample ppt presentation. This is a media budget sample ppt presentation. This is a five stage process. The stages in this process are business, finance, process, strategy, marketing, management.
-
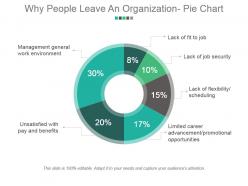 Why people leave an organization pie chart powerpoint slide deck samples
Presenting why people leave an organization pie chart powerpoint slide deck samples. This is a why people leave an organization pie chart powerpoint slide deck samples. This is a six stage process. The stages in this process are management general work environment, unsatisfied with pay and benefits, lack of fit to job, lack of job security, lack of flexibility scheduling, limited career advancement promotional opportunities.
-
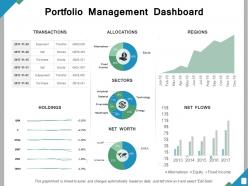 Portfolio management dashboard ppt powerpoint presentation file guide
Presenting this set of slides with name - Portfolio Management Dashboard Ppt Powerpoint Presentation File Guide. This is a five stage process. The stages in this process are Percentage, Product, Management, Marketing, Business.
-
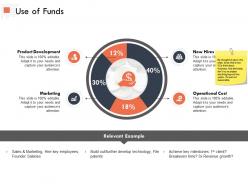 Use of funds product development ppt powerpoint presentation outline templates
Presenting this set of slides with name - Use Of Funds Product Development Ppt Powerpoint Presentation Outline Templates. This is a four stage process. The stages in this process are Product Development, Marketing, New Hires, Revelation Example, Planning.
-
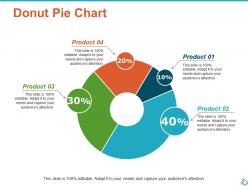 Donut pie chart marketing ppt show infographic template
Presenting this set of slides with name - Donut Pie Chart Marketing Ppt Show Infographic Template. This is a four stage process. The stages in this process are Finance, Analysis, Business, Investment, Marketing.
-
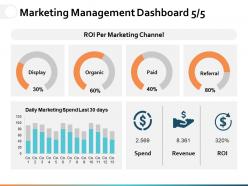 Marketing management dashboard snapshot ppt powerpoint presentation file graphics pictures
Presenting this set of slides with name - Marketing Management Dashboard Snapshot Ppt Powerpoint Presentation File Graphics Pictures. This is a three stage process. The stages in this process are Percentage, Product, Business, Management, Marketing.


