- Sub Categories
-
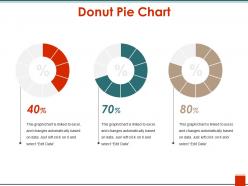 Donut pie chart ppt background template
Presenting Donut Pie Chart PPT Background Template. The template can be downloaded quickly. You can make the changes as per your needs. This template is 100% editable. The colors, texts, fonts, images can be altered according to the theme of the organization. You can easily save the PPT in any format like PDF, JPG, and PNG. It is Google Slides friendly. It is available in both the slide design sizes- 4:3 and 16:9.
-
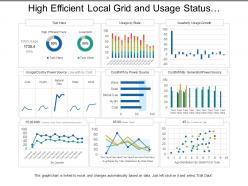 High efficient local grid and usage status utilities dashboard
Presenting this set of slides with name - High Efficient Local Grid And Usage Status Utilities Dashboard. This is a three stage process. The stages in this process are Utilities, Use, Advantage.
-
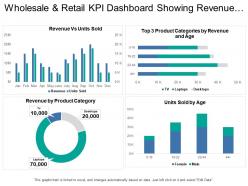 Wholesale and retail kpi dashboard showing revenue vs units sold
Presenting the retail business template for PowerPoint. This PowerPoint template is 100% editable in PowerPoint and is professionally designed. You can edit the objects in the slide like font size and font color very easily. This presentation slide is 100% compatible with Google Slide and can be saved in JPG or PDF file format without any fuss. Fast download this at the click of the button.
-
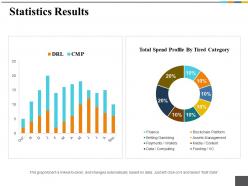 Statistics results ppt inspiration gallery
Presenting statistics results PowerPoint presentation slide. This presentation has been designed professionally and is fully editable. You can personalize font size, font type, colors, and even the background. This Template is obedient with Google Slide and can be saved in JPG or PDF format without any hassle. Fast download at the click of the button.
-
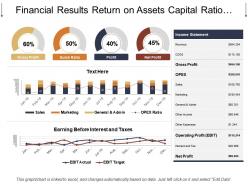 Financial results return on assets capital ratio ppt design
Exhibiting financial results return on assets capital ratio PPT design. Fully amendable content as color, text and shape are easily editable. Easy to add business name, icon or title. Awesome picture quality as do not break when anticipated on large screen. Easy and quick download with saving options. The PowerPoint slide can be presented in standard and widescreen view. Preference to download with different nodes and stages. PPT diagram can be shared with Google slides.
-
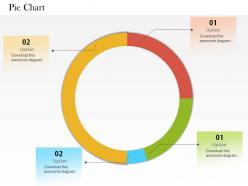 0514 data driven circular pie chart powerpoint slides
We are proud to present our 0514 data driven circular pie chart powerpoint slides. This Business Power Point template is designed with data driven circular pie chart to highlight the result in any business presentation.
-
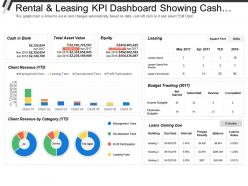 Rental and leasing kpi dashboard showing cash in bank total asset value equity
Presenting this set of slides with name - Rental And Leasing Kpi Dashboard Showing Cash In Bank Total Asset Value Equity. This is a three stage process. The stages in this process are Rental And Leasing, Dealing And Leasing, Rental And Engage.
-
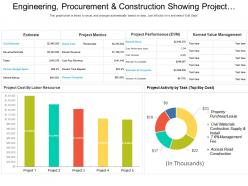 Engineering procurement and construction showing project metrics and activity
Presenting this set of slides with name - Engineering Procurement And Construction Showing Project Metrics And Activity. This is a three stage process. The stages in this process are Engineering, Procurement And Construction, Construction Management, Engineering, Purchasing And Construction .
-
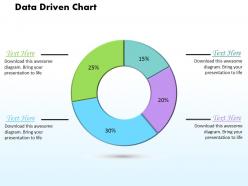 0414 donut chart business illuastration powerpoint graph
We are proud to present our 0414 donut chart business illuastration powerpoint graph. Tee off with our 0414 Donut Chart Business Illuastration Powerpoint Graph Powerpoint Templates. They will reward you with a hole in one. Launch your ideas with our 0414 Donut Chart Business Illuastration Powerpoint Graph Powerpoint Templates. Take your audience along on a magnificent flight.
-
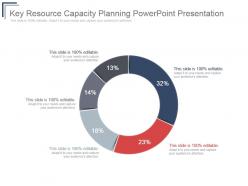 Key resource capacity planning powerpoint presentation
Presenting key resource capacity planning powerpoint presentation. This is a key resource capacity planning powerpoint presentation. This is a five stage process. The stages in this process are success, business, marketing, presentation, management.
-
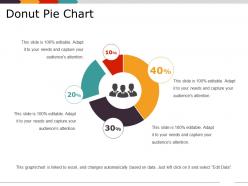 Donut pie chart ppt slide examples
Presenting Donut Pie Chart PPT Slide Examples template. The layout can be downloaded and saved in general image or document formats such as JPEG and PDF. The slide supports both the standard(4:3) and widescreen(16:9) aspect ratios. It is also compatible with Google Slides and other related software. Modify the style, size, and the background of the slides. High-quality graphics retain the quality of images.
-
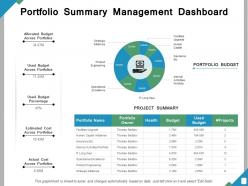 Portfolio summary management dashboard ppt powerpoint presentation file templates
Presenting this set of slides with name - Portfolio Summary Management Dashboard Ppt Powerpoint Presentation File Templates. This is a two stage process. The stages in this process are Percentage, Product, Management, Marketing, Business.
-
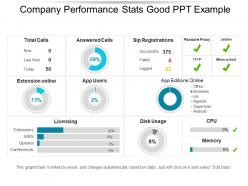 Company performance stats good ppt example
Presenting company performance stats good PPT example. This layout is fully compatible with Google Slides and data driven. User can edit the data in linked excel sheet and graphs and charts gets customized accordingly. Easy to put in company logo, trademark or name; accommodate words to support the key points. Images do no distort out even when they are projected on large screen. Adjust colors, text and fonts as per your business requirements. . This template is suitable for marketing, sales persons, business managers and entrepreneurs.
-
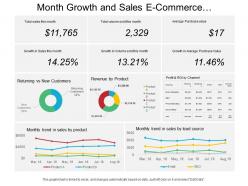 Month growth and sales e commerce dashboard
Presenting this set of slides with name - Month Growth And Sales E Commerce Dashboard. This is a seven stage process. The stages in this process are Mercantilism, Commercialism, Ecommerce.
-
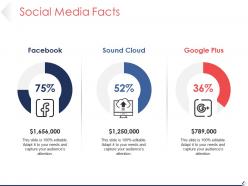 Social media facts ppt presentation
Presenting social media facts ppt presentation. This is a social media facts ppt presentation. This is a three stage process. The stages in this process are facebook, sound cloud, google plus, percentage, finance.
-
 Entertainment recreation and arts kpi dashboard average annual expenditure and time spent
Presenting this set of slides with name - Entertainment Recreation And Arts Kpi Dashboard Average Annual Expenditure And Time Spent. This is a three stage process. The stages in this process are Entertainment, Recreation And Arts, Attractions, Culture, Entertainment.
-
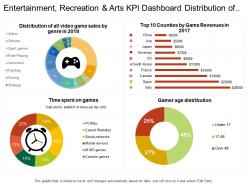 Entertainment recreation and arts kpi dashboard distribution of video game sales
Presenting this set of slides with name - Entertainment Recreation And Arts Kpi Dashboard Distribution Of Video Game Sales. This is a four stage process. The stages in this process are Entertainment, Recreation And Arts, Attractions, Culture, Entertainment.
-
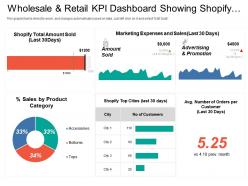 Wholesale and retail kpi dashboard showing shopify total amount sold percentage sales by product category
Presenting the retail business presentation template for PowerPoint. This PowerPoint template is 100% editable in PowerPoint and is professionally designed. You can edit the objects in the slide like font size and font color very easily. This presentation template is 100% compatible with Google Slide and can be saved in JPG or PDF file format without any fuss. Fast download this at the click of the button.
-
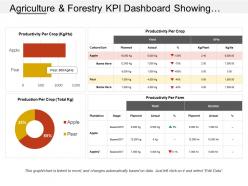 Agriculture and forestry kpi dashboard showing productivity per crop and farm
Pre-designed agriculture and forestry KPI dashboard showing productivity per crop and farm PPT template. Beneficial for managers, professors, marketers, etc. Flexible option for conversion in PDF or JPG formats. Useful for making business plan and strategies. Can also be used with Google slides. Replace the images, text and the content in the slide design. Change the size, style and orientation of the slides. Use your company’s name or brand name to make it your own presentation template.
-
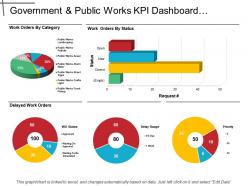 Government and public works kpi dashboard showing work order by category and status
Presenting the KPI dashboard presentation layout. This dashboard template is completely customizable and is professionally designed. You can modify the objects in the template like font color and font size without going through any fuss. This presentation slide is fully compatible with Google Slide and can be saved in JPG or PDF file format without any hassle. Fast download this at the click of the button.
-
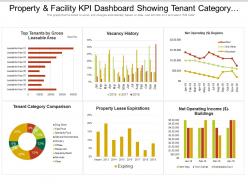 Property and facility kpi dashboard showing tenant category comparison and vacancy history
Get a chance to explore, property and facility KPI dashboard showing tenant category comparison and vacancy history PowerPoint Presentation Slide. This Presentation has been designed by professionals and is fully editable. You can remodel the font size, font type, colors, and even the background. This Template is friendly with Google Slide and can be saved in JPG or PDF format without any chaos created. Fast download at the click of the button.
-
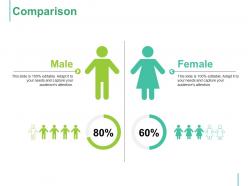 Comparison vs male female ppt summary graphics template
Presenting this set of slides with name - Comparison Vs Male Female Ppt Summary Graphics Template. This is a two stage process. The stages in this process are Comparison, Male, Female, Marketing, Strategy, Business.
-
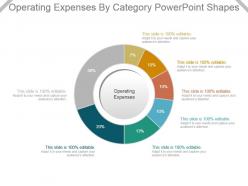 Operating expenses by category powerpoint shapes
Presenting operating expenses by category powerpoint shapes. This is a operating expenses by category powerpoint shapes. This is a seven stage process. The stages in this process are operating expenses.
-
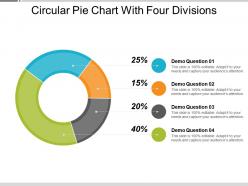 Circular pie chart with four divisions
Presenting circular pie chart with four divisions. This is a circular pie chart with four divisions. This is a four stage process. The stages in this process are customer insight, consumer insight, customer experience.
-
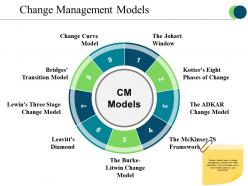 Change management models powerpoint slide clipart
Presenting change management models powerpoint slide clipart. This is a change management models powerpoint slide clipart. This is a nine stage process. The stages in this process are change curve model, cm models, bridges transition model, the adkar change model.
-
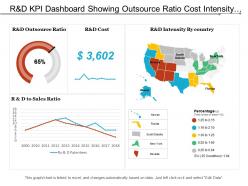 R and d kpi dashboard showing outsource ratio cost intensity by country and r and d to sales ratio
Presenting this set of slides with name - R And D Kpi Dashboard Showing Outsource Ratio Cost Intensity By Country And R And D To Sales Ratio. This is a four stage process. The stages in this process are R And D, Research And Development, Research And Technological Development.
-
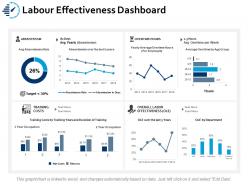 Labour effectiveness dashboard snapshot ppt portfolio format
Presenting this set of slides with name - Labour Effectiveness Dashboard Snapshot Ppt Portfolio Format. This is a four stage process. The stages in this process are Business, Management, Strategy, Sales, Marketing.
-
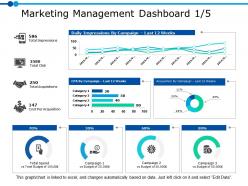 Marketing management dashboard 1 5 ppt powerpoint presentation gallery background image
Presenting this set of slides with name - Marketing Management Dashboard 1 5 Ppt Powerpoint Presentation Gallery Background Image. This is a four stage process. The stages in this process are Business, Management, Strategy, Analysis, Marketing.
-
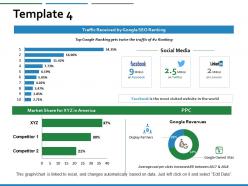 Market share revenue ppt powerpoint presentation inspiration professional
Presenting this set of slides with name - Market Share Revenue Ppt Powerpoint Presentation Inspiration Professional. This is a four stages process. The stages in this process are Bar Graph, Finance, Marketing, Business, Analysis.
-
 Comparison powerpoint slide designs
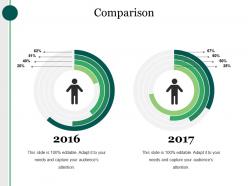
Presenting this set of slides with name - Comparison Powerpoint Slide Designs. This is a two stage process. The stages in this process are Comparison, Management, Business, Marketing, Planning.
-
 Big data business benefits pie charts sample of ppt presentation
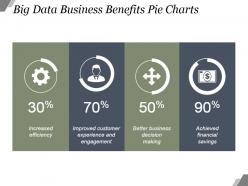
Presenting big data business benefits pie charts sample of ppt presentation. This is a big data business benefits pie charts sample of ppt presentation. This is a four stage process. The stages in this process are increased efficiency, improved customer experience and engagement, better business decision making, achieved financial savings.
-
 Comparison ppt template
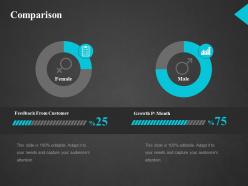
Presenting this set of slides with name - Comparison Ppt Template. This is a two stage process. The stages in this process are Comparison, Female, Male.
-
 Comparison presentation visual aids
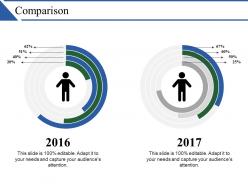
Presenting this set of slides with name - Comparison Presentation Visual Aids. This is a three stage process. The stages in this process are male, female, donut, finance, planning.
-
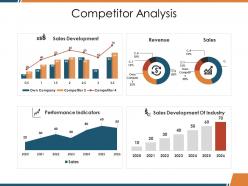 Competitor analysis ppt inspiration
Presenting this set of slides with name - Competitor Analysis Ppt Inspiration. This is a four stage process. The stages in this process are Performance Indicators, Sales Development, Revenue, Sales, Sales Development Of Industry.
-
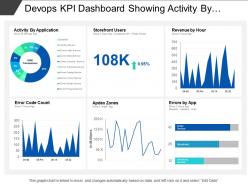 Devops kpi dashboard showing activity by application and errors by app
Presenting this set of slides with name - Devops Kpi Dashboard Showing Activity By Application And Errors By App. This is a six stage process. The stages in this process are Development And Operations, Devops.
-
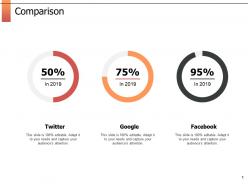 Comparison marketing management ppt powerpoint presentation outline inspiration
Presenting this set of slides with name - Comparison Marketing Management Ppt Powerpoint Presentation Outline Inspiration. This is a three stages process. The stages in this process are Finance, Marketing, Management, Investment, Analysis.
-
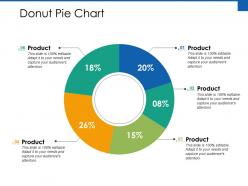 Donut pie chart finance ppt powerpoint presentation file backgrounds
Presenting this set of slides with name - Donut Pie Chart Finance Ppt Powerpoint Presentation File Backgrounds. This is an editable five stages graphic that deals with topics like Donut Pie Chart, Product, Percentage, Business, Marketing to help convey your message better graphically. This product is a premium product available for immediate download, and is 100 percent editable in Powerpoint. Download this now and use it in your presentations to impress your audience.
-
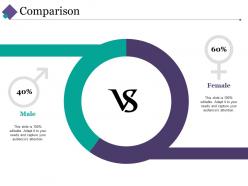 Comparison ppt layouts graphics
Introducing comparison PPT layout graphics design. Hasty download and easy to share in JPG and PDF. Tailor the design with commerce name, logo, icon, image and tagline. High quality PowerPoint slide available with adjustable options as color, text and font can be adjusted at any stage as per your requirement. Option to share presentation graphic in standard and widescreen display view. PPT template is accessible with different nodes and stages.
-
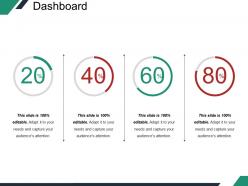 Dashboard snapshot powerpoint themes template 2
Presenting dashboard snapshot powerpoint themes template 2. This is a combo chart powerpoint slides template 2. This is a four stage process. The stages in this process are percentage, finance, donut, business.
-
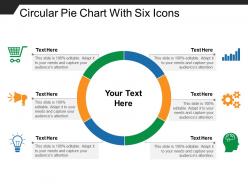 Circular pie chart with six icons
Presenting circular pie chart with six icons. This is a circular pie chart with six icons. This is a six stage process. The stages in this process are customer insight, consumer insight, customer experience.
-
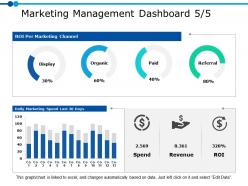 Marketing management dashboard 5 5 ppt powerpoint presentation gallery graphics
Presenting this set of slides with name - Marketing Management Dashboard 5 5 Ppt Powerpoint Presentation Gallery Graphics. This is a three stage process. The stages in this process are Business, Management, Strategy, Analysis, Marketing.
-
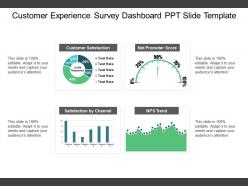 Customer experience survey dashboard ppt slide template
Presenting customer experience survey dashboard ppt slide template. This is a customer experience survey dashboard ppt slide template. This is a four stage process. The stages in this process are survey, forecasting, statistics.
-
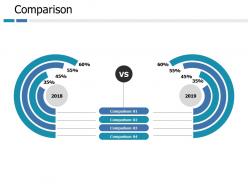 Comparison business ppt portfolio slide portrait
Presenting this set of slides with name - Comparison Business Ppt Portfolio Slide Portrait. This is a two stage process. The stages in this process are Comparison, Planning, Marketing, Finance, Strategy.
-
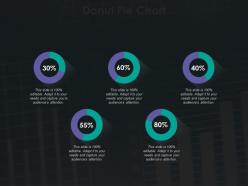 Donut pie chart ppt summary guidelines
Presenting this set of slides with name - Donut Pie Chart Ppt Summary Guidelines. This is a five stage process. The stages in this process areBusiness, Management, Strategy, Analysis, Marketing.
-
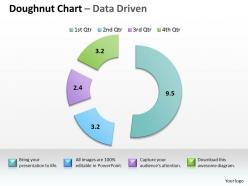 Data driven completion in project management powerpoint slides
We are proud to present our data driven completion in project management powerpoint slides. Add Color To Your Speech With Our Data Driven Completion In Project Management Powerpoint Slides Power Point Templates. Your Presentation Will Leave Your Audience Speechless. Experience Excellence With Our Data Driven Completion In Project Management Powerpoint Slides Power Point Templates. They Will Take Your Breath Away.
-
 Market cost distribution pie chart ppt slide
Presenting market cost distribution pie chart ppt slide. This is a market cost distribution pie chart ppt slide. This is a seven stage process. The stages in this process are purchases, wages, other, rent and utilities, marketing, profit, depreciation.
-
 Comparison ppt slides
Presenting this set of slides with name - Comparison Ppt Slides. This is a two stage process. The stages in this process are Comparison, Male, Female.
-
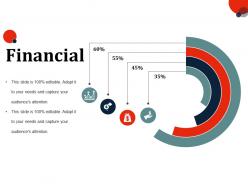 Financial ppt slides example introduction
Presenting this set of slides with name - Financial Ppt Slides Example Introduction. This is a four stage process. The stages in this process are Finance, Business, Marketing, Percentage, Icons.
-
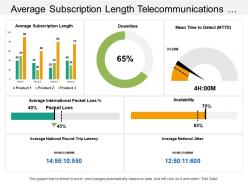 Average subscription length telecommunications dashboard
Presenting this set of slides with name - Average Subscription Length Telecommunications Dashboard. Pre-designed presentation slide can be shared easily as comes in both standard and widescreen view. Fully amendable PowerPoint design can be modified as per your preference. Picture quality is perfect as pixels remain same even when you share with large number of audiences. PPT template can be downloaded with different nodes and stages and well accustomed with all the software’s options such as JPG and PDF and even with Google slides.
-
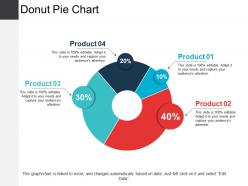 Donut pie chart ppt presentation examples
Presenting Donut Pie Chart PPT Presentation Examples. You can alter the font size, font type, font color, and shape used according to your needs as this PPT layout is 100% customizable. This PowerPoint template is Google Slides compatible and is easily accessible. This easy to download PPT theme can be easily opened and saved in various formats like JPG, PDF, and PNG.
-
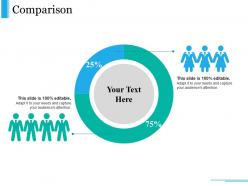 Comparison presentation pictures
Presenting this set of slides with name - Comparison Presentation Pictures. This is a two stage process. The stages in this process are Business, Marketing, Finance, Compare, Analysis.
-
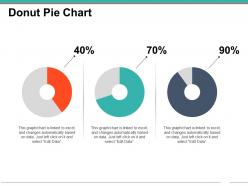 Donut pie chart powerpoint slide clipart
Presenting donut pie chart powerpoint slide clipart. This is a donut pie chart powerpoint slide clipart. This is a three stage process. The stages in this process are business, marketing, process, percentage, strategy.
-
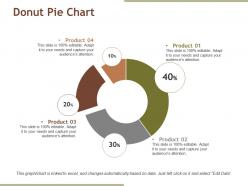 Donut pie chart ppt diagrams
Presenting this set of slides with name - Donut Pie Chart Ppt Diagrams. This is a four stage process. The stages in this process are Donut, Finance, Marketing, Planning, Analysis.
-
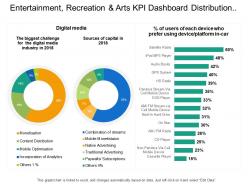 Entertainment recreation and arts kpi dashboard showing digital media sources of capital
Presenting this set of slides with name - Entertainment Recreation And Arts Kpi Dashboard Showing Digital Media Sources Of Capital. This is a three stage process. The stages in this process are Entertainment, Recreation And Arts, Attractions, Culture, Entertainment.
-
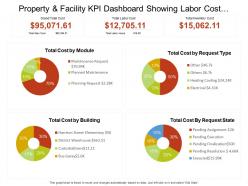 Property and facility kpi dashboard showing labor cost and inventory cost
Presenting Property And Facility KPI Dashboard Showing Labor Cost And Inventory Cost PPT slide. The pie chart dashboard PowerPoint template designed professionally by the team of SlideTeam to present the factors that contributed to the total cost. The pie chart value gets edited as a user can link it with the Excel Sheet. The Pie Chart of labor cost dashboard slide is customizable in PowerPoint. The Inventory Cost Dashboard template is also compatible with Google Slide. A user may do alteration in the font size, font type, color and dimensions of the pie chart to present the desired total cost.
-
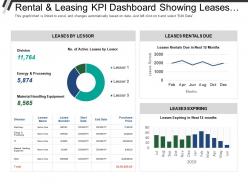 Rental and leasing kpi dashboard showing leases expiring leases by lessor
Presenting this set of slides with name - Rental And Leasing Kpi Dashboard Showing Leases Expiring Leases By Lessor. This is a four stage process. The stages in this process are Rental And Leasing, Dealing And Leasing, Rental And Engage.
-
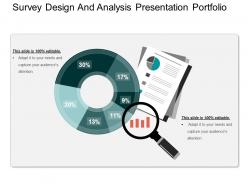 Survey design and analysis presentation portfolio
Presenting survey design and analysis presentation portfolio which is 100% editable. This PPT slide is excel linked chart that is; data driven and easy to customize and enables you to personalize it as per your own criteria. The presentation slide is fully compatible with Google slides, multiple format and software options. In case of any assistance, kindly take instructions from our presentation design services and it is easy to download in a very short span of time. The images, layouts, designs are of high quality and ensures quality in widescreen.
-
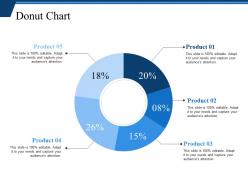 Donut chart ppt sample file
Presenting this set of slides with name - Donut Chart Ppt Sample File. This is a five stage process. The stages in this process are Donut Chart, Finance, Marketing, Strategy, Analysis.
-
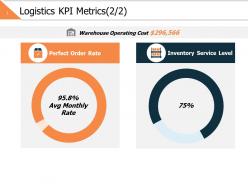 Logistics kpi metrics 2 2 ppt powerpoint presentation file format
Presenting this set of slides with name - Logistics Kpi Metrics 2 2 Ppt Powerpoint Presentation File Format. This is a two stage process. The stages in this process are Business, Management, Strategy, Analysis, Finance.
-
 Key resource capacity planning power point shapes
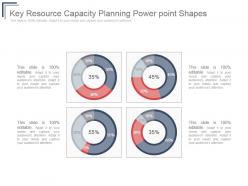
Presenting key resource capacity planning power point shapes. This is a key resource capacity planning power point shapes. This is a four stage process. The stages in this process are success, business, marketing, presentation, management.


