Charts, Graphs PowerPoint Designs, Presentation Charts Designs & PPT Graphics
- Sub Categories
-
- Arrows and Targets
- Bullet and Text Slides
- Charts and Graphs
- Circular Cycle Diagrams
- Concepts and Shapes
- Custom Flat Designs
- Dashboards and Measuring
- Flow Process
- Funnels
- Gears
- Growth
- Harvey Balls
- Idea Innovation and Light Bulbs
- Leadership
- Linear Process Diagrams
- Magnifying Glass
- Misc Other Graphics
- Opportunity and Handshake
- Organization Charts
- Puzzles
- Pyramids
- Roadmaps and Timelines
- Silhouettes
- Steps
- Strategic Planning Analysis
- SWOT Analysis
- Tables and Matrix
- Teamwork
- Technology and Communication
- Venn Diagrams
- Visuals and Illustrations
-
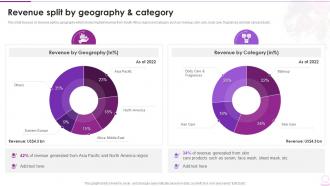 Revenue Split By Geography And Category Cosmetic And Beauty Products Company Profile
This slide focuses on revenue split by geography which shows highest revenue from South Africa region and category such as makeup, skin care, body care, fragrances and hair care products. Present the topic in a bit more detail with this Revenue Split By Geography And Category Cosmetic And Beauty Products Company Profile. Use it as a tool for discussion and navigation on Revenue Split By Geography And Category. This template is free to edit as deemed fit for your organization. Therefore download it now.
-
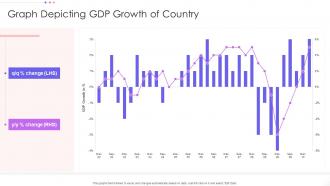 Graph Depicting GDP Growth Of Country
Presenting our well structured Graph Depicting GDP Growth Of Country. The topics discussed in this slide are Graph Depicting, GDP Growth. This is an instantly available PowerPoint presentation that can be edited conveniently. Download it right away and captivate your audience.
-
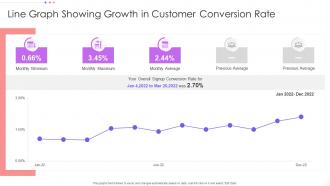 Line Graph Showing Growth In Customer Conversion Rate
Presenting our well structured Line Graph Showing Growth In Customer Conversion Rate. The topics discussed in this slide are Growth, Customer Conversion Rate. This is an instantly available PowerPoint presentation that can be edited conveniently. Download it right away and captivate your audience.
-
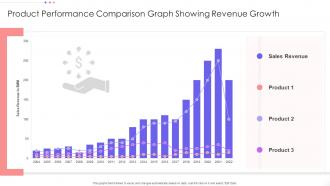 Product Performance Comparison Graph Showing Revenue Growth
Introducing our Product Performance Comparison Graph Showing Revenue Growth set of slides. The topics discussed in these slides are Sales Revenue, Revenue Growth, Product Performance Comparison. This is an immediately available PowerPoint presentation that can be conveniently customized. Download it and convince your audience.
-
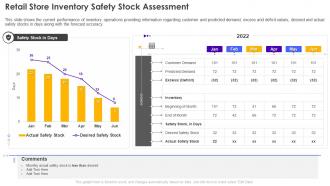 F256 Retail Store Inventory Safety Stock Assessment Retail Store Operations Performance Assessment
This slide shows the current performance of inventory operations providing information regarding customer and predicted demand, excess and deficit values, desired and actual safety stocks in days along with the forecast accuracy. Deliver an outstanding presentation on the topic using this F256 Retail Store Inventory Safety Stock Assessment Retail Store Operations Performance Assessment. Dispense information and present a thorough explanation of Assessment, Performance, Operations using the slides given. This template can be altered and personalized to fit your needs. It is also available for immediate download. So grab it now.
-
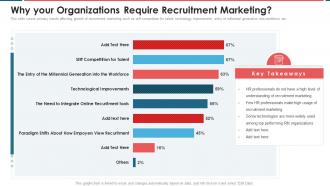 Why Your Organizations Require Recruitment Marketing Recruitment Marketing
This slide covers primary trends affecting growth of recruitment marketing such as stiff competition for talent, technology improvement, entry of millennial generation into workforce etc. Deliver an outstanding presentation on the topic using this Why Your Organizations Require Recruitment Marketing Recruitment Marketing. Dispense information and present a thorough explanation of Organizations, Recruitment, Marketing using the slides given. This template can be altered and personalized to fit your needs. It is also available for immediate download. So grab it now.
-
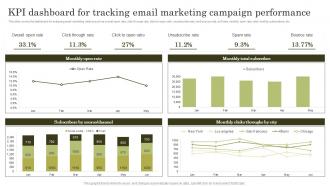 Top Marketing Analytics Trends Kpi Dashboard For Tracking Email Marketing Campaign Performance
This slide covers the dashboard for analysing email marketing metrics such as overall open rate, click through rate, click to open ratio, unsubscribe rate, hard bounce rate, soft rate, monthly open rate, total monthly subscribers, etc. Deliver an outstanding presentation on the topic using this Top Marketing Analytics Trends Kpi Dashboard For Tracking Email Marketing Campaign Performance . Dispense information and present a thorough explanation of Dashboard, Email, Marketing using the slides given. This template can be altered and personalized to fit your needs. It is also available for immediate download. So grab it now.
-
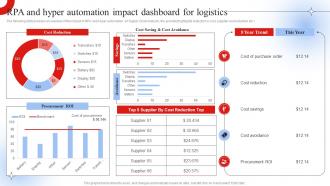 RPA And Hyper Automation Impact Dashboard Robotic Process Automation Impact On Industries
The following slide provides an overview of the impact of RPA and Hyper automation on Supply Chain Industry, the provided highlights reduction in cost, supplier cost reduction etc. Deliver an outstanding presentation on the topic using this RPA And Hyper Automation Impact Dashboard Robotic Process Automation Impact On Industries. Dispense information and present a thorough explanation of Automation, Impact, Logistics using the slides given. This template can be altered and personalized to fit your needs. It is also available for immediate download. So grab it now.
-
 RPA And Hyperautomation Impact Dashboard Robotic Process Automation Impact On Industries
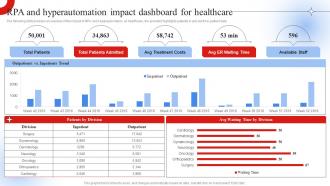
The following slide provides an overview of the impact of RPA and Hyperautomation on healthcare , the provided highlights patients in and out time, patient data Present the topic in a bit more detail with this RPA And Hyperautomation Impact Dashboard Robotic Process Automation Impact On Industries. Use it as a tool for discussion and navigation on Impact, Healthcare, Patients. This template is free to edit as deemed fit for your organization. Therefore download it now.
-
 Step By Step Guide Create Marketing Analytics Dashboard To Evaluate Social Media Campaign Strategy SS
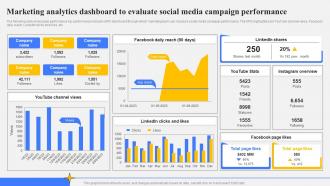
The following slide showcases performance key performance indicator KPI dashboard through which marketing team can measure social media campaign performance. The KPIs highlighted are YouTube channel views, Facebook daily reach, LinkedIn clicks and likes, etc. Present the topic in a bit more detail with this Step By Step Guide Create Marketing Analytics Dashboard To Evaluate Social Media Campaign Strategy SS. Use it as a tool for discussion and navigation on Marketing Analytics, Dashboard, Social Media, Campaign Performance. This template is free to edit as deemed fit for your organization. Therefore download it now.
-
 Usage Based Revenue Model Our Financial Performance Over The Year
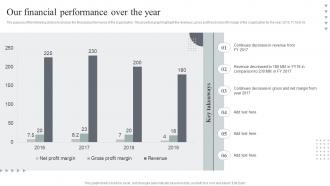
The purpose of the following slide is to analyze the financial performance of the organization. The provided graph highlight the revenues, gross profit and net profit margin of the organization for the year 2016,17,18 and 19. Deliver an outstanding presentation on the topic using this Usage Based Revenue Model Our Financial Performance Over The Year. Dispense information and present a thorough explanation of Our Financial Performance, Gross Profit, Net Profit Margin using the slides given. This template can be altered and personalized to fit your needs. It is also available for immediate download. So grab it now.
-
 Marketing Challenges Faced By Early Stage Startup Step By Step Guide Create Marketing Strategy SS
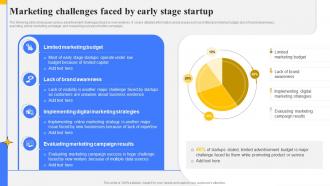
The following slide showcases various advertisement challenges faced by new ventures. It covers detailed information about issues such as limited promotional budget, lack of brand awareness, executing online marketing campaign, and measuring success of online campaign. Deliver an outstanding presentation on the topic using this Marketing Challenges Faced By Early Stage Startup Step By Step Guide Create Marketing Strategy SS. Dispense information and present a thorough explanation of Marketing Budget, Brand Awareness, Digital Marketing Strategies using the slides given. This template can be altered and personalized to fit your needs. It is also available for immediate download. So grab it now.
-
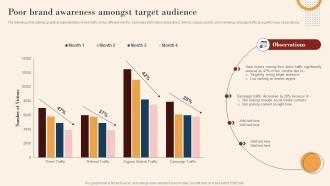 Poor Brand Awareness Amongst Target Audience Identifying Marketing Opportunities Mkt Ss V
The following slide outlines graphical representation of web traffic in four different months. It provides information about direct, referral, organic search, and marketing campaign traffic along with major observations. Present the topic in a bit more detail with this Poor Brand Awareness Amongst Target Audience Identifying Marketing Opportunities Mkt Ss V. Use it as a tool for discussion and navigation on Visitors, Significantly, Campaign. This template is free to edit as deemed fit for your organization. Therefore download it now.
-
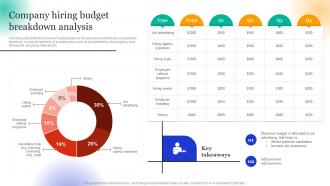 Employee Hiring For Selecting Company Hiring Budget Breakdown Analysis
Following slide exhibits overview of budget spent on hiring employees that help companies to keep track on overall expenses. It includes types such as job advertising, hiring agency cost, hiring tools, employee referrals etc. Deliver an outstanding presentation on the topic using this Employee Hiring For Selecting Company Hiring Budget Breakdown Analysis. Dispense information and present a thorough explanation of Job Advertising, Hiring Tools using the slides given. This template can be altered and personalized to fit your needs. It is also available for immediate download. So grab it now.
-
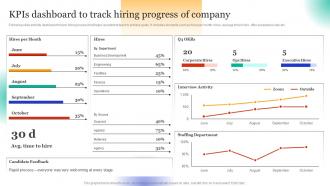 Employee Hiring For Selecting Kpis Dashboard To Track Hiring Progress Of Company
Following slide exhibits dashboard to track hiring process that helps recruitment team to achieve goals. It includes elements such as hires per month, hires, average time to hire, offer acceptance rate etc. Deliver an outstanding presentation on the topic using this Employee Hiring For Selecting Kpis Dashboard To Track Hiring Progress Of Company. Dispense information and present a thorough explanation of Feedback, Welcoming, Rapid Process using the slides given. This template can be altered and personalized to fit your needs. It is also available for immediate download. So grab it now.
-
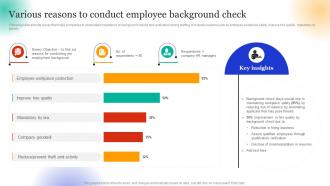 Employee Hiring For Selecting Various Reasons To Conduct Employee Background Check
Following slide exhibits survey that helps companies to understand importance of background checks and verification during staffing. It includes reasons such as employee workplace safety, improve hire quality, mandatory by law etc. Deliver an outstanding presentation on the topic using this Employee Hiring For Selecting Various Reasons To Conduct Employee Background Check. Dispense information and present a thorough explanation of Maintaining, Violence, Workplace using the slides given. This template can be altered and personalized to fit your needs. It is also available for immediate download. So grab it now.
-
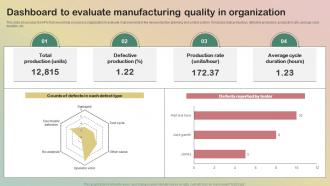 Dashboard To Evaluate Manufacturing Quality In Organization Quality Management System
This slide showcases the KPIs that would help a business organization to evaluate improvements in the new production planning and control system. It includes total production, defective production, production rate, average cycle duration, etc.Present the topic in a bit more detail with this Dashboard To Evaluate Manufacturing Quality In Organization Quality Management System. Use it as a tool for discussion and navigation on Total Production, Defective Production, Production Rate. This template is free to edit as deemed fit for your organization. Therefore download it now.
-
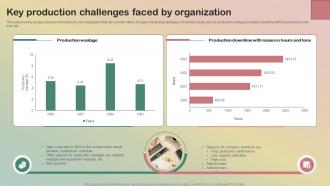 Key Production Challenges Faced By Organization Production Quality Management System
This slide provides glimpse about problems faced by the organization that can provide metrics to target and develop strategies. It includes issues such as production wastage, production downtime with losses in hours and tons, etc.Present the topic in a bit more detail with this Key Production Challenges Faced By Organization Production Quality Management System. Use it as a tool for discussion and navigation on Production Wastage, Production Downtime, Losses Tons. This template is free to edit as deemed fit for your organization. Therefore download it now.
-
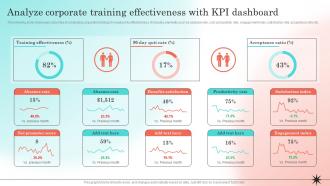 Developing Strategic Employee Analyze Corporate Training Effectiveness With KPI Dashboard
The following slide showcases outcomes of conducting corporate trainings to measure its effectiveness. It includes elements such as absence rate, cost, productivity rate, engagement index, satisfaction rate, acceptance ratio etc. Present the topic in a bit more detail with this Developing Strategic Employee Analyze Corporate Training Effectiveness With KPI Dashboard. Use it as a tool for discussion and navigation on Analyze Corporate, Training Effectiveness, KPI Dashboard. This template is free to edit as deemed fit for your organization. Therefore download it now.
-
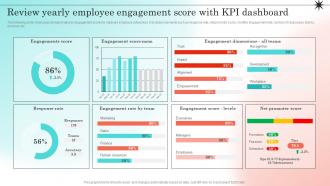 Developing Strategic Employee Review Yearly Employee Engagement Score With KPI Dashboard
The following slide showcases annual employee engagement scores to measure employee activeness. It includes elements such as response rate, net promotor score, monthly engagement rate, number of responses, teams, accuracy etc. Present the topic in a bit more detail with this Developing Strategic Employee Review Yearly Employee Engagement Score With KPI Dashboard. Use it as a tool for discussion and navigation on Employee Engagement, Score With KPI Dashboard, Engagement Dimensions. This template is free to edit as deemed fit for your organization. Therefore download it now.
-
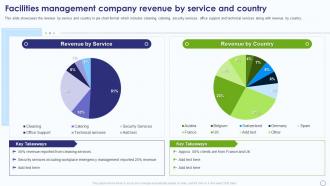 Facilities Management Company Revenue By Service And Country Ppt Ideas Infographics
This slide showcases the revenue by service and country in pie chart format which includes cleaning, catering, security services, office support and technical services along with revenue by country. Present the topic in a bit more detail with this Facilities Management Company Revenue By Service And Country Ppt Ideas Infographics. Use it as a tool for discussion and navigation on Revenue By Service, Revenue By Country, Emergency Management, Facilities Management. This template is free to edit as deemed fit for your organization. Therefore download it now.
-
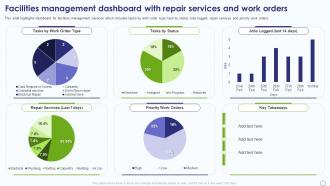 Facility Management Company Profile Facilities Management Dashboard With Repair Services
This slide highlights dashboard for facilities management services which includes tasks by work order type, task by status, lobs logged, repair services and priority work orders. Present the topic in a bit more detail with this Facility Management Company Profile Facilities Management Dashboard With Repair Services. Use it as a tool for discussion and navigation on Facilities Management, Dashboard, Repair Services, Work Orders. This template is free to edit as deemed fit for your organization. Therefore download it now.
-
 Cybersecurity Risk Assessment Program Cyber Attacks Faced By Organization
This slide provides information regarding the number of cyber attacks faced by the organization and its impact on IT operations and system downtime. It also provides details of percentage rise in such attacks since last month. Present the topic in a bit more detail with this Cybersecurity Risk Assessment Program Cyber Attacks Faced By Organization. Use it as a tool for discussion and navigation on Cyber Attacks, IT Operations, System Downtime. This template is free to edit as deemed fit for your organization. Therefore download it now.
-
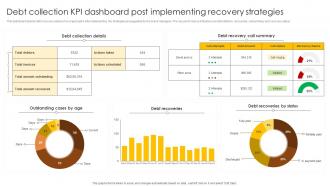 Debt Collection KPI Dashboard Post Implementing Recovery Strategies
This dashboard depicts debt recovery status of an organization after implementing the strategies as suggested by the brand managers. The key performance indicators are total debtors, recoveries, call summary and recovery status. Introducing our Debt Collection KPI Dashboard Post Implementing Recovery Strategies set of slides. The topics discussed in these slides are Dashboard, Collection, Strategies. This is an immediately available PowerPoint presentation that can be conveniently customized. Download it and convince your audience.
-
 Statistical Data Highlighting Global Hiring Forecast Trends
The slide showcases trends of hiring that assists in studying market behavior and insights of employee recruitment forecast . The elements include organizations hiring priorities , challenges faced by recruiters, social media dominance in hiring. Introducing our Statistical Data Highlighting Global Hiring Forecast Trends set of slides. The topics discussed in these slides are Statistical Data, Forecast, Trends. This is an immediately available PowerPoint presentation that can be conveniently customized. Download it and convince your audience.
-
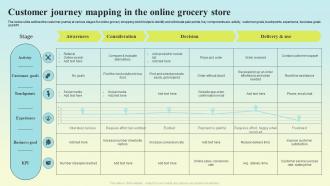 Customer Journey Mapping In The Online Grocery Store
The below slide outlines the customer journey at various stages for online grocery shopping which helps to identify and eliminate pain points. Key components are activity, customer goals, touchpoints, experience, business goals and KPI. Presenting our well structured Customer Journey Mapping In The Online Grocery Store. The topics discussed in this slide are Awareness, Consideration, Decision, Delivery And Use. This is an instantly available PowerPoint presentation that can be edited conveniently. Download it right away and captivate your audience.
-
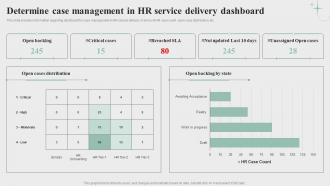 Determine Case Management In Hr Service Delivery Dashboard
This slide provides information regarding dashboard for case management in HR service delivery in terms of HR case count, open case distribution, etc. Deliver an outstanding presentation on the topic using this Determine Case Management In Hr Service Delivery Dashboard. Dispense information and present a thorough explanation of Open Backlog, Distribution, Critical Cases using the slides given. This template can be altered and personalized to fit your needs. It is also available for immediate download. So grab it now.
-
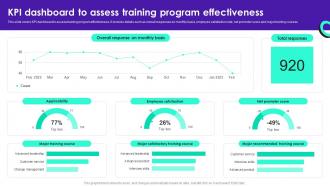 KPI Dashboard To Assess Training Program Effectiveness Staff Productivity Enhancement Techniques
This slide covers KPI dashboard to assess training program effectiveness. It involves details such as overall responses on monthly basis, employee satisfaction rate, net promoter score and major training courses.Present the topic in a bit more detail with this KPI Dashboard To Assess Training Program Effectiveness Staff Productivity Enhancement Techniques. Use it as a tool for discussion and navigation on Applicability, Employee Satisfaction, Net Promoter Score. This template is free to edit as deemed fit for your organization. Therefore download it now.
-
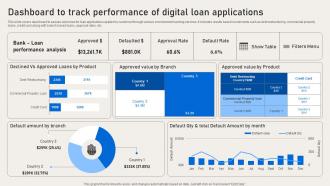 Dashboard To Track Performance Of Digital Loan Deployment Of Banking Omnichannel
This slide covers dashboard to assess outcomes for loan applications applied by customer through various omnichannel banking services. It includes results based on elements such as debt restructuring, commercial property loans, credit card along with branch based loans, approval rates, etc. Deliver an outstanding presentation on the topic using this Dashboard To Track Performance Of Digital Loan Deployment Of Banking Omnichannel. Dispense information and present a thorough explanation of Performance, Dashboard, Applications using the slides given. This template can be altered and personalized to fit your needs. It is also available for immediate download. So grab it now.
-
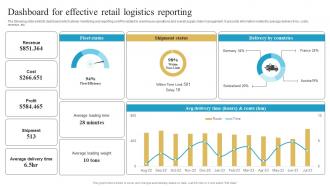 Dashboard For Effective Retail Logistics Reporting
The following slide exhibits dashboard which allows monitoring and reporting on KPIs related to warehouse operations and overall supply chain management. It presents information related to average delivery time, costs, revenue, etc. Presenting our well structured Dashboard For Effective Retail Logistics Reporting. The topics discussed in this slide are Fleet Status, Shipment Status, Delivery By Countries. This is an instantly available PowerPoint presentation that can be edited conveniently. Download it right away and captivate your audience.
-
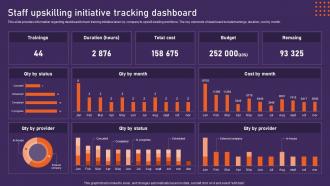 Staff Upskilling Initiative Tracking Dashboard Potential Initiatives For Upgrading Strategy Ss
This slide provides information regarding dashboard to track training initiative taken by company to upskill existing workforce. The key elements of dashboard include trainings, duration, cost by month. Present the topic in a bit more detail with this Staff Upskilling Initiative Tracking Dashboard Potential Initiatives For Upgrading Strategy Ss. Use it as a tool for discussion and navigation on Trainings, Budget, Total Cost. This template is free to edit as deemed fit for your organization. Therefore download it now.
-
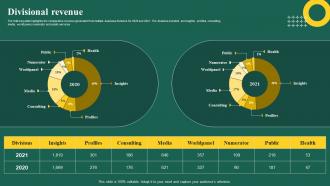 Brand Analytics Company Profile Divisional Revenue Ppt Show Designs Download Cp Ss V
The following slide highlights the comparative revenue generated from multiple business divisions for 2020 and 2021. The divisions included are insights, profiles, consulting, media, world panel, numerator and public services Deliver an outstanding presentation on the topic using this Brand Analytics Company Profile Divisional Revenue Ppt Show Designs Download Cp Ss V. Dispense information and present a thorough explanation of Comparative, Revenue, Business using the slides given. This template can be altered and personalized to fit your needs. It is also available for immediate download. So grab it now.
-
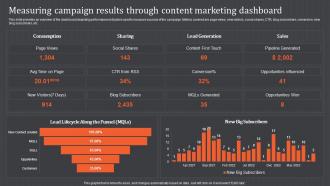 Content Marketing Campaign Measuring Campaign Results Through Content Marketing Dashboard
This slide provides an overview of the dashboard depicting performance indicators used to measure success of the campaign. Metrics covered are page views, new visitors, social shares, CTR, blog subscribers, conversion, new blog subscribers, etc. Present the topic in a bit more detail with this Content Marketing Campaign Measuring Campaign Results Through Content Marketing Dashboard. Use it as a tool for discussion and navigation on Measuring, Marketing, Dashboard. This template is free to edit as deemed fit for your organization. Therefore download it now.
-
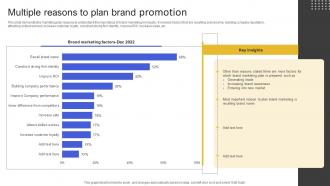 Multiple Reasons To Plan Brand Promotion
This slide demonstrates marketing plan reasons to understand the importance of brand Promotion in industry. It involves factors that are recalling brand name, building company reputation, attracting skilled workers, increase customer loyalty, construct strong firm identity, improve ROI, increase sales, etc. Introducing our Multiple Reasons To Plan Brand Promotion set of slides. The topics discussed in these slides are Plan Brand Marketing, Generating Leads, Brand Awareness This is an immediately available PowerPoint presentation that can be conveniently customized. Download it and convince your audience.
-
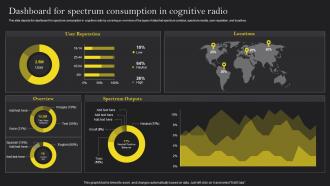 Cognitive Wireless Sensor Networks Dashboard For Spectrum Consumption In Cognitive Radio
This slide depicts the dashboard for spectrum consumption in cognitive radio by covering an overview of the types of data that spectrum contains, spectrum results, user reputation, and locations. Present the topic in a bit more detail with this Cognitive Wireless Sensor Networks Dashboard For Spectrum Consumption In Cognitive Radio. Use it as a tool for discussion and navigation on Dashboard, Spectrum Consumption, Cognitive Radio, Spectrum Outputs. This template is free to edit as deemed fit for your organization. Therefore download it now.
-
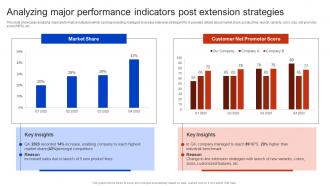 Analyzing Major Performance Indicators Post Extension Strategies Apple Brand Extension
This slide showcases analyzing major performance indicators which can help branding managers to assess extension strategy KPIs. It provides details about market share, product line, launch, variants, color, size, net promotor score NPS, etc. Deliver an outstanding presentation on the topic using this Analyzing Major Performance Indicators Post Extension Strategies Apple Brand Extension. Dispense information and present a thorough explanation of Amongst Competitors, Extension Strategies, Increased Sales using the slides given. This template can be altered and personalized to fit your needs. It is also available for immediate download. So grab it now.
-
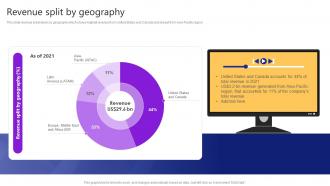 Revenue Split By Geography Video Streaming Platform Company Profile Cp Cd V
This slide revenue breakdown by geography which shows highest revenue from United States and Canada and lowest from Asia Pacific region.Present the topic in a bit more detail with this Revenue Split By Geography Video Streaming Platform Company Profile Cp Cd V. Use it as a tool for discussion and navigation on Canada Accounts, Middle East, Total Revenue. This template is free to edit as deemed fit for your organization. Therefore download it now.
-
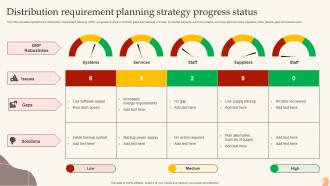 Distribution Requirement Planning Strategy Progress Status
The following slide highlights the distribution requirement planning DRP progress reviews to minimize gaps and optimize process. It includes elements such as systems, services, staff, services, suppliers, sites, issues, gaps and solutions etc. Presenting our well structured Distribution Requirement Planning Strategy Progress Status. The topics discussed in this slide are Issues, Gaps, Solutions. This is an instantly available PowerPoint presentation that can be edited conveniently. Download it right away and captivate your audience.
-
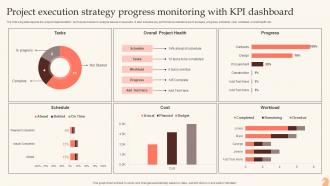 Project Execution Strategy Progress Monitoring With KPI Dashboard
The following slide depicts the project implementation techniques tracker to analyse issues in execution. It also includes key performance indicators such as tasks, progress, schedule, cost, workload, overall health etc. Introducing our Project Execution Strategy Progress Monitoring With KPI Dashboard set of slides. The topics discussed in these slides are Tasks, Overall Project Health, Progress, Schedule. This is an immediately available PowerPoint presentation that can be conveniently customized. Download it and convince your audience.
-
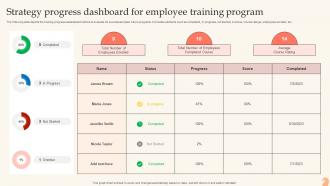 Strategy Progress Dashboard For Employee Training Program
The following slide depicts the training progress assessment metrics to evaluate its success and plan future programs. It includes elements such as completed, in progress, not started, overdue, course ratings, employees enrolled, etc. Presenting our well structured Strategy Progress Dashboard For Employee Training Programc. The topics discussed in this slide are Strategy Progress, Dashboard For Employee, Training Program. This is an instantly available PowerPoint presentation that can be edited conveniently. Download it right away and captivate your audience.
-
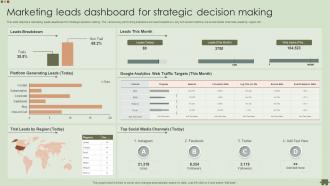 Marketing Leads Dashboard For Strategic Decision Making
This slide highlights various data driven tools for strategic decisions and generate real time insights for optimizing business performance. Some of the tools are business intelligence tools, customer data tracking etc. Presenting our well structured Marketing Leads Dashboard For Strategic Decision Making. The topics discussed in this slide are Leads Breakdown, Platform Generating Leads, Leads By Region. This is an instantly available PowerPoint presentation that can be edited conveniently. Download it right away and captivate your audience.
-
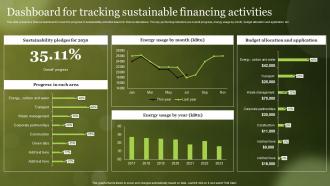 Dashboard For Tracking Sustainable Financing Activities
This slide presents a finance dashboard to track the progress of sustainability activities based on finance allocations. The key performing indicators are overall progress, energy usage by month, budget allocation and application etc. Introducing our Dashboard For Tracking Sustainable Financing Activities set of slides. The topics discussed in these slides are Dashboard, Tracking, Sustainable. This is an immediately available PowerPoint presentation that can be conveniently customized. Download it and convince your audience.
-
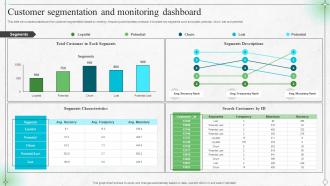 Customer Segmentation And Monitoring Dashboard
This slide showcases a dashboard for customer segmentation based on recency, frequency and monetary analysis. It includes key segments such as loyalist, potential, churn, lost and potential. Presenting our well structured Customer Segmentation And Monitoring Dashboard. The topics discussed in this slide are Customer In Each Segments, Segments Descriptions, Segments Characteristics. This is an instantly available PowerPoint presentation that can be edited conveniently. Download it right away and captivate your audience
-
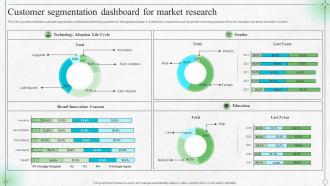 Customer Segmentation Dashboard For Market Research
The following slide presents a customer segmentation dashboard distributing customers on demographics basis. It includes key components such as gender, technology adoption lifecycle, education and brand innovation consent. Introducing our Customer Segmentation Dashboard For Market Research set of slides. The topics discussed in these slides are Brand Innovation Consent, Gender, Education. This is an immediately available PowerPoint presentation that can be conveniently customized. Download it and convince your audience.
-
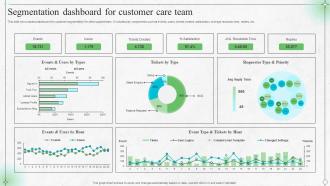 Segmentation Dashboard For Customer Care Team
This slide showcases a dashboard for customer segmentation for client support team. It includes key components such as events, users, tickets created, satisfaction, average resolution time, replies, etc. Introducing our Segmentation Dashboard For Customer Care Team set of slides. The topics discussed in these slides are Users By Types, Tickets By Type, Requester Type And Priority. This is an immediately available PowerPoint presentation that can be conveniently customized. Download it and convince your audience.
-
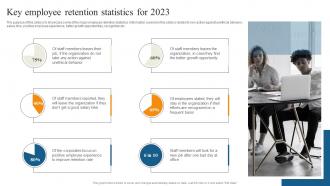 Key Employee Retention Statistics For 2023 Reducing Staff Turnover Rate With Retention Tactics
The purpose of this slide is to showcase some of the major employee retention statistics. Information covered in this slide is related to non-action against unethical behavior, salary hike, positive employee experience, better growth opportunities, recognition etc. Present the topic in a bit more detail with this Key Employee Retention Statistics For 2023 Reducing Staff Turnover Rate With Retention Tactics. Use it as a tool for discussion and navigation on Staff Members, Organization, Recognized. This template is free to edit as deemed fit for your organization. Therefore download it now.
-
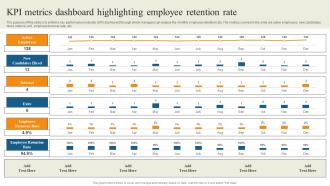 Kpi Metrics Dashboard Highlighting Reducing Staff Turnover Rate With Retention Tactics
The purpose of this slide is to exhibit a key performance indicator KPI dashboard through which managers can analyze the monthly employee retention rate. The metrics covered in the slide are active employees, new candidates hired, internal, exit, employee turnover rate, etc. Deliver an outstanding presentation on the topic using this Kpi Metrics Dashboard Highlighting Reducing Staff Turnover Rate With Retention Tactics. Dispense information and present a thorough explanation of Employees, Candidates Hired using the slides given. This template can be altered and personalized to fit your needs. It is also available for immediate download. So grab it now.
-
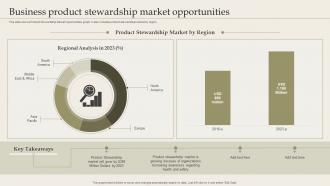 Business Product Stewardship Market Opportunities
This slide shows Product Stewardship Market Opportunities graph. It also includes product stewardship market by region. Introducing our Business Product Stewardship Market Opportunities set of slides. The topics discussed in these slides are Product Stewardship, Market By Region, Regional Analysis. This is an immediately available PowerPoint presentation that can be conveniently customized. Download it and convince your audience.
-
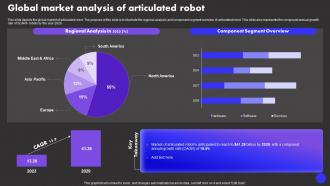 Global Market Analysis Of Articulated Robot Types Of Industrial Robots IT
This slide depicts the global market of articulated robot. The purpose of this slide is to illustrate the regional analysis and component segment overview of articulated robot. This slide also represents the compound annual growth rate of SCARA robots by the year 2029. Present the topic in a bit more detail with this Global Market Analysis Of Articulated Robot Types Of Industrial Robots IT. Use it as a tool for discussion and navigation on Regional Analysis, Component Segment Overview, Key Takeaway. This template is free to edit as deemed fit for your organization. Therefore download it now.
-
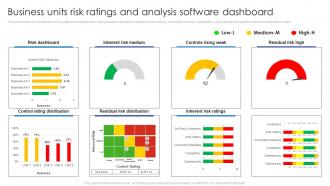 Business Units Risk Ratings And Analysis Software Dashboard
This slide covers risk distribution among different business units. It also includes inherent risk ratings for anti bribery, commodity markets, competition, cyber security along with residual risk distribution matrix.Presenting our well structured Business Units Risk Ratings And Analysis Software Dashboard. The topics discussed in this slide are Risk Dashboard, Inherent Risk Medium, Controls Rising Weak. This is an instantly available PowerPoint presentation that can be edited conveniently. Download it right away and captivate your audience.
-
 Sprint Burndown Chart Representing Team Velocity Ppt Powerpoint Presentation File Gallery
This slide represents the chart to help management to track total work remaining in the software implementation and the likelihood of achieving software implementation goal. It represents significance of sprint burndown chart. Present the topic in a bit more detail with this Sprint Burndown Chart Representing Team Velocity Ppt Powerpoint Presentation File Gallery. Use it as a tool for discussion and navigation on Planning, Tracking. This template is free to edit as deemed fit for your organization. Therefore download it now.
-
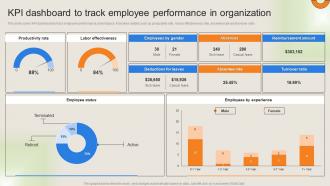 Workforce Performance Management Plan KPI Dashboard To Track Employee Performance In Organization
This slide covers KPI dashboard to track employee performance at workplace. It involves details such as productivity rate, labour effectiveness rate, absentee rate and turnover ratio. Present the topic in a bit more detail with this Workforce Performance Management Plan KPI Dashboard To Track Employee Performance In Organization. Use it as a tool for discussion and navigation on KPI Dashboard, Track Employee, Performance In Organization. This template is free to edit as deemed fit for your organization. Therefore download it now.
-
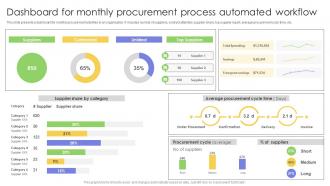 Dashboard For Monthly Procurement Process Automated Strategies For Implementing Workflow
This slide presents a dashboard for monthly procurement activities in an organization. It includes number of suppliers, contract attainted, supplier share, top supplier report, average procurement cycle time, etc. Deliver an outstanding presentation on the topic using this Dashboard For Monthly Procurement Process Automated Strategies For Implementing Workflow. Dispense information and present a thorough explanation of Dashboard, Procurement, Automated using the slides given. This template can be altered and personalized to fit your needs. It is also available for immediate download. So grab it now.
-
 Impact Of 3d Printing In Manufacturing Industry 3d Printing In Manufacturing
This slide describes the impact of 3D printing in the manufacturing industry, including complex geometries, lead time reduction, cost reduction, small batches in inventory, engineering redesign, mass reduction, reduction of assembly steps, internal channels, and so on. Deliver an outstanding presentation on the topic using this Impact Of 3d Printing In Manufacturing Industry 3d Printing In Manufacturing. Dispense information and present a thorough explanation of Manufacturing, Geometrie, Engineering Redesign using the slides given. This template can be altered and personalized to fit your needs. It is also available for immediate download. So grab it now.
-
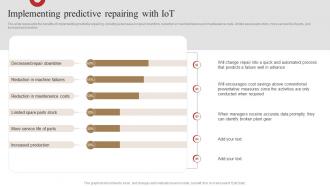 Implementing Predictive Repairing With Iot 3d Printing In Manufacturing
This slide represents the benefits of implementing predictive repairing, including a decrease in repair downtime, reduction in machine failures and maintenance costs, limited spare parts stock, more service life of parts, and increased production. Present the topic in a bit more detail with this Implementing Predictive Repairing With Iot 3d Printing In Manufacturing. Use it as a tool for discussion and navigation on Implementing, Conventional, Process. This template is free to edit as deemed fit for your organization. Therefore download it now.
-
 North America 3d Printing Market Size 3d Printing In Manufacturing
This slide depicts the north American 3D printing market size by technology such as stereolithography, fuse deposition modeling, selective laser sintering, direct metal laser sintering, polyjet printing, inkjet printing, electron beam melting, laser metal deposition, etc. Present the topic in a bit more detail with this North America 3d Printing Market Size 3d Printing In Manufacturing. Use it as a tool for discussion and navigation on Stereolithography, Inkjet Printing, Polyjet Printing. This template is free to edit as deemed fit for your organization. Therefore download it now.
-
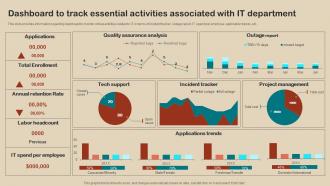 IT Strategy Planning Guide Dashboard To Track Essential Activities Associated With IT Department Strategy SS V
This slide provides information regarding dashboard to monitor critical activities related to IT in terms of incident tracker, outage report, IT spend per employee, application trends, etc. Deliver an outstanding presentation on the topic using this IT Strategy Planning Guide Dashboard To Track Essential Activities Associated With IT Department Strategy SS V. Dispense information and present a thorough explanation of Dashboard, Track Essential Activities, Associated With IT Department using the slides given. This template can be altered and personalized to fit your needs. It is also available for immediate download. So grab it now.
-
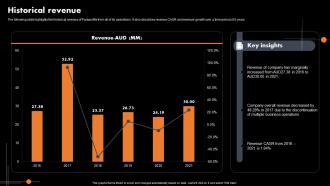 Historical Revenue Marketing Analytics Company Profile CP SS V
The following slide highlights the historical revenue of Pureprofile from all of its operations. It also describes revenue CAGR and revenue growth over a time period of 6 years Present the topic in a bit more detail with this Historical Revenue Marketing Analytics Company Profile CP SS V Use it as a tool for discussion and navigation on Revenue, Business Operations, Company Overall Revenue This template is free to edit as deemed fit for your organization. Therefore download it now.
-
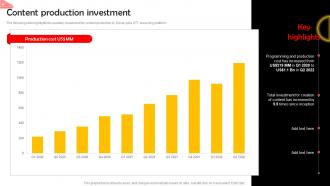 Content Production Investment Online Streaming Service Company Profile CP SS V
The following slide highlights the quarterly investment for content production by Disney plus OTT streaming platform. Deliver an outstanding presentation on the topic using this Content Production Investment Online Streaming Service Company Profile CP SS V Dispense information and present a thorough explanation of Programming And Production, Total Investment using the slides given. This template can be altered and personalized to fit your needs. It is also available for immediate download. So grab it now.
-
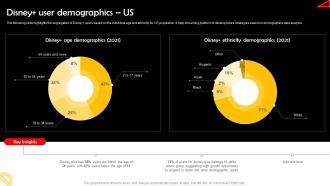 Disney Plus User Demographics Us Online Streaming Service Company Profile CP SS V
The following slide highlights the segregation of Disney plus users based on the individual age and ethnicity for US population. It help streaming platform to develop future strategies based on demographics data analysis Deliver an outstanding presentation on the topic using this Disney Plus User Demographics Us Online Streaming Service Company Profile CP SS V Dispense information and present a thorough explanation of Disney Plus Ethnicity Demographics, Disney Plus Age Demographics using the slides given. This template can be altered and personalized to fit your needs. It is also available for immediate download. So grab it now.


