Charts, Graphs PowerPoint Designs, Presentation Charts Designs & PPT Graphics
- Sub Categories
-
- Arrows and Targets
- Bullet and Text Slides
- Charts and Graphs
- Circular Cycle Diagrams
- Concepts and Shapes
- Custom Flat Designs
- Dashboards and Measuring
- Flow Process
- Funnels
- Gears
- Growth
- Harvey Balls
- Idea Innovation and Light Bulbs
- Leadership
- Linear Process Diagrams
- Magnifying Glass
- Misc Other Graphics
- Opportunity and Handshake
- Organization Charts
- Puzzles
- Pyramids
- Roadmaps and Timelines
- Silhouettes
- Steps
- Strategic Planning Analysis
- SWOT Analysis
- Tables and Matrix
- Teamwork
- Technology and Communication
- Venn Diagrams
- Visuals and Illustrations
-
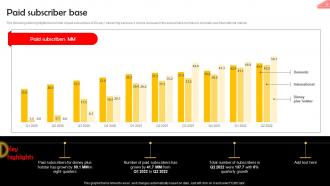 Paid Subscriber Base Online Streaming Service Company Profile CP SS V
The following slide highlights the number of paid subscribers of Disney plus streaming services. It shows increase in the subscribers numbers in domestic and international market. Deliver an outstanding presentation on the topic using this Paid Subscriber Base Online Streaming Service Company Profile CP SS V Dispense information and present a thorough explanation of Paid Subscriber Base using the slides given. This template can be altered and personalized to fit your needs. It is also available for immediate download. So grab it now.
-
 KPI Dashboard For Tracking Customer Retention Enhancing Customer Support
This slide covers the dashboard for analyzing customer loyalty with metrics such as NPS, loyal customer rate, premium users, CLV, customer churn, revenue churn, net retention, MRR growth, etc. Deliver an outstanding presentation on the topic using this KPI Dashboard For Tracking Customer Retention Enhancing Customer Support. Dispense information and present a thorough explanation of Customer Churn, Revenue Churn, Net Retention, MRR Growth using the slides given. This template can be altered and personalized to fit your needs. It is also available for immediate download. So grab it now.
-
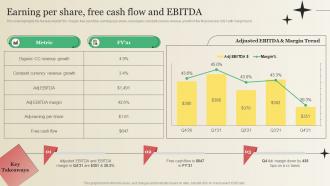 Earning Per Share Free Cash Flow And EBITDA Market Research Company Profile CP SS V
This slide highlights the Nielsen Adj EBITDA margin, free cash flow, earnings per share, and organic constant currency revenue growth of the financial year 2021 with margin trend. Deliver an outstanding presentation on the topic using this Earning Per Share Free Cash Flow And EBITDA Market Research Company Profile CP SS V. Dispense information and present a thorough explanation of Revenue Growth, Constant Currency, Free Cash Flow using the slides given. This template can be altered and personalized to fit your needs. It is also available for immediate download. So grab it now.
-
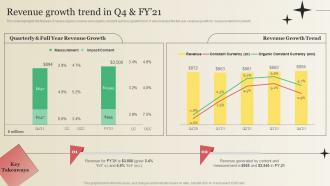 Revenue Growth Trend In Q4 And FY21 Market Research Company Profile CP SS V
This slide highlights the Nielsen company organic currency and organic constant currency growth trend. It also includes the full year revenue growth for measurement and content. Present the topic in a bit more detail with this Revenue Growth Trend In Q4 And FY21 Market Research Company Profile CP SS V. Use it as a tool for discussion and navigation on Revenue Growth, Revenue Growth Trend, Revenue Generated. This template is free to edit as deemed fit for your organization. Therefore download it now.
-
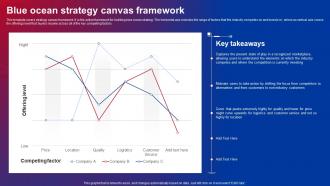 Blue Ocean Strategy Canvas Framework Ppt Infographic Template Tips Strategy SS V
This template covers strategy canvas framework. It is the action framework for building blue ocean strategy. The horizontal axis includes the range of factors that the industry competes on and invests in, where as vertical axis covers the offerings level that buyers receive across all of the key competing factors. Present the topic in a bit more detail with this Blue Ocean Strategy Canvas Framework Ppt Infographic Template Tips Strategy SS V. Use it as a tool for discussion and navigation on Blue Ocean Strategy, Canvas Framework, Recognized Marketplace. This template is free to edit as deemed fit for your organization. Therefore download it now.
-
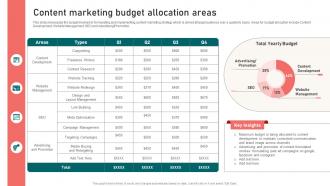 Content Marketing Budget Allocation Areas Content Marketing Strategy Suffix MKT SS
This slide showcases the budget involved in formulating and implementing content marketing strategy which is aimed at target audience over a quarterly basis. Areas for budget allocation include Content Development, Website Management, SEO and Advertising Promotion. Deliver an outstanding presentation on the topic using this Content Marketing Budget Allocation Areas Content Marketing Strategy Suffix MKT SS. Dispense information and present a thorough explanation of Marketing, Budget, Areas using the slides given. This template can be altered and personalized to fit your needs. It is also available for immediate download. So grab it now.
-
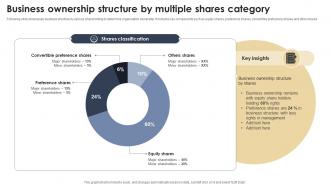 Business Ownership Structure By Multiple Shares Category
Following slide showcases business structure by various shareholding to determine organisation ownership. It includes key components such as equity shares, preference shares, convertible preference shares and other shares Introducing our Business Ownership Structure By Multiple Shares Category set of slides. The topics discussed in these slides are Business, Ownership, Management. This is an immediately available PowerPoint presentation that can be conveniently customized. Download it and convince your audience.
-
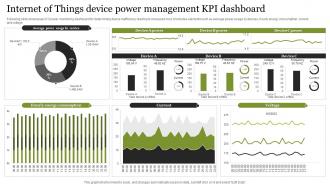 Internet Of Things Device Power Management Kpi Dashboard
Following slide showcases IoT power monitoring dashboard for determining device inefficiency leading to increased cost. It includes elements such as average power usage by devices, hourly energy consumption, current and voltage Introducing our Internet Of Things Device Power Management Kpi Dashboard set of slides. The topics discussed in these slides are Hourly Energy Consumption, Current. This is an immediately available PowerPoint presentation that can be conveniently customized. Download it and convince your audience.
-
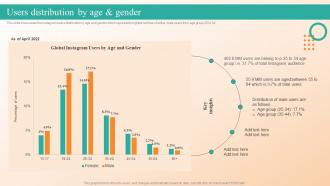 Users Distribution By Age And Gender Online Video Platform Company Profile Cp Cd V
This slide showcases the Instagram users distribution by age and gender which represents highest number of active male users from age group 25 to 34.Present the topic in a bit more detail with this Users Distribution By Age And Gender Online Video Platform Company Profile Cp Cd V. Use it as a tool for discussion and navigation on Users Distribution, Age And Gender. This template is free to edit as deemed fit for your organization. Therefore download it now.
-
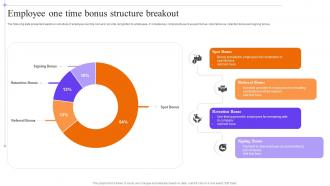 Employee One Time Bonus Structure Breakout
The following slide presents breakdown structure of employee one time bonus to provide recognition to employees. It includes key components such as spot bonus, referral bonus, retention bonus and signing bonus. Introducing our Employee One Time Bonus Structure Breakout set of slides. The topics discussed in these slides are Spot Bonus, Referral Bonus. This is an immediately available PowerPoint presentation that can be conveniently customized. Download it and convince your audience.
-
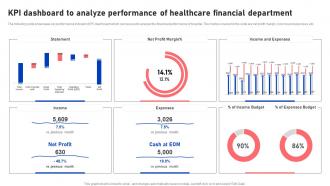 KPI Dashboard To Analyze Performance Of Healthcare Financial Department Functional Areas Of Medical
The following slide showcases key performance indicator KPI dashboard which can be used to analyze the financial performance of hospital. The metrics covered in the slide are net profit margin, income and expenses, etc. Deliver an outstanding presentation on the topic using this KPI Dashboard To Analyze Performance Of Healthcare Financial Department Functional Areas Of Medical. Dispense information and present a thorough explanation of Statement, Income And Expenses, Expenses using the slides given. This template can be altered and personalized to fit your needs. It is also available for immediate download. So grab it now.
-
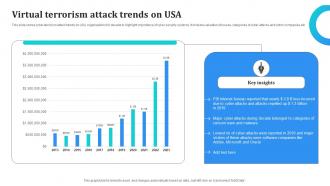 Virtual Terrorism Attack Trends On Usa
This slide shows cyber terrorism attack trends on USA organizations for decade to highlight importance of cyber security systems. It includes valuation of losses, categories of cyber attacks and victim companies etc.Presenting our well structured Virtual Terrorism Attack Trends On Usa. The topics discussed in this slide are Internet Bureau, Ransom Malware, Software Companies. This is an instantly available PowerPoint presentation that can be edited conveniently. Download it right away and captivate your audience.
-
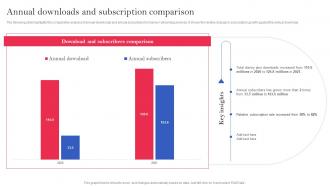 OTT Platform Company Profile Annual Downloads And Subscription Comparison CP SS V
The following slide highlights the comparative analysis of annual downloads and annual subscribers for Disneyplus streaming services. It shows the relative change in subscription growth against the annual download. Present the topic in a bit more detail with this OTT Platform Company Profile Annual Downloads And Subscription Comparison CP SS V. Use it as a tool for discussion and navigation on Annual Downloads, Subscription Comparison, Streaming Services. This template is free to edit as deemed fit for your organization. Therefore download it now.
-
 Finance Planning And Management Team Structure Analyzing Business Financial Strategy
This slide provides glimpse about the team structure and roles and responsibilities of the members of the financial management team . It includes team members such as CFO, VP Finance, finance manager, etc. Present the topic in a bit more detail with this Finance Planning And Management Team Structure Analyzing Business Financial Strategy. Use it as a tool for discussion and navigation on Tools And Reports, Reports Availability, Profitability Analysis. This template is free to edit as deemed fit for your organization. Therefore download it now.
-
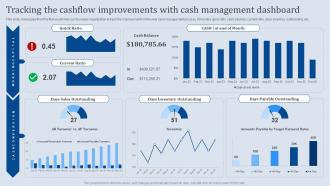 Tracking The Cashflow Improvements With Cash Analyzing Business Financial Strategy
This slide showcases the KPIs that would help our business organization to track the improvements in the new cash management process. It includes quick ratio, cash balance, current ratio, days inventory outstanding, etc. Introducing our Tracking The Cashflow Improvements With Cash Analyzing Business Financial Strategy set of slides. The topics discussed in these slides are Days Sales Outstanding, Days Inventory Outstanding, Days Payable Outstanding. This is an immediately available PowerPoint presentation that can be conveniently customized. Download it and convince your audience.
-
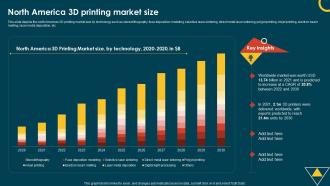 IoT In Manufacturing IT North America 3d Printing Market Size
This slide depicts the north American 3D printing market size by technology such as stereolithography, fuse deposition modeling, selective laser sintering, direct metal laser sintering, polyjet printing, inkjet printing, electron beam melting, laser metal deposition, etc. Deliver an outstanding presentation on the topic using this IoT In Manufacturing IT North America 3d Printing Market Size. Dispense information and present a thorough explanation of Market, Technology, Printing using the slides given. This template can be altered and personalized to fit your needs. It is also available for immediate download. So grab it now.
-
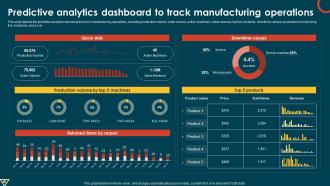 IoT In Manufacturing IT Predictive Analytics Dashboard To Track Manufacturing Operations
This slide depicts the predictive analytics dashboard to track manufacturing operations, including production volume, order volume, active machines, sales revenue, top five products, downtime causes, production volume by top five machines, and so on. Present the topic in a bit more detail with this IoT In Manufacturing IT Predictive Analytics Dashboard To Track Manufacturing Operations. Use it as a tool for discussion and navigation on Analytics, Manufacturing, Operations. This template is free to edit as deemed fit for your organization. Therefore download it now.
-
 Total Employee Count Data And Consumer Research Company Profile CP SS V
This slide highlights the Nielsen worldwide employee count which includes the United States, Remaining Americas, Europe and APMEA. It also covers employees under the collective bargaining agreement and council agreement in Europe. Present the topic in a bit more detail with this Total Employee Count Data And Consumer Research Company Profile CP SS V Use it as a tool for discussion and navigation on United States, Remaining Americas, Europe This template is free to edit as deemed fit for your organization. Therefore download it now.
-
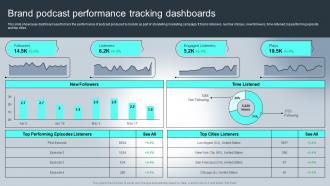 Brand Podcast Performance Tracking Complete Guide For Understanding Storytelling Marketing Mkt Ss
This slide showcases dashboard used to track the performance of podcast produced by brands as part of storytelling marketing campaign. It tracks listeners, number of plays, new followers, time-listened, top performing episode and top cities. Present the topic in a bit more detail with this Brand Podcast Performance Tracking Complete Guide For Understanding Storytelling Marketing Mkt Ss. Use it as a tool for discussion and navigation on Podcast, Performance, Dashboards. This template is free to edit as deemed fit for your organization. Therefore download it now.
-
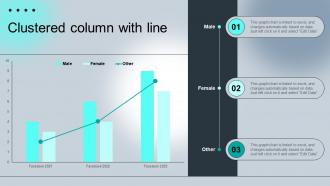 Clustered Column With Line Complete Guide For Understanding Storytelling Marketing Mkt Ss
Deliver an outstanding presentation on the topic using this Clustered Column With Line Complete Guide For Understanding Storytelling Marketing Mkt Ss. Dispense information and present a thorough explanation of Clustered Column With Line using the slides given. This template can be altered and personalized to fit your needs. It is also available for immediate download. So grab it now.
-
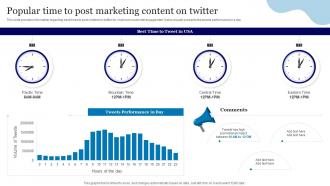 Online Advertisement Using Twitter Popular Time To Post Marketing Content On Twitter
This slide provides information regarding best times to post content on twitter for maximum customer engagement. It also visually presents the tweets performance in a day. Deliver an outstanding presentation on the topic using this Online Advertisement Using Twitter Popular Time To Post Marketing Content On Twitter. Dispense information and present a thorough explanation of Performance, Marketing, Post using the slides given. This template can be altered and personalized to fit your needs. It is also available for immediate download. So grab it now.
-
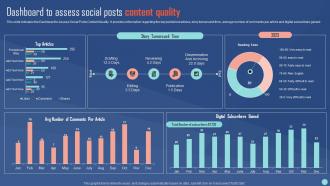 Dashboard To Assess Social Posts Content Quality Social Media Channels Performance Evaluation Plan
This slide indicates the Dashboard to Assess Social Posts Content Quality. It provides information regarding the top published articles, story turnaround time, average number of comments per article and digital subscribers gained. Present the topic in a bit more detail with this Dashboard To Assess Social Posts Content Quality Social Media Channels Performance Evaluation Plan. Use it as a tool for discussion and navigation on Assess, Content, Quality. This template is free to edit as deemed fit for your organization. Therefore download it now.
-
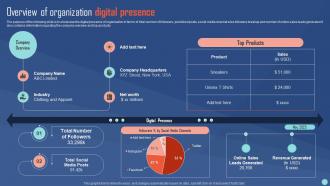 Overview Of Organization Digital Presence Social Media Channels Performance Evaluation Plan
The purpose of the following slide is to showcase the digital presence of organization in terms of total number of followers, published posts, social media channel wise followers breakup and number of online sales leads generated. It also contains information regarding the company overview and top products Deliver an outstanding presentation on the topic using this Overview Of Organization Digital Presence Social Media Channels Performance Evaluation Plan. Dispense information and present a thorough explanation of Organization, Presence, Digital using the slides given. This template can be altered and personalized to fit your needs. It is also available for immediate download. So grab it now.
-
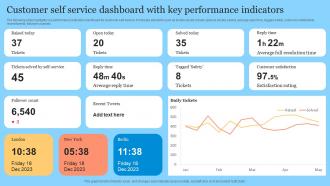 Customer Self Service Dashboard With Key Performance Indicators
The following slide highlights key performance indicators dashboard for customer self service. It includes elements such as tickets raised, tickets opened, tickets solved, average reply time, tagged safety, customer satisfaction, recent tweets, follower count etc. Introducing our Customer Self Service Dashboard With Key Performance Indicators set of slides. The topics discussed in these slides are Raised Today, Daily Tickets. This is an immediately available PowerPoint presentation that can be conveniently customized. Download it and convince your audience.
-
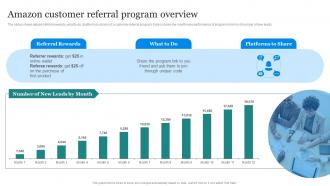 Amazon Marketing Strategy Amazon Customer Referral Program Overview
The slides shows details referral rewards, what to do, platforms to share of a customer referral program. It also shows the month wise performance of program in terms of number of new leads. Deliver an outstanding presentation on the topic using this Amazon Marketing Strategy Amazon Customer Referral Program Overview. Dispense information and present a thorough explanation of Amazon Customer Referral, Program Overview, Platforms To Share using the slides given. This template can be altered and personalized to fit your needs. It is also available for immediate download. So grab it now.
-
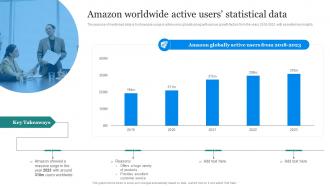 Amazon Marketing Strategy Amazon Worldwide Active Users Statistical Data
The purpose of mentioned slide is to showcase surge in active users globally along with various growth factors from the years 2018 2023 with essential key insights. Deliver an outstanding presentation on the topic using this Amazon Marketing Strategy Amazon Worldwide Active Users Statistical Data. Dispense information and present a thorough explanation of Worldwide, Statistical Data, Massive Surge, Excellent Customer Service using the slides given. This template can be altered and personalized to fit your needs. It is also available for immediate download. So grab it now.
-
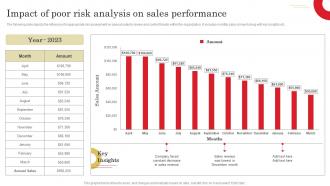 Impact Of Poor Risk Analysis On Sales Adopting Sales Risks Management Strategies
The following slide depicts the influence of inappropriate risk assessment on annual sales to review and control threats within the organization. It includes monthly sales amount along with key insights etc. Present the topic in a bit more detail with this Impact Of Poor Risk Analysis On Sales Adopting Sales Risks Management Strategies. Use it as a tool for discussion and navigation on Company, Sales Revenue, Key Insights. This template is free to edit as deemed fit for your organization. Therefore download it now.
-
 Major Factors Contributing Sales Adopting Sales Risks Management Strategies
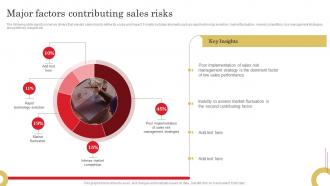
The following slide depicts some key drivers that elevate sales risks to define its scope and impact. It mainly includes elements such as rapid technology evolution, market fluctuation, market competition, risk management strategies along with key insights etc. Present the topic in a bit more detail with this Major Factors Contributing Sales Adopting Sales Risks Management Strategies. Use it as a tool for discussion and navigation on Sales Risk, Management Strategy, Sales Performance. This template is free to edit as deemed fit for your organization. Therefore download it now.
-
 Data Driven Marketing Survey Insights Data Driven Marketing For Increasing Customer MKT SS V
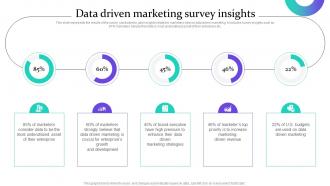
This slide represents the results of the survey conducted to gain insights related to marketers view on data driven marketing. It includes survey insights such as 87 percentage marketers believe that data is most underutilized asset of their enterprise etc. Present the topic in a bit more detail with this Data Driven Marketing Survey Insights Data Driven Marketing For Increasing Customer MKT SS V Use it as a tool for discussion and navigation on Marketers, Enterprise, Marketing Strategies This template is free to edit as deemed fit for your organization. Therefore download it now.
-
 Facebook Ad Campaign Performance Tracking Data Driven Marketing For Increasing Customer MKT SS V
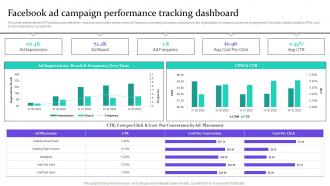
This slide represents the KPI dashboard to effectively measure and monitor performance of Facebook marketing campaign conducted by the organization to enhance customer engagement. It includes details related to KPIs such as ad impressions, ad reach etc. Deliver an outstanding presentation on the topic using this Facebook Ad Campaign Performance Tracking Data Driven Marketing For Increasing Customer MKT SS V Dispense information and present a thorough explanation of Desktop News Feed, Desktop Right Column, Instagram using the slides given. This template can be altered and personalized to fit your needs. It is also available for immediate download. So grab it now.
-
 Instagram Influencer Marketing Campaign Dashboard Data Driven Marketing For Increasing Customer MKT SS V
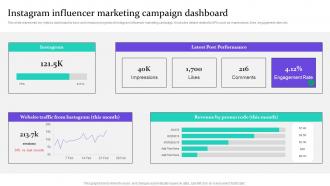
This slide represents key metrics dashboard to track and measure progress of Instagram influencer marketing campaign. It includes details related to KPIs such as impressions, likes, engagement rates etc. Present the topic in a bit more detail with this Instagram Influencer Marketing Campaign Dashboard Data Driven Marketing For Increasing Customer MKT SS V Use it as a tool for discussion and navigation on Instagram, Latest Post Performance This template is free to edit as deemed fit for your organization. Therefore download it now.
-
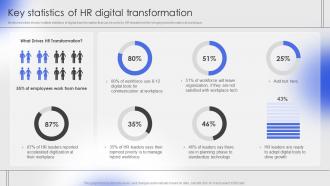 Key Statistics Of HR Digital Transformation
Mentioned slide shows multiple statistics of digital transformation that can be used by HR department for bringing transformation at workplace. Presenting our well structured Key Statistics Of HR Digital Transformation. The topics discussed in this slide are Drives HR Transformation, Employees Work From Home. This is an instantly available PowerPoint presentation that can be edited conveniently. Download it right away and captivate your audience.
-
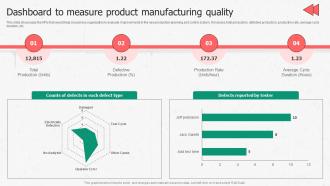 Dashboard To Measure Product Manufacturing Enhancing Productivity Through Advanced Manufacturing
This slide showcases the KPIs that would help a business organization to evaluate improvements in the new production planning and control system. It includes total production, defective production, production rate, average cycle duration, etc. Deliver an outstanding presentation on the topic using this Dashboard To Measure Product Manufacturing Enhancing Productivity Through Advanced Manufacturing. Dispense information and present a thorough explanation of Dashboard, Measure, Product using the slides given. This template can be altered and personalized to fit your needs. It is also available for immediate download. So grab it now.
-
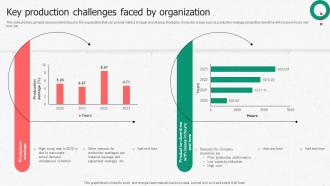 Key Production Challenges Faced By Enhancing Productivity Through Advanced Manufacturing
This slide provides glimpse about problems faced by the organization that can provide metrics to target and develop strategies. It includes issues such as production wastage, production downtime with losses in hours and tons, etc. Deliver an outstanding presentation on the topic using this Key Production Challenges Faced By Enhancing Productivity Through Advanced Manufacturing. Dispense information and present a thorough explanation of Production, Organization, Strategies using the slides given. This template can be altered and personalized to fit your needs. It is also available for immediate download. So grab it now.
-
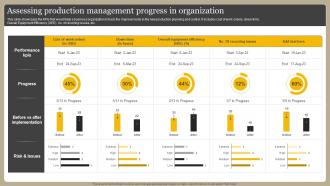 Assessing Production Management Progress In Organization Optimizing Manufacturing Operations
This slide showcases the KPIs that would help a business organization to track the improvements in the new production planning and control. It includes cost of work orders, down-time, Overall Equipment Efficiency OEE, no. of recurring issues, etc. Deliver an outstanding presentation on the topic using this Assessing Production Management Progress In Organization Optimizing Manufacturing Operations. Dispense information and present a thorough explanation of Production, Management, Organization using the slides given. This template can be altered and personalized to fit your needs. It is also available for immediate download. So grab it now.
-
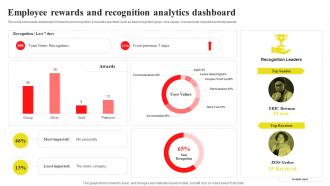 Employee Rewards And Recognition Analytics Implementing Recognition And Reward System
This slide showcases dashboard of rewards and recognition. It includes elements such as total recognition given, core values, most and last impacted and total awards.Present the topic in a bit more detail with this Employee Rewards And Recognition Analytics Implementing Recognition And Reward System. Use it as a tool for discussion and navigation on Least Impacted, Most Impacted, Recognition Leaders. This template is free to edit as deemed fit for your organization. Therefore download it now.
-
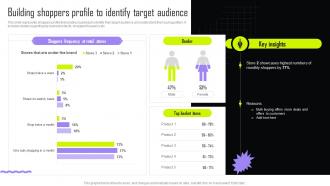 Building Shoppers Profile To Identify Target Implementing Retail Promotional Strategies For Effective MKT SS V
This slide represents shoppers profile that enables business to identify their target audience and understand their buying pattern. It includes details regarding top basket products, shoppers frequency etc. Present the topic in a bit more detail with this Building Shoppers Profile To Identify Target Implementing Retail Promotional Strategies For Effective MKT SS V. Use it as a tool for discussion and navigation on Profile, Identify, Target. This template is free to edit as deemed fit for your organization. Therefore download it now.
-
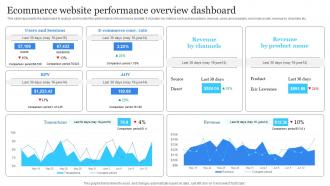 Ecommerce Website Performance Overview Dashboard Electronic Commerce Management Platform
This slide represents the dashboard to analyze and monitor the performance of ecommerce website. It includes key metrics such as transactions, revenue, users and sessions, ecommerce rate, revenue by channels etc.Present the topic in a bit more detail with this Ecommerce Website Performance Overview Dashboard Electronic Commerce Management Platform. Use it as a tool for discussion and navigation on Comparison Period, Revenue Channels, Revenue Product. This template is free to edit as deemed fit for your organization. Therefore download it now.
-
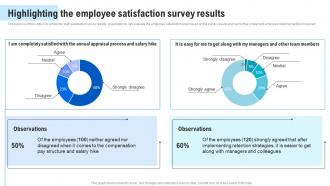 Highlighting The Employee Satisfaction Survey Human Resource Retention Strategies For Business Owners
The purpose of this slide is to exhibit the staff satisfaction survey results. Organizations can evaluate the employee satisfaction level based on the survey results and can further implement employee retention tactics if required. Present the topic in a bit more detail with this Highlighting The Employee Satisfaction Survey Human Resource Retention Strategies For Business Owners. Use it as a tool for discussion and navigation on Satisfaction, Compensation, Structure. This template is free to edit as deemed fit for your organization. Therefore download it now.
-
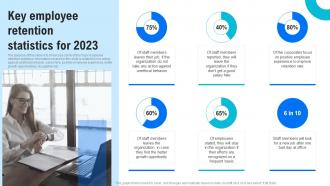 Key Employee Retention Statistics For 2023 Human Resource Retention Strategies For Business Owners
The purpose of this slide is to showcase some of the major employee retention statistics. Information covered in this slide is related to non-action against unethical behavior, salary hike, positive employee experience, better growth opportunities, recognition etc. Deliver an outstanding presentation on the topic using this Key Employee Retention Statistics For 2023 Human Resource Retention Strategies For Business Owners. Dispense information and present a thorough explanation of Statistics, Organization, Experience using the slides given. This template can be altered and personalized to fit your needs. It is also available for immediate download. So grab it now.
-
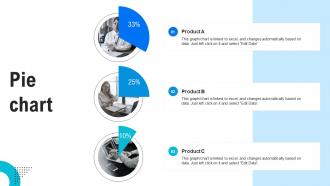 Pie Chart Human Resource Retention Strategies For Business Owners
Deliver an outstanding presentation on the topic using this Pie Chart Human Resource Retention Strategies For Business Owners. Dispense information and present a thorough explanation of Pie Chart using the slides given. This template can be altered and personalized to fit your needs. It is also available for immediate download. So grab it now.
-
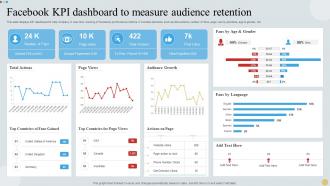 Facebook KPI Dashboard To Measure Audience Retention
This slide displays KPI dashboard to help company in real time tracking of Facebook performance metrics. It includes elements such as total actions, number of fans, page views, post likes, age and gender, etc. Presenting our well structured Facebook KPI Dashboard To Measure Audience Retention. The topics discussed in this slide are Page Views, Audience Growth, Countries Of Fans Gained, Countries For Page Views. This is an instantly available PowerPoint presentation that can be edited conveniently. Download it right away and captivate your audience.
-
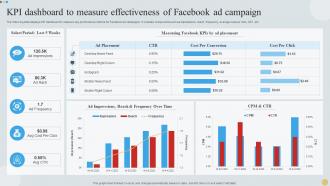 KPI Dashboard To Measure Effectiveness Of Facebook Ad Campaign
The following slide displays KPI dashboard to measure key performance metrics for Facebook ad campaigns. It includes components such as impressions, reach, frequency, average cost per click, CRT, etc. Presenting our well structured KPI Dashboard To Measure Effectiveness Of Facebook Ad Campaign. The topics discussed in this slide are Measuring Facebook, Ad Impressions, Placement. This is an instantly available PowerPoint presentation that can be edited conveniently. Download it right away and captivate your audience.
-
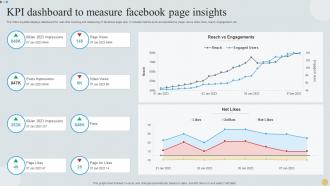 KPI Dashboard To Measure Facebook Page Insights
The following slide displays dashboard for real time tracking and measuring of facebook page kpis. It includes metrics such as impressions, page views, likes, fans, reach, engagement, etc. Introducing our KPI Dashboard To Measure Facebook Page Insights set of slides. The topics discussed in these slides are Reach Vs Engagements, Net Likes. This is an immediately available PowerPoint presentation that can be conveniently customized. Download it and convince your audience.
-
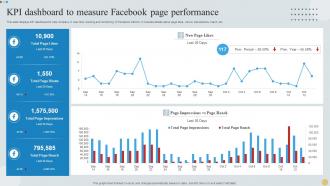 KPI Dashboard To Measure Facebook Page Performance
This slide displays KPI dashboard to help company in real- time tracking and monitoring of Facebook metrics. It includes details about page likes, views, impressions, reach, etc. Presenting our well structured KPI Dashboard To Measure Facebook Page Performance. The topics discussed in this slide are New Page Likes, Page Impressions. This is an instantly available PowerPoint presentation that can be edited conveniently. Download it right away and captivate your audience.
-
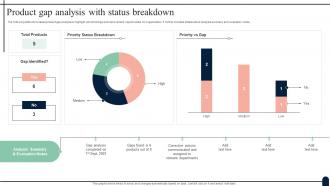 Product Gap Analysis With Status Breakdown
The following slide showcases product gap analysis to highlight shortcomings and improvement opportunities for organization. It further includes details about analysis summary and evaluation notes. Presenting our well structured Product Gap Analysis With Status Breakdown. The topics discussed in this slide are Priority Status Breakdown, Priority Vs Gap, Gap Identified. This is an instantly available PowerPoint presentation that can be edited conveniently. Download it right away and captivate your audience.
-
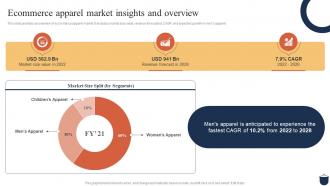 Ecommerce Apparel Market Insights And Overview Guide For Clothing Ecommerce
This slide provides an overview of ecommerce apparel market. It includes market size value, revenue forecasted, CAGR and expected growth in mens apparel. Present the topic in a bit more detail with this Ecommerce Apparel Market Insights And Overview Guide For Clothing Ecommerce. Use it as a tool for discussion and navigation on Ecommerce Apparel, Market Insights And Overview, Revenue Forecast. This template is free to edit as deemed fit for your organization. Therefore download it now.
-
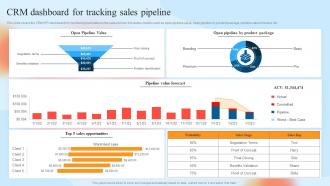 W12 CRM Dashboard For Tracking Sales Pipeline Customer Relationship Management System
This slide covers the CRM KPI dashboard for monitoring lead status in the sales funnel. It includes metrics such as open pipeline value, open pipeline by product package, pipeline value forecast, etc. Deliver an outstanding presentation on the topic using this W12 CRM Dashboard For Tracking Sales Pipeline Customer Relationship Management System. Dispense information and present a thorough explanation of Tracking, Sales, Value using the slides given. This template can be altered and personalized to fit your needs. It is also available for immediate download. So grab it now.
-
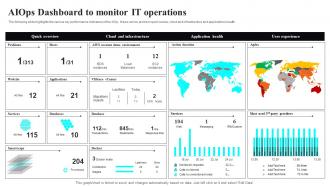 Artificial Intelligence IT Infrastructure AIOps Dashboard To Monitor It Operations
The following slide highlights the various key performance indicators of the AIOp, these can be problem quick review, cloud and infrastructure and applications health.Present the topic in a bit more detail with this Artificial Intelligence IT Infrastructure AIOps Dashboard To Monitor It Operations. Use it as a tool for discussion and navigation on Quick Overview, Cloud Infrastructure, Application Health. This template is free to edit as deemed fit for your organization. Therefore download it now.
-
 Software Deployment Plan Release Burndown Report To Measure Software Implementation
This slide represents the team progress towards the release date by plotting the remaining effort against the ideal effort. It includes details related to use cases of release burndown report. Deliver an outstanding presentation on the topic using this Software Deployment Plan Release Burndown Report To Measure Software Implementation. Dispense information and present a thorough explanation of Complete, Sprint Remaining using the slides given. This template can be altered and personalized to fit your needs. It is also available for immediate download. So grab it now.
-
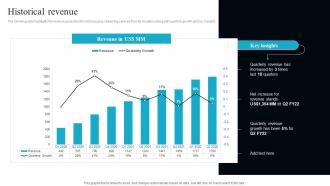 Historical Revenue OTT Service Technology Company Profile CP SS V
The following slide highlights the revenue generated from Disney plus streaming services from its inception along with quarterly growth and key insights. Deliver an outstanding presentation on the topic using this Historical Revenue OTT Service Technology Company Profile CP SS V. Dispense information and present a thorough explanation of Historical, Revenue, Quarterly using the slides given. This template can be altered and personalized to fit your needs. It is also available for immediate download. So grab it now.
-
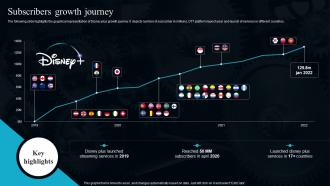 Subscribers Growth Journey OTT Service Technology Company Profile CP SS V
The following slide highlights the graphical representation of Disney plus growth journey. It depicts number of subscriber in millions, OTT platform launch year and launch of services in different countries. Present the topic in a bit more detail with this Subscribers Growth Journey OTT Service Technology Company Profile CP SS V. Use it as a tool for discussion and navigation on Services, Journey, Growth. This template is free to edit as deemed fit for your organization. Therefore download it now.
-
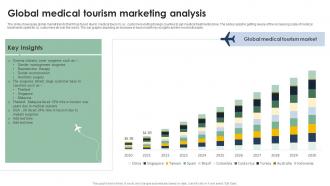 Global Medical Tourism Marketing Analysis
The slide showcases global market trends that it has faced due to medical tourism, i.e customers visiting foreign counties to get medical treatments done. The slides assist in getting aware of the increasing scale of medical treatments opted for by customers all over the world. The bar graphs depicting an increase in tourism with key insights are the most noticeable. Introducing our Global Medical Tourism Marketing Analysis set of slides. The topics discussed in these slides are Global Medical, Tourism Market. This is an immediately available PowerPoint presentation that can be conveniently customized. Download it and convince your audience.
-
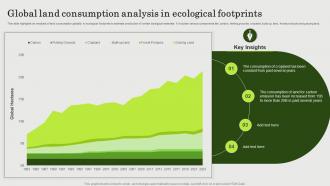 Global Land Consumption Analysis In Ecological Footprints
This slide highlights an analysis of land consumption globally in ecological footprints to estimate production of certain biological materials. It includes various components like carbon, fishing grounds, cropland, build up land, forest products and grazing land. Presenting our well structured Global Land Consumption Analysis In Ecological Footprints. The topics discussed in this slide are Global Land Consumption, Analysis In Ecological Footprints. This is an instantly available PowerPoint presentation that can be edited conveniently. Download it right away and captivate your audience.
-
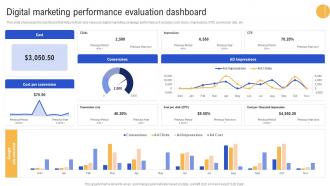 Digital Marketing Performance Evaluation Dashboard Advertisement Campaigns To Acquire Mkt SS V
This slide showcases the dashboard that helps to track and measure digital marketing campaign performance. It includes cost, clicks, impressions, STR, conversion rate, etc.Deliver an outstanding presentation on the topic using this Digital Marketing Performance Evaluation Dashboard Advertisement Campaigns To Acquire Mkt SS V. Dispense information and present a thorough explanation of Cost Per Conversion, Conversions, AD Impressions using the slides given. This template can be altered and personalized to fit your needs. It is also available for immediate download. So grab it now.
-
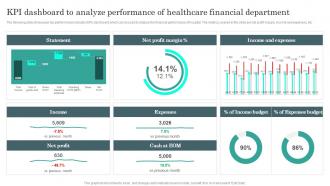 Kpi Dashboard To Analyze Performance General Administration Of Healthcare System
The following slide showcases key performance indicator KPI dashboard which can be used to analyze the financial performance of hospital. The metrics covered in the slide are net profit margin, income and expenses, etc. Present the topic in a bit more detail with this Kpi Dashboard To Analyze Performance General Administration Of Healthcare System. Use it as a tool for discussion and navigation on Statement, Net Profit Margin, Income. This template is free to edit as deemed fit for your organization. Therefore download it now.
-
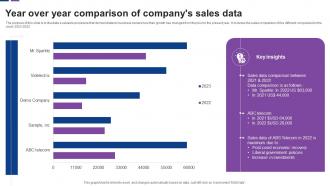 Year Over Year Comparison Of Companys Sales Data
The purpose of this slide is to illustrate a valuable procedure that demonstrates to business owners how their growth has changed from the prior to the present year. It includes the sales comparison of five different companies for the years 2023 2022 Introducing our Year Over Year Comparison Of Companys Sales Data set of slides. The topics discussed in these slides are Comparison, Between. This is an immediately available PowerPoint presentation that can be conveniently customized. Download it and convince your audience.
-
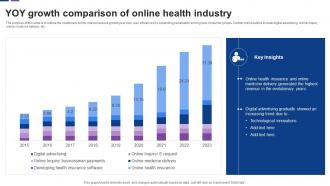 YOY Growth Comparison Of Online Health Industry
The purpose of this slide is to outline the healthcare online market revenue growth year over year influenced by expanding penetration among new consumer groups. Certain online tactics include digital advertising, online inquiry, online medicine delivery, etc Introducing our YOY Growth Comparison Of Online Health Industry set of slides. The topics discussed in these slides are Online Health Insurance, Medicine Delivery Generated. This is an immediately available PowerPoint presentation that can be conveniently customized. Download it and convince your audience.
-
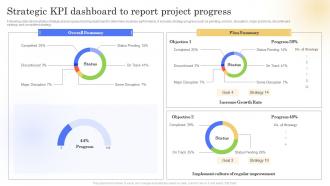 Strategic KPI Dashboard To Report Project Progress
Following slide demonstrates strategic plan progress tracking dashboard to determine business performance. It includes strategy progress such as pending, on track, disruption, major problems, discontinued strategy and completed strategy Introducing our Strategic KPI Dashboard To Report Project Progress set of slides. The topics discussed in these slides are Strategic, Report, Project. This is an immediately available PowerPoint presentation that can be conveniently customized. Download it and convince your audience.
-
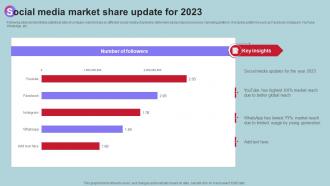 Social Media Market Share Update For 2023
Following slide demonstrates statistical data of company market share by different social media channels to determine best product and service marketing platform. It includes platforms such as Facebook, Instagram, YouTube, WhatsApp, etc. Presenting our well structured Social Media Market Share Update For 2023. The topics discussed in this slide are Market, Update, Media. This is an instantly available PowerPoint presentation that can be edited conveniently. Download it right away and captivate your audience.


