Charts, Graphs PowerPoint Designs, Presentation Charts Designs & PPT Graphics
- Sub Categories
-
- Arrows and Targets
- Bullet and Text Slides
- Charts and Graphs
- Circular Cycle Diagrams
- Concepts and Shapes
- Custom Flat Designs
- Dashboards and Measuring
- Flow Process
- Funnels
- Gears
- Growth
- Harvey Balls
- Idea Innovation and Light Bulbs
- Leadership
- Linear Process Diagrams
- Magnifying Glass
- Misc Other Graphics
- Opportunity and Handshake
- Organization Charts
- Puzzles
- Pyramids
- Roadmaps and Timelines
- Silhouettes
- Steps
- Strategic Planning Analysis
- SWOT Analysis
- Tables and Matrix
- Teamwork
- Technology and Communication
- Venn Diagrams
- Visuals and Illustrations
-
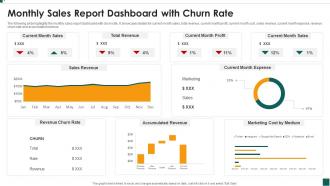 Monthly Sales Report Dashboard Snapshot With Churn Rate
The following slide highlights the monthly sales report dashboard snapshot with churn rate. It showcases details for current month sales, total revenue, current month profit, current month cost, sales revenue, current month expense, revenue churn rate and accumulated revenue. Presenting our well structured Monthly Sales Report Dashboard With Churn Rate. The topics discussed in this slide are Current Month Sales, Total Revenue, Current Month Expense. This is an instantly available PowerPoint presentation that can be edited conveniently. Download it right away and captivate your audience.
-
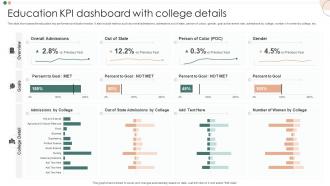 Education KPI Dashboard Snapshot With College Details
This slide showcases the education key performance indicator tracker. It also include metrics such as overall admissions, admissions out of state, person of colour, gender, goal achievement rate, admissions by college, number of women by college, etc. Presenting our well structured Education KPI Dashboard Snapshot With College Details. The topics discussed in this slide are Education KPI Dashboard. This is an instantly available PowerPoint presentation that can be edited conveniently. Download it right away and captivate your audience.
-
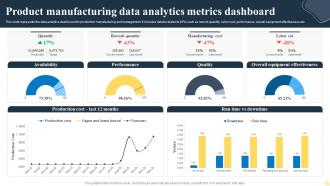 Product Manufacturing Data Analytics Metrics Dashboard
This slide represents the data analytics dashboard for production manufacturing and management. It includes details related to KPIs such as rework quantity, labor cost, performance, overall equipment effectiveness etc. Introducing our Product Manufacturing Data Analytics Metrics Dashboard set of slides. The topics discussed in these slides are Availability, Performance, Overall Equipment Effectiveness. This is an immediately available PowerPoint presentation that can be conveniently customized. Download it and convince your audience.
-
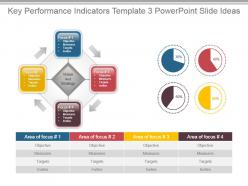 Key performance indicators template 3 powerpoint slide ideas
Presenting key performance indicators template 3 powerpoint slide ideas. Presenting key performance indicators template 3 powerpoint slide ideas. Presenting key performance indicators template 3 powerpoint slide ideas. This is a key performance indicators template 3 powerpoint slide ideas. This is four stage process. The stages in this process are objective, measures, targets, invites, area of focus, vision and strategy.
-
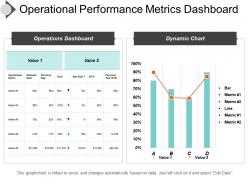 Operational performance metrics dashboard ppt summary
Presenting operational performance metrics dashboard ppt summary. This is a operational performance metrics dashboard ppt summary. This is a two stage process. The stages in this process are operational performance metrics, operational performance dashboard, operational performance kpis.
-
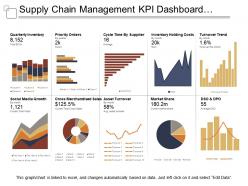 Supply chain management kpi dashboard showing quarterly inventory and asset turnover
Presenting this set of slides with name - Supply Chain Management Kpi Dashboard Showing Quarterly Inventory And Asset Turnover. This is a ten stage process. The stages in this process are Demand Forecasting, Predicting Future Demand, Supply Chain Management.
-
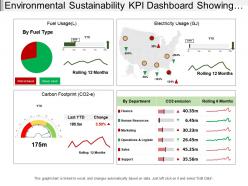 Environmental sustainability kpi dashboard showing carbon footprint and electricity usage
Presenting the environmental sustainability KPI dashboard PowerPoint slide. This presentation slide is fully editable in PowerPoint. It is customizable according to your requirement. The font color, style, size, diagram color and background color of slide can be changed as per your requirement. You can conveniently replace the sample content in text placeholders with your presentation content. This template is suitable for use with Google Slides. It can be saved in JPG or PDF formats. It is available in both standard size and wide screen size. Download it quickly at the click of a button.
-
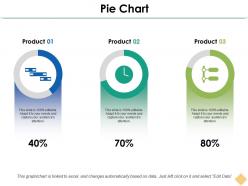 Pie chart ppt inspiration
Presenting this set of slides with name - Pie Chart Ppt Inspiration. This is a three stage process. The stages in this process are Business, Management, Strategy, Analysis, Icons.
-
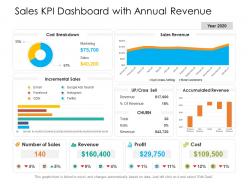 Sales kpi dashboard with annual revenue
Presenting this set of slides with name Sales KPI Dashboard With Annual Revenue. The topics discussed in these slides are Revenue, Cost, Profit. This is a completely editable PowerPoint presentation and is available for immediate download. Download now and impress your audience.
-
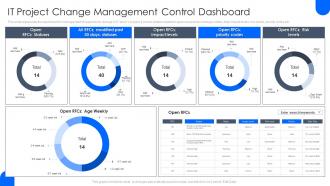 IT Project Change Management Control Dashboard
This slide represents the dashboard for management of requests for change in IT teams project. It shows details related to open requests for changes status, their impact levels, risk levels, priority codes etc. Introducing our IT Project Change Management Control Dashboard set of slides. The topics discussed in these slides are Risk Levels, Priority Codes, Control Dashboard. This is an immediately available PowerPoint presentation that can be conveniently customized. Download it and convince your audience.
-
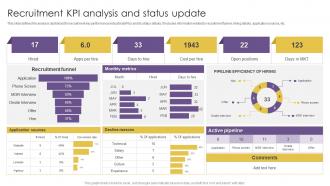 Recruitment KPI Analysis And Status Update
This slide defines the analysis dashboard for recruitment key performance indicators KPIs and its status details. It includes information related to recruitment funnel, hiring details, application sources, etc. Introducing our Recruitment KPI Analysis And Status Update set of slides. The topics discussed in these slides are Recruitment, KPI Analysis, Status Update. This is an immediately available PowerPoint presentation that can be conveniently customized. Download it and convince your audience.
-
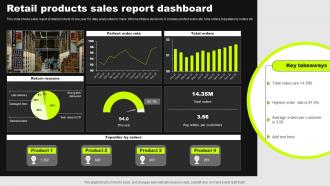 Retail Products Sales Report Dashboard
This slide shows sales report of retail products of one year for data analysation to make informed future decisions. It includes perfect order rate, total orders,topsellers by orders etc. Introducing our Retail Products Sales Report Dashboard set of slides. The topics discussed in these slides are Perfect Order Rate, Topseller By Orders. This is an immediately available PowerPoint presentation that can be conveniently customized. Download it and convince your audience.
-
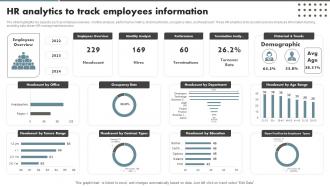 HR Analytics To Track Employees Information
The slide highlights key aspects such as employee overview, monthly analysis, performance metrics, historical trends, occupancy rates, and headcount. These HR analytics tools assist in precise employee information tracking, enabling data driven HR management decisions. Introducing our HR Analytics To Track Employees Information set of slides. The topics discussed in these slides are Headcount By Office, Headcount By Tenure Range, Headcount By Department. This is an immediately available PowerPoint presentation that can be conveniently customized. Download it and convince your audience.
-
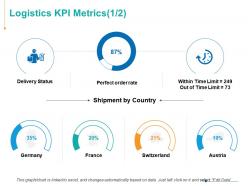 Logistics kpi metrics ppt powerpoint presentation model
Presenting this set of slides with name - Logistics KPI Metrics Ppt Powerpoint Presentation Model. This is a seven stage process. The stages in this process are Delivery Status, Finance, Analysis, Business, Investment.
-
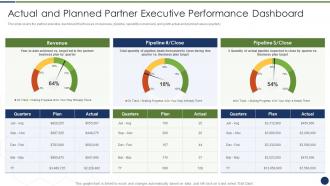 Improve management complex business actual planned partner executive performance
This slide covers the partner executive dashboard that focuses on revenues, pipeline, capability scoreboard, along with actual and planned values quarterly. Present the topic in a bit more detail with this Improve Management Complex Business Actual Planned Partner Executive Performance. Use it as a tool for discussion and navigation on Revenue, Pipeline, Quarters, Plan, Actual. This template is free to edit as deemed fit for your organization. Therefore download it now.
-
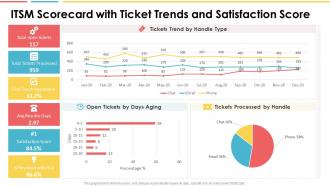 Itsm scorecard with ticket trends and satisfaction score ppt mockup
Deliver an outstanding presentation on the topic using this ITSM Scorecard With Ticket Trends And Satisfaction Score Ppt Mockup. Dispense information and present a thorough explanation of Total Open Tickets, Tickets Processed, First Touch Resolution using the slides given. This template can be altered and personalized to fit your needs. It is also available for immediate download. So grab it now.
-
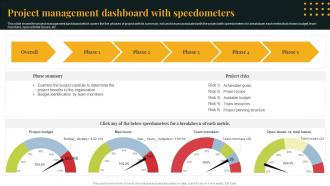 Project Management Dashboard With Speedometers
This slide shows the project management dashboard which covers the five phases of project with its summary, risk and issues associated with the project with speedometers for breakdown each metric that shows budget, team members, open ad total issues, etc. Introducing our Project Management Dashboard With Speedometers set of slides. The topics discussed in these slides are Achievable Goals, Available Budget, Team Resources, Project Planning Structure This is an immediately available PowerPoint presentation that can be conveniently customized. Download it and convince your audience.
-
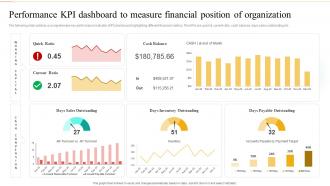 Performance KPI Dashboard To Measure Financial Position Of Organization Ultimate Guide To Financial Planning
The following slide outlines a comprehensive key performance indicator KPI dashboard highlighting different financial metrics. The KPIs are quick and current ratio, cash balance, days sales outstanding etc.Deliver an outstanding presentation on the topic using this Performance KPI Dashboard To Measure Financial Position Of Organization Ultimate Guide To Financial Planning. Dispense information and present a thorough explanation of Sales Outstanding, Inventory Outstanding, Payable Outstanding using the slides given. This template can be altered and personalized to fit your needs. It is also available for immediate download. So grab it now.
-
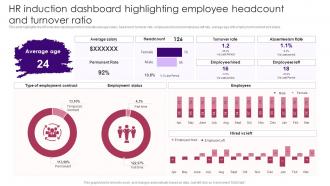 HR Induction Dashboard Highlighting Employee Headcount Staff Induction Training Guide
This slide highlights the HR induction dashboard which includes average salary, headcount, turnover rate, employees hired and employees left rate, average age with employment contract and status. Present the topic in a bit more detail with this HR Induction Dashboard Highlighting Employee Headcount Staff Induction Training Guide. Use it as a tool for discussion and navigation on Type Employment Contract, Employment Status, Employees. This template is free to edit as deemed fit for your organization. Therefore download it now.
-
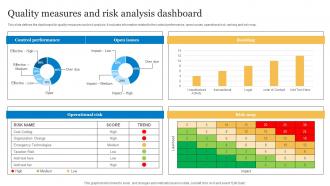 Quality Measures And Risk Analysis Dashboard
This slide defines the dashboard for quality measures and risk analysis. It includes information related to the control performance, open issues, operational risk, ranking and risk map. Presenting our well structured Quality Measures And Risk Analysis Dashboard. The topics discussed in this slide are Control Performance, Open Issues, Operational Risk. This is an instantly available PowerPoint presentation that can be edited conveniently. Download it right away and captivate your audience.
-
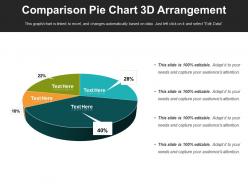 Comparison pie chart 3d arrangement
Presenting Comparison Pie Chart 3D Arrangement slide which is fully editable. You can alter the colors, fonts, font size, and font types of the slide as per the requirements. It can be converted into formats like PDF, JPG, and PNG. The template is available in both 4:3 and 16:9 aspect ratio. It is adaptable with Google Slides, which makes it accessible at once.
-
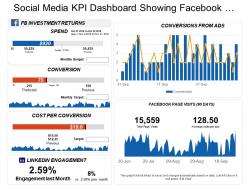 Social media kpi dashboard showing facebook investment returns conversion from ads
Presenting this set of slides with name - Social Media Kpi Dashboard Showing Facebook Investment Returns Conversion From Ads. This is a five stage process. The stages in this process are Social Media, Digital Marketing, Social Marketing.
-
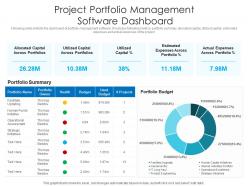 Project portfolio management software dashboard
Introducing our Project Portfolio Management Software Dashboard set of slides. The topics discussed in these slides are Allocated Capital Across Portfolios, Utilized Capital Across Portfolios, Management. This is an immediately available PowerPoint presentation that can be conveniently customized. Download it and convince your audience.
-
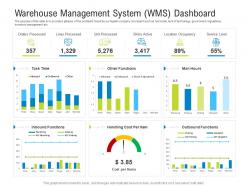 Warehouse management system wms dashboard service logistics management optimization ppt grid
The purpose of this slide is to provide a glimpse of the problems faced by our logistic company at present such as fuel costs, lack of technology, government regulations, inventory management etc. Deliver an outstanding presentation on the topic using this Warehouse Management System Wms Dashboard Service Logistics Management Optimization Ppt Grid. Dispense information and present a thorough explanation of Orders Processed, Lines Processed, Unit Processed, Location Occupancy, Service Level using the slides given. This template can be altered and personalized to fit your needs. It is also available for immediate download. So grab it now.
-
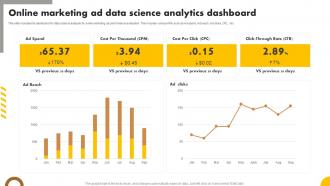 Online Marketing Ad Data Science Analytics Dashboard
This slide includes the dashboard for data science analysis for online marketing ad performance evaluation. This includes various KPIs such as Ad spend, Ad reach, Ad clicks, CPC, etc. Introducing our Online Marketing Ad Data Science Analytics Dashboard set of slides. The topics discussed in these slides are Marketing, Data, Analytics. This is an immediately available PowerPoint presentation that can be conveniently customized. Download it and convince your audience.
-
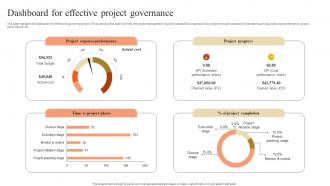 Dashboard For Effective Project Governance
This slide highlights the dashboard for effectively governing project. The purpose of this slide is to help the project management track and assess the progress of any project through evaluation of indicators such as project cost performance, project performance, etc. Introducing our Dashboard For Effective Project Governance set of slides. The topics discussed in these slides are Governance, Dashboard, Performance. This is an immediately available PowerPoint presentation that can be conveniently customized. Download it and convince your audience.
-
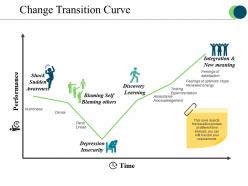 Change transition curve powerpoint slides
Presenting change transition curve powerpoint slides. This is a change transition curve powerpoint slides. This is a one stage process. The stages in this process are numbness, denial, panic dread, discovery learning, depression insecurity.
-
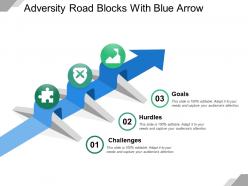 Adversity road blocks with blue arrow
Presenting this set of slides with name - Adversity Road Blocks With Blue Arrow. This is a three stage process. The stages in this process are Adversity, Problems And Challenges, Problems And Hurdles.
-
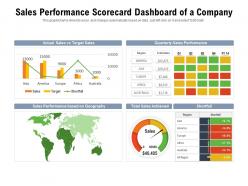 Sales Performance Scorecard Dashboard Of A Company
Presenting this set of slides with name Sales Performance Scorecard Dashboard Of A Company. The topics discussed in these slides are Target Sales, Quarterly Sales Performance, Sales Achieved, Geography. This is a completely editable PowerPoint presentation and is available for immediate download. Download now and impress your audience.
-
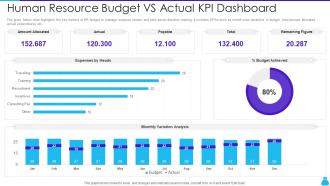 Human Resource Budget Vs Actual KPI Dashboard Snapshot
The given below slide highlights the key metrics of HR budget to manage expense stream and take assist decision making. It includes KPAs such as month wise variations in budget, total amount allocated, actual expenditures etc. Presenting our well-structured Human Resource Budget Vs Actual KPI Dashboard Snapshot. The topics discussed in this slide are Amount Allocated, Budget Achieved, Variation Analysis. This is an instantly available PowerPoint presentation that can be edited conveniently. Download it right away and captivate your audience.
-
 Business And It Alignment Introduction Of New Technologies And Services Ppt Show Example Introduction
This slide depicts the business strategy for introducing new technologies and services, including cloud, social, mobility, and big data. It also caters to the applications of these technologies in healthcare, high tech, public sector, retail, technology, software, hardware, and telecommunication. Deliver an outstanding presentation on the topic using this Business And It Alignment Introduction Of New Technologies And Services Ppt Show Example Introduction. Dispense information and present a thorough explanation of Introduction, Technologies, Services using the slides given. This template can be altered and personalized to fit your needs. It is also available for immediate download. So grab it now.
-
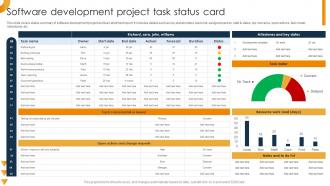 Software Development Project Task Status Card
This slide covers status summary of software development project and task allotment report. It includes details such as key stakeholders, tasks list, assigned person, start and dates, top concerns, open actions, task meter, milestones, etc. Presenting our well structured Software Development Project Task Status Card. The topics discussed in this slide are Software Development, Project Task Status Card, Resource Work. This is an instantly available PowerPoint presentation that can be edited conveniently. Download it right away and captivate your audience.
-
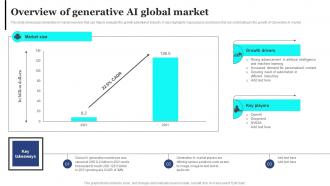 Overview Of Generative AI Global Market Strategic Guide For Generative AI Tools And Technologies AI SS V
This slide showcases Generative AI market overview that can help to evaluate the growth potential of industry. It also highlights major players and drivers that are contributing to the growth of Generative AI market. Deliver an outstanding presentation on the topic using this Overview Of Generative AI Global Market Strategic Guide For Generative AI Tools And Technologies AI SS V. Dispense information and present a thorough explanation of Market Size, Growth Drivers, Artificial Intelligence using the slides given. This template can be altered and personalized to fit your needs. It is also available for immediate download. So grab it now.
-
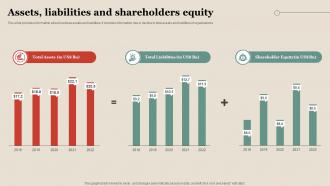 Assets Liabilities And Shareholders Equity Property Company Profile CP SS V
This slide provides information about business assets and liabilities. It includes information rise or decline in total assets and liabilities of organizations Present the topic in a bit more detail with this Assets Liabilities And Shareholders Equity Property Company Profile CP SS V Use it as a tool for discussion and navigation on Total Assets, Total Liabilities, Shareholder Equity This template is free to edit as deemed fit for your organization. Therefore download it now.
-
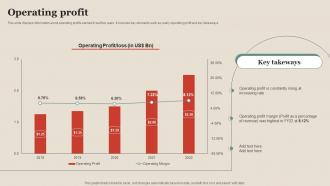 Operating Profit Property Company Profile CP SS V
This slide displays information about operating profits earned in last five years. It includes key elements such as yearly operating profit and key takeaways Present the topic in a bit more detail with this Operating Profit Property Company Profile CP SS V Use it as a tool for discussion and navigation on Operating Profit This template is free to edit as deemed fit for your organization. Therefore download it now.
-
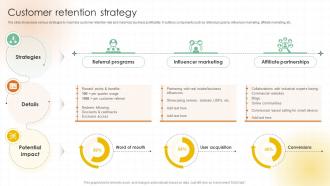 Customer Retention Strategy Tech Startup Go To Market Strategy GTM SS
The slide showcases various strategies to maximize customer retention rate and maximize business profitability. It outlines components such as referral programs, influencer marketing, affiliate marketing, etc. Deliver an outstanding presentation on the topic using this Customer Retention Strategy Tech Startup Go To Market Strategy GTM SS Dispense information and present a thorough explanation of Referral Programs, Influencer Marketing, Affiliate Partnerships using the slides given. This template can be altered and personalized to fit your needs. It is also available for immediate download. So grab it now.
-
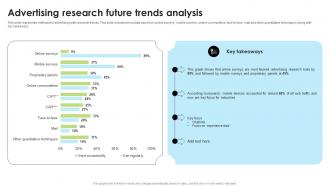 Advertising Research Future Trends Analysis
This slide represents methods for advertising with research trends. This slide includes trend data based on online surveys, mobile surveys, online communities, face to face, mail and other quantitative techniques along with key takeaways. Introducing our Advertising Research Future Trends Analysis set of slides. The topics discussed in these slides are Advertising Research, Future Trends Analysis, Mobile Surveys, Online Communities. This is an immediately available PowerPoint presentation that can be conveniently customized. Download it and convince your audience.
-
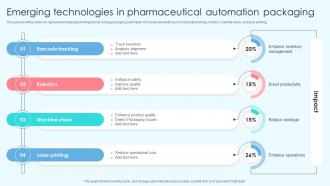 Emerging Technologies In Pharmaceutical Automation Packaging
The purpose of this slide is to represent emerging technology trends in drug packaging automation. It includes elements such as barcode tracking, robotics, machine vision, and laser printing. Presenting our well structured Emerging Technologies In Pharmaceutical Automation Packaging. The topics discussed in this slide are Track Inventory, Analysis Shipment, Enhance Product Quality, Detect Packaging Issues. This is an instantly available PowerPoint presentation that can be edited conveniently. Download it right away and captivate your audience.
-
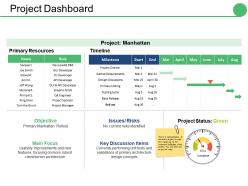 Project dashboard ppt gallery slides
Presenting this set of slides with name - Project Dashboard Ppt Gallery Slides. This is a two stage process. The stages in this process are Milestone, Project, Objective, Main Focus, Key Discussion Items.
-
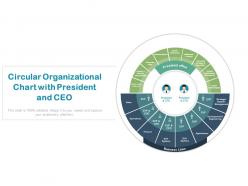 Circular organizational chart with president and ceo
Presenting this set of slides with name Circular Organizational Chart With President And CEO. This is a two stage process. The stages in this process are Circular Organizational Chart, Hierarchy Organizational Chart, Interconnected Organizational Chart. This is a completely editable PowerPoint presentation and is available for immediate download. Download now and impress your audience.
-
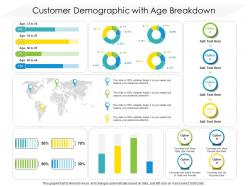 Customer demographic with age breakdown
Presenting this set of slides with name Customer Demographic With Age Breakdown. The topics discussed in these slide is Customer Demographic With Age Breakdown. This is a completely editable PowerPoint presentation and is available for immediate download. Download now and impress your audience.
-
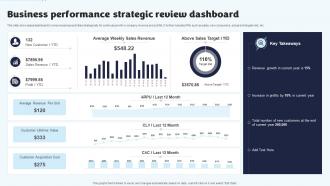 Business Performance Strategic Review Dashboard
This slide showcases dashboard to review business activities strategically for continual growth in company revenue and profits. It further includes KPIs such as sales, new consumers, actual and targets met, etc. Introducing our Business Performance Strategic Review Dashboard set of slides. The topics discussed in these slides are Sales Revenue, Target, Average. This is an immediately available PowerPoint presentation that can be conveniently customized. Download it and convince your audience.
-
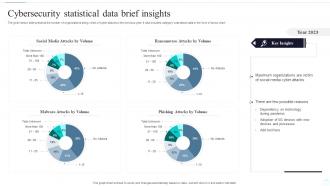 Cybersecurity Statistical Data Brief Insights
The given below slide presents the number of organizations being victim of cyber attacks in the previous year. It also includes category wise attack data in the form of donut chart. Presenting our well structured Cybersecurity Statistical Data Brief Insights. The topics discussed in this slide are Social Media, Phishing Attacks, Malware Attacks. This is an instantly available PowerPoint presentation that can be edited conveniently. Download it right away and captivate your audience.
-
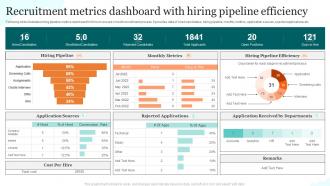 Recruitment Metrics Dashboard With Hiring Pipeline Efficiency
Following slide illustrates hiring pipeline metrics dashboard for firms to ensure smooth recruitment process. It provides data of hired candidates, hiring pipeline, monthly metrics, application sources, rejected applications etc. Introducing our Recruitment Metrics Dashboard With Hiring Pipeline Efficiency set of slides. The topics discussed in these slides are Hiring Pipeline, Monthly Metrics, Hiring Pipeline Efficiency. This is an immediately available PowerPoint presentation that can be conveniently customized. Download it and convince your audience.
-
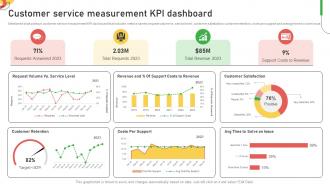 Customer Service Measurement KPI Dashboard Improving Customer Service And Ensuring
Mentioned slide portrays customer service measurement KPI dashboard that includes metrics namely request volume vs. service level, customer satisfaction, customer retention, costs per support and average time to solve issue. Present the topic in a bit more detail with this Customer Service Measurement KPI Dashboard Improving Customer Service And Ensuring. Use it as a tool for discussion and navigation on Service Level, Customer Satisfaction, Costs. This template is free to edit as deemed fit for your organization. Therefore download it now.
-
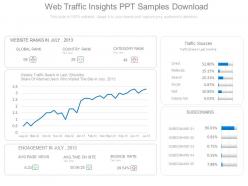 Web traffic insights ppt samples download
SlideTeam presents to you this beautifully designed web traffic insights PPT sample download. You can make a number of changes to the given prepared slides, as they are totally customizable. All you have to do is follow instructions given in the sample PPT. The slideshow can be viewed in standard size display ratio of 4:3 or widescreen display ratio of 16:9. The presentation is also compatible with Google Slides. The business template can be conveniently saved in format of PDF or JPG.
-
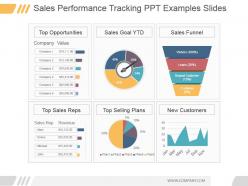 Sales performance tracking ppt examples slides
Presenting sales performance tracking ppt examples slides. This is a sales performance tracking ppt examples slides. This is a four stage process. The stages in this process are top opportunities, sales goal ytd, sales funnel, company, value, company, visitors, leads, repeat customer, customer, top sales reps, top selling plans, new customers, plan, jan, mar, may, jul, sep, nov, sales rep, mary, emma, michael, john.
-
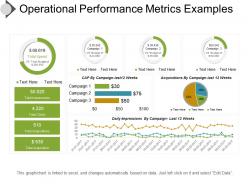 Operational performance metrics examples presentation ideas
Presenting operational performance metrics PPT image layout. This is competently constructed and readily useable PowerPoint template. Amend able subject matter, PowerPoint image, types, fonts etc. Prompt content with flexible option to insert company logo, trademark, or name. High resolution PPT template. Well served with all Google Slides. Projected on wide screen with high quality PPT graphic. Beneficial for the business managers and other professionals.
-
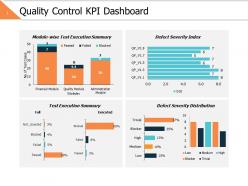 Quality control kpi dashboard ppt powerpoint presentation gallery diagrams
Presenting this set of slides with name - Quality Control Kpi Dashboard Ppt Powerpoint Presentation Gallery Diagrams. This is a four stage process. The stages in this process are Business, Management, Strategy, Analysis, Finance.
-
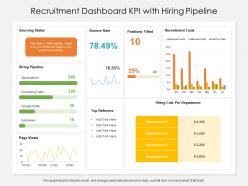 Recruitment dashboard kpi with hiring pipeline
Presenting this set of slides with name Recruitment Dashboard KPI With Hiring Pipeline. The topics discussed in these slides are Sourcing Status, Bounce Rate, Positions Filled, Recruitment Costs, Hiring Cost Per Department. This is a completely editable PowerPoint presentation and is available for immediate download. Download now and impress your audience.
-
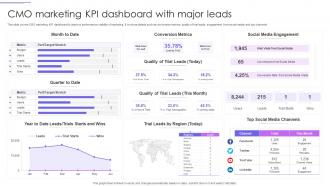 CMO Marketing KPI Dashboard With Major Leads
This slide covers CMO marketing KPI dashboard to improve performance visibility of marketing. It involves details such as conversion metrics, quality of trial leads, engagement from social media and top channels. Introducing our CMO Marketing KPI Dashboard With Major Leads set of slides. The topics discussed in these slides are Conversion Metrics, Social Media Engagement, Trial Leads. This is an immediately available PowerPoint presentation that can be conveniently customized. Download it and convince your audience.
-
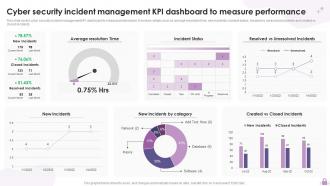 Cyber Security Incident Management KPI Dashboard To Measure Performance
This slide covers cyber security incident management KPI dashboard to measure performance. It involves details such as average resolution time, new incidents, incident status, resolved vs unresolved incidents and created vs closed incidents. Introducing our Cyber Security Incident Management KPI Dashboard To Measure Performance set of slides. The topics discussed in these slides are Cyber Security, Incident Management, KPI Dashboard, Measure Performance. This is an immediately available PowerPoint presentation that can be conveniently customized. Download it and convince your audience.
-
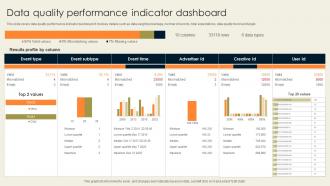 Data Quality Performance Indicator Dashboard
This slide covers data quality performance indicator dashboard. It involves details such as data weight percentage, number of records, total expectations, data quality trend and target. Presenting our well structured Data Quality Performance Indicator Dashboard. The topics discussed in this slide are Event Type, Event Subtype, Event Time, Advertiser Id. This is an instantly available PowerPoint presentation that can be edited conveniently. Download it right away and captivate your audience.
-
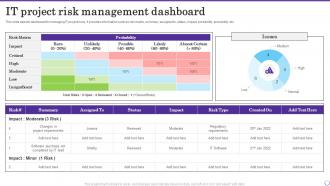 IT Project Risk Management Dashboard
This slide depicts dashboard for managing IT project risks. It provides information such as risk matrix, summary, assigned to, status, impact, probability, probability, etc. Presenting our well structured IT Project Risk Management Dashboard. The topics discussed in this slide are project risk, management dashboard, Probability. This is an instantly available PowerPoint presentation that can be edited conveniently. Download it right away and captivate your audience.
-
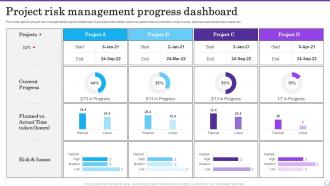 Project Risk Management Progress Dashboard
This slide depicts project risk management progress dashboard. It provides information about key performance indicators, risks, issues, planned and actual hours spent, etc. Introducing our Project Risk Management Progress Dashboard set of slides. The topics discussed in these slides are Projects, Current Progress, progress dashboard. This is an immediately available PowerPoint presentation that can be conveniently customized. Download it and convince your audience.
-
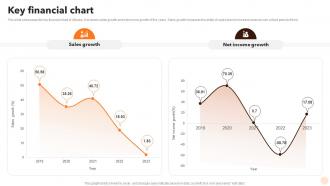 Key Financial Chart Alibaba Company Profile Ppt Microsoft CP SS
Present the topic in a bit more detail with this Key Financial Chart Alibaba Company Profile Ppt Microsoft CP SS. Use it as a tool for discussion and navigation on Sales Growth, Net Income Growth. This template is free to edit as deemed fit for your organization. Therefore download it now.
-
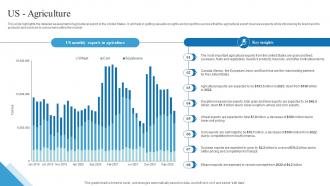 Us Agriculture Outbound Trade Business Plan BP SS
This slide highlights the detailed assessment of agricultural export in the United States. It will help in getting valuable insights and project the success that the agricultural export business expects while introducing its brand and its products and services to consumers within the market. Present the topic in a bit more detail with this Us Agriculture Outbound Trade Business Plan BP SS Use it as a tool for discussion and navigation on Us Agriculture, Exports In Agriculture This template is free to edit as deemed fit for your organization. Therefore download it now.
-
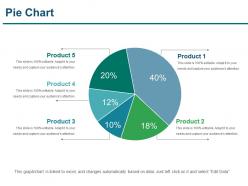 Pie chart powerpoint slide inspiration
Presenting pie chart powerpoint slide inspiration. This is a pie chart powerpoint slide inspiration . This is a five stage process. The stages in this process are pie chart, finance, marketing, strategy, analysis, business.
-
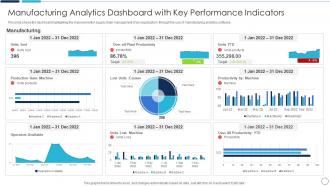 Manufacturing Analytics Dashboard With Key Performance Indicators
This slide shows the dashboard highlighting the improvement in supply chain management of an organization through the use of manufacturing analytics software. Presenting our well structured Manufacturing Analytics Dashboard With Key Performance Indicators. The topics discussed in this slide are Productivity, Manufacturing, Performance. This is an instantly available PowerPoint presentation that can be edited conveniently. Download it right away and captivate your audience.
-
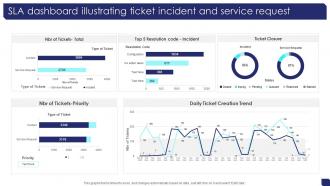 SLA Dashboard Illustrating Ticket Incident And Service Request
Introducing our SLA Dashboard Illustrating Ticket Incident And Service Request set of slides. The topics discussed in these slides are Resolution Code, Ticket Closure, Daily Ticket Creation Trend. This is an immediately available PowerPoint presentation that can be conveniently customized. Download it and convince your audience.


