Charts, Graphs PowerPoint Designs, Presentation Charts Designs & PPT Graphics
- Sub Categories
-
- Arrows and Targets
- Bullet and Text Slides
- Charts and Graphs
- Circular Cycle Diagrams
- Concepts and Shapes
- Custom Flat Designs
- Dashboards and Measuring
- Flow Process
- Funnels
- Gears
- Growth
- Harvey Balls
- Idea Innovation and Light Bulbs
- Leadership
- Linear Process Diagrams
- Magnifying Glass
- Misc Other Graphics
- Opportunity and Handshake
- Organization Charts
- Puzzles
- Pyramids
- Roadmaps and Timelines
- Silhouettes
- Steps
- Strategic Planning Analysis
- SWOT Analysis
- Tables and Matrix
- Teamwork
- Technology and Communication
- Venn Diagrams
- Visuals and Illustrations
-
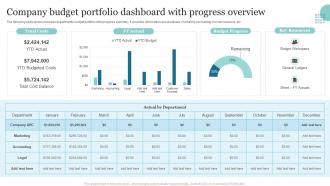 Company Budget Portfolio Dashboard With Progress Overview
The following slide shows business departments budget portfolio with progress summary. It provides information about actuals, marketing accounting, human resource, etc. Introducing our Company Budget Portfolio Dashboard With Progress Overview set of slides. The topics discussed in these slides are Total Costs, Budget Progress, Key Resources. This is an immediately available PowerPoint presentation that can be conveniently customized. Download it and convince your audience.
-
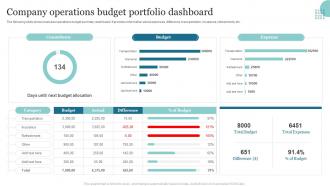 Company Operations Budget Portfolio Dashboard
The following slide shows business operations budget summary dashboard. It provides information about expenses, difference, transportation, insurance, refreshment, etc. Presenting our well structured Company Operations Budget Portfolio Dashboard. The topics discussed in this slide are Transportation, Refreshment, Insurance. This is an instantly available PowerPoint presentation that can be edited conveniently. Download it right away and captivate your audience.
-
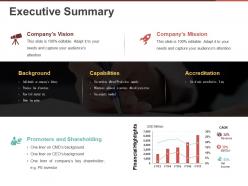 Executive summary powerpoint themes
Presenting this set of slides with name - Executive Summary Powerpoint Themes. This is a three stage process. The stages in this process are Bar Chart, Finance, Marketing, Analysis, Strategy, Business.
-
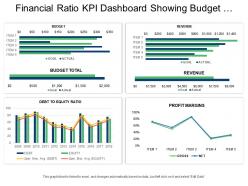 Financial ratio kpi dashboard snapshot showing budget revenue and profit margins
Presenting this set of slides with name - Financial Ratio Kpi Dashboard Snapshot Showing Budget Revenue And Profit Margins. This is a four stage process. The stages in this process are Accounting Ratio, Financial Statement, Financial Ratio.
-
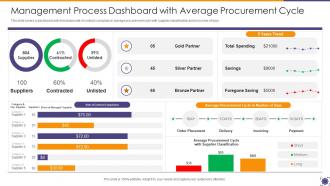 Management Process Dashboard With Average Procurement Cycle
This slide covers a dashboard which encloses rate of contract compliance, average procurement cycle with supplier classification and in number of days. Presenting our well structured Management Process Dashboard With Average Procurement Cycle The topics discussed in this slide are Management Process Dashboard With Average Procurement Cycle . This is an instantly available PowerPoint presentation that can be edited conveniently. Download it right away and captivate your audience.
-
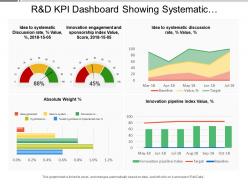 R and d kpi dashboard showing systematic discussion rate innovation engagement and sponsorship index
Presenting this set of slides with name - R And D Kpi Dashboard Showing Systematic Discussion Rate Innovation Engagement And Sponsorship Index. This is a four stage process. The stages in this process are R And D, Research And Development, Research And Technological Development.
-
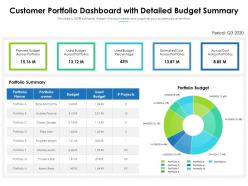 Customer portfolio dashboard with detailed budget summary
Presenting this set of slides with name Customer Portfolio Dashboard With Detailed Budget Summary. The topics discussed in these slides are Planned, Budget, Portfolio. This is a completely editable PowerPoint presentation and is available for immediate download. Download now and impress your audience.
-
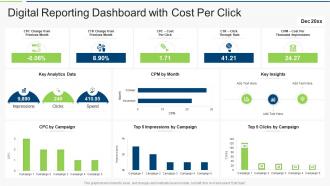 Digital reporting dashboard snapshot with cost per click
Presenting our well structured Digital Reporting Dashboard Snapshot With Cost Per Click. The topics discussed in this slide are Cost, Rate, Analytics Data. This is an instantly available PowerPoint presentation that can be edited conveniently. Download it right away and captivate your audience.
-
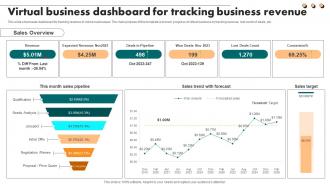 Virtual Business Dashboard For Tracking Business Revenue
This slide showcases dashboard for tracking revenue of online businesses. The main purpose of this template is to track progress of virtual business by tracking revenue, lost count of deals, etc. Introducing our Virtual Business Dashboard For Tracking Business Revenue set of slides. The topics discussed in these slides are Revenue, Deals In Pipeline. This is an immediately available PowerPoint presentation that can be conveniently customized. Download it and convince your audience.
-
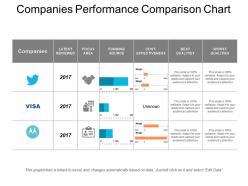 Companies performance comparison chart powerpoint templates
Presenting Companies Performance Comparison Chart Powerpoint Template. The slide is totally compatible with Google Slides. It can be customised as per your requirement. Also, related content can be added in the text holders provided. The size, style and color of the font can be changed according to your requirement. The slide is available in two sizes - standard screen size and wide screen size. It has a high resolution which ensures that the image does not blur upon enlarging. It can be downloaded easily.
-
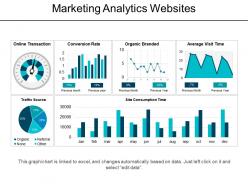 Marketing analytics websites powerpoint topics
Presenting marketing analytics websites powerpoint topics. This is a marketing analytics websites powerpoint topics. This is a six stage process. The stages in this process are market analysis, marketing analytics, web analytics, marketing optimization.
-
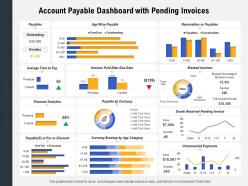 Account payable dashboard with pending invoices
Presenting this set of slides with name Account Payable Dashboard With Pending Invoices. The topics discussed in these slides are Price, Currency, Analytics. This is a completely editable PowerPoint presentation and is available for immediate download. Download now and impress your audience.
-
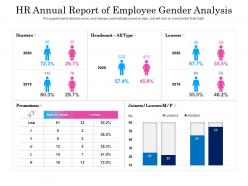 Hr Annual Report Of Employee Gender Analysis
Presenting this set of slides with name HR Annual Report Of Employee Gender Analysis. The topics discussed in these slides are Promotions, Headcount, Leavers. This is a completely editable PowerPoint presentation and is available for immediate download. Download now and impress your audience.
-
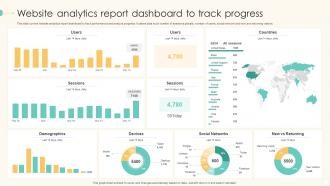 Website Analytics Report Dashboard Snapshot To Track Progress
This slide covers website analytics report dashboard snapshot to track performance and analyze progress. It caters data such number of sessions globally, number of users, social network and new and returning visitors. Presenting our well-structured Website Analytics Report Dashboard To Track Progress. The topics discussed in this slide are Website Analytics Report, Dashboard, Track Progress. This is an instantly available PowerPoint presentation that can be edited conveniently. Download it right away and captivate your audience.
-
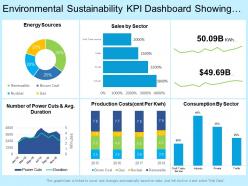 Environmental sustainability kpi dashboard showing total consumption sales energy sources
Presenting this set of slides with name - Environmental Sustainability Kpi Dashboard Showing Total Consumption Sales Energy Sources. This is a six stage process. The stages in this process are Environment Sustainability, Environment Continual, Environment Feasibility.
-
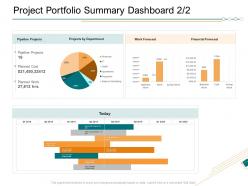 Project portfolio summary dashboard department ppt show influencers
Presenting this set of slides with name Project Portfolio Summary Dashboard Department Ppt Show Influencers. The topics discussed in these slides are Pipeline Projects, Projects By Department, Work Forecast, Financial Forecast. This is a completely editable PowerPoint presentation and is available for immediate download. Download now and impress your audience.
-
 Project target achievement progress report
Present the topic in a bit more detail with this Project Target Achievement Progress Report. Use it as a tool for discussion and navigation on planned, work in progress, overall project roi. This template is free to edit as deemed fit for your organization. Therefore download it now.
-
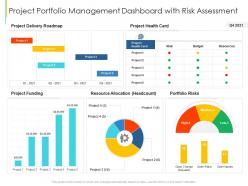 Project portfolio management dashboard with risk assessment
Presenting our well structured Project Portfolio Management Dashboard With Risk Assessment. The topics discussed in this slide are Project Funding, Project Delivery Roadmap, Portfolio Risks. This is an instantly available PowerPoint presentation that can be edited conveniently. Download it right away and captivate your audience.
-
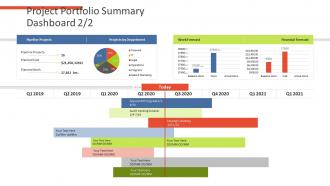 Project portfolio summary dashboard financial assets analysis
Deliver an outstanding presentation on the topic using this Project Portfolio Summary Dashboard Financial Assets Analysis. Dispense information and present a thorough explanation of Pipeline Projects, Work Forecast, Financial Forecast, Projects Department using the slides given. This template can be altered and personalized to fit your needs. It is also available for immediate download. So grab it now.
-
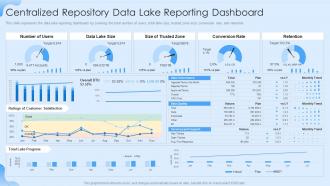 Data Lake Formation Centralized Repository Data Lake Reporting Dashboard
This slide represents the data lake reporting dashboard by covering the total number of users, total lake size, trusted zone size, conversion rate, and retention. Deliver an outstanding presentation on the topic using this Data Lake Formation Centralized Repository Data Lake Reporting Dashboard. Dispense information and present a thorough explanation of Data Lake Size, Conversion Rate, Retention using the slides given. This template can be altered and personalized to fit your needs. It is also available for immediate download. So grab it now.
-
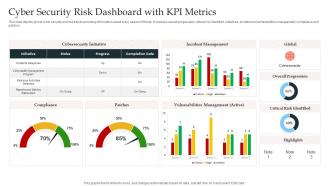 Cyber Security Risk Dashboard Snapshot With KPI Metrics
This slide depicts global cyber security and risk trends providing information about every aspect of threat. It includes overall progression, critical risk identified, initiatives, incident and vulnerabilities management, compliance and patches. Introducing our Cyber Security Risk Dashboard Snapshot With KPI Metrics set of slides. The topics discussed in these slides are Incident Management, Global, Cybersecurity, Vulnerabilities Management. This is an immediately available PowerPoint presentation that can be conveniently customized. Download it and convince your audience.
-
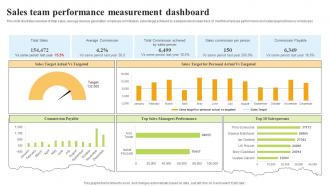 Sales Team Performance Measurement Dashboard
This slide illustrates overview of total sales, average revenue generation, employee commission, sales target achieved by salespersons to keep track of monthly employee performance and sales target achieve by employees. Introducing our Sales Team Performance Measurement Dashboard set of slides. The topics discussed in these slides are Sales Target, Sales Managers Performance, Commission Payable. This is an immediately available PowerPoint presentation that can be conveniently customized. Download it and convince your audience.
-
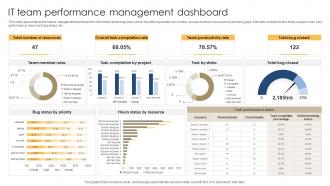 It Team Performance Management Dashboard
This slide represents performance management dashboard for information technology team which benefits organization to monitor, assess and track resources for planning gaps. Elements included in this slide are team roles, task performance, hours and bug status, etc. Presenting our well structured It Team Performance Management Dashboard. The topics discussed in this slide are Completion Rate, Team Productivity, Total Bug Closed. This is an instantly available PowerPoint presentation that can be edited conveniently. Download it right away and captivate your audience.
-
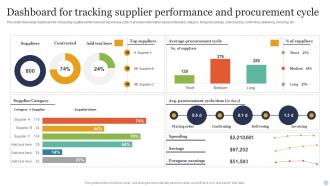 Dashboard For Tracking Supplier Performance And Procurement Cycle
This slide showcases dashboard for measuring supplier performance and purchase cycle. It provides information about contracted, category, foregone savings, order placing, confirming, delivering, invoicing, etc. Presenting our well structured Dashboard For Tracking Supplier Performance And Procurement Cycle. The topics discussed in this slide are Supplier Category, Procurement Cycle Time, Average Procurement. This is an instantly available PowerPoint presentation that can be edited conveniently. Download it right away and captivate your audience.
-
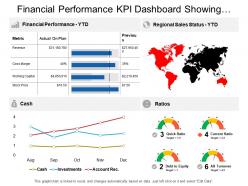 Financial performance kpi dashboard showing regional sales status cash and ratios
Presenting this set of slides with name - Financial Performance Kpi Dashboard Showing Regional Sales Status Cash And Ratios. This is a four stage process. The stages in this process are Financial Performance, Financial Report, Financial Review.
-
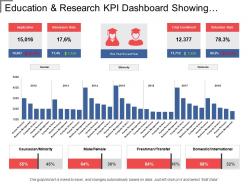 Education and research kpi dashboard showing retention rate and admissions
Presenting education and research KPI dashboard showing retention rate and admissions PPT slide. The KPI for school teachers PPT slide designed by professional team of SlideTeam. The education presentation slide is customizable in PowerPoint. The education KPI dashboard PowerPoint template is also compatible with Google Slide so a user can share this template with others via the internet. A user can make changes in the font size, font type, color as well as dimensions of the key performance indicators for schools & education management PPT slide as per the requirement. You may edit the value in the KPI dashboard higher education template as the template get linked with Excel sheet.
-
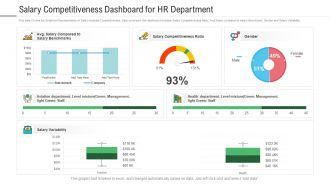 Salary competitiveness dashboard snapshot for hr department powerpoint template
This slide Covers the Graphical Representation of Salary analysis Competitiveness. Data covered in this dashboard includes-Salary Competitiveness Ratio, Avg Salary compared to salary Benchmark, Gender and Salary Variability. This is a Salary Competitiveness Dashboard snapshot For HR Department Powerpoint Template featuring in built editable components to add your personal touches. Tailor this template as per your liking and display it on a widescreen or standard screen, the choice is yours.
-
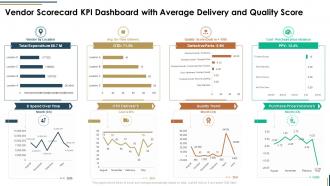 Vendor scorecard kpi dashboard with average delivery and quality score ppt file
Deliver an outstanding presentation on the topic using this Vendor Scorecard KPI Dashboard With Average Delivery And Quality Score Ppt File. Dispense information and present a thorough explanation of Quality Score, Cost Purchase Price, Quality Trend using the slides given. This template can be altered and personalized to fit your needs. It is also available for immediate download. So grab it now.
-
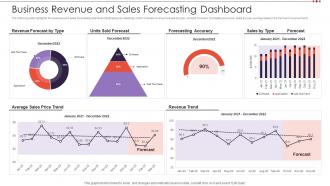 Business Revenue And Sales Forecasting Dashboard Snapshot
The following slide highlights the business and sales forecasting dashboard snapshot illustrating key headings which includes revenue forecast by type, unit sold forecast, forecasting accuracy, sales by type, average sales price trend and revenue trend. Presenting our well structured Business Revenue And Sales Forecasting Dashboard. The topics discussed in this slide are Revenue, Forecasting Accuracy, Sales. This is an instantly available PowerPoint presentation that can be edited conveniently. Download it right away and captivate your audience.
-
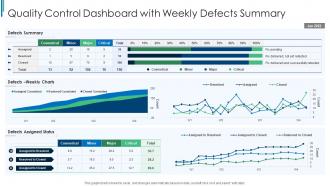 Quality Control Dashboard Snapshot With Weekly Defects Summary
This graph or chart is linked to excel, and changes automatically based on data. Just left click on it and select edit data. Introducing our Quality Control Dashboard Snapshot With Weekly Defects Summary set of slides. The topics discussed in these slides are Defects Summary, Defects Weekly Charts, Defects Assigned Status. This is an immediately available PowerPoint presentation that can be conveniently customized. Download it and convince your audience.
-
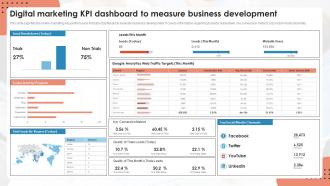 Digital Marketing KPI Dashboard To Measure Business Development
This slide signifies the online marketing key performance indicator dashboard to evaluate business development. It covers information regarding to leads breakdown, key conversion metrics, top social media channels. Introducing our Digital Marketing KPI Dashboard To Measure Business Development set of slides. The topics discussed in these slides are Digital Marketing, KPI Dashboard, Measure Business Development. This is an immediately available PowerPoint presentation that can be conveniently customized. Download it and convince your audience.
-
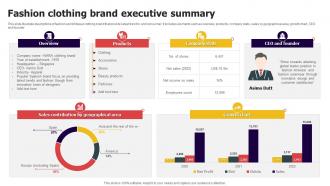 Fashion Clothing Brand Executive Summary
This slide illustrate descriptions of fashion and knitwear clothing brand that provide latest trend to end consumer. It includes elements such as overview, products, company stats, sales by geographical area, growth chart, CEO and founder Presenting our well structured Fashion Clothing Brand Executive Summary. The topics discussed in this slide are Products, Company Stats, Growth Chart. This is an instantly available PowerPoint presentation that can be edited conveniently. Download it right away and captivate your audience.
-
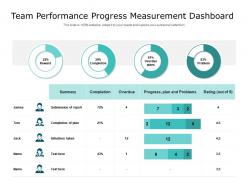 Team performance progress measurement dashboard
Presenting this set of slides with name Team Performance Progress Measurement Dashboard. The topics discussed in these slide is Team Performance Progress Measurement Dashboard. This is a completely editable PowerPoint presentation and is available for immediate download. Download now and impress your audience.
-
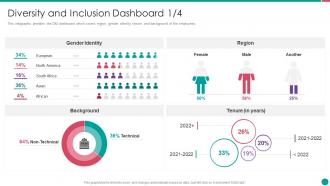 Diversity and inclusion dashboard diversity and inclusion management
This infographic provides the D and I dashboard which covers region, gender identity, tenure, and background of the employees. Present the topic in a bit more detail with this Diversity And Inclusion Dashboard Diversity And Inclusion Management. Use it as a tool for discussion and navigation on Diversity And Inclusion Dashboard. This template is free to edit as deemed fit for your organization. Therefore download it now.
-
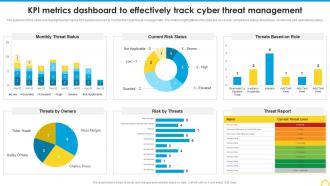 KPI Metrics Dashboard To Effectively Building A Security Awareness Program
The purpose of this slide is to highlight performance KPI dashboard used to monitor the cyber threat management. The metrics highlighted in the slide are risk score, compliance status, threat level, monitoring and operational status. Present the topic in a bit more detail with this KPI Metrics Dashboard To Effectively Building A Security Awareness Program. Use it as a tool for discussion and navigation on Threat Management, Metrics Dashboard. This template is free to edit as deemed fit for your organization. Therefore download it now.
-
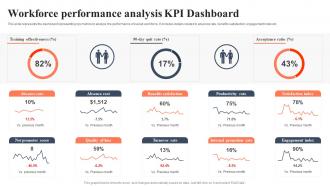 Workforce Performance Analysis KPI Dashboard Bi For Human Resource Management
This slide represents the dashboard representing key metrics to analyze the performance of overall workforce. It includes details related to absence rate, benefits satisfaction, engagement index etc. Deliver an outstanding presentation on the topic using this Workforce Performance Analysis KPI Dashboard Bi For Human Resource Management. Dispense information and present a thorough explanation of Training Effectiveness, Absence Rate, Absence Cost using the slides given. This template can be altered and personalized to fit your needs. It is also available for immediate download. So grab it now.
-
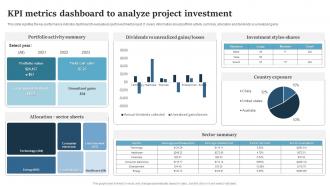 KPI Metrics Dashboard To Analyze Project Investment
This slide signifies the key performance indicator dashboard to evaluate project investment project. It covers information about portfolio activity summary, allocation and dividends vs unrealized gains. Introducing our KPI Metrics Dashboard To Analyze Project Investment set of slides. The topics discussed in these slides are Portfolio Activity Summary, Unrealized Gains, Investment Styles Shares. This is an immediately available PowerPoint presentation that can be conveniently customized. Download it and convince your audience.
-
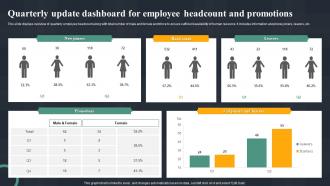 Quarterly Update Dashboard For Employee Headcount And Promotions
This slide displays overview of quarterly employee headcount along with total number of male and female workforce to ensure sufficient availability of human resource. It includes information about new joiners, leavers, etc. Introducing our Quarterly Update Dashboard For Employee Headcount And Promotions set of slides. The topics discussed in these slides are New Joiners, Head Count, Leavers, Promotions. This is an immediately available PowerPoint presentation that can be conveniently customized. Download it and convince your audience.
-
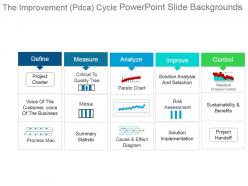 The improvement pdca cycle powerpoint slide backgrounds
Presenting the improvement pdca cycle PPT template. Fully creative and editable PPT slide visual. Modify and personalize the presentation by including the company name and logo. Guidance for executing the changes has been provided for assistance. Useful for sales executives, marketers, business professionals, analysts, strategists, students, teachers, etc. Easily and effortlessly modifiable by any user at any time without even having any specialized knowledge. Compatible with Microsoft office software and the Google slides. Available to be saved in jpg or pdf format.
-
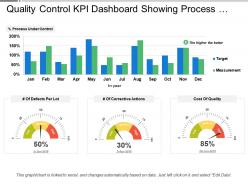 Quality control kpi dashboard showing process under control and cost of quality
Presenting this set of slides with name - Quality Control Kpi Dashboard Showing Process Under Control And Cost Of Quality. This is a four stage process. The stages in this process are Quality Management, Quality Control, Quality Assurance.
-
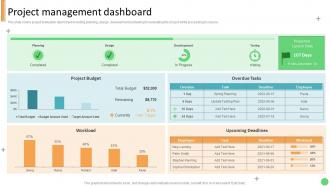 Project Management Dashboard Technology Development Project Planning
This slide covers project evaluation dashboard including planning, design , development and testing for evaluating the project while proceeding to closure.Deliver an outstanding presentation on the topic using this Project Management Dashboard Technology Development Project Planning. Dispense information and present a thorough explanation of Stephen Fleming, Entities Exited, Remaining using the slides given. This template can be altered and personalized to fit your needs. It is also available for immediate download. So grab it now.
-
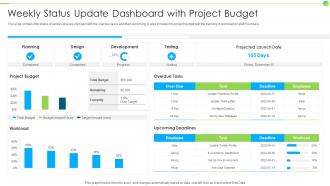 Weekly Status Update Dashboard With Project Budget
This slide contains the status of various phases of project with the overdue tasks and their upcoming. It also includes the project budget with the tracking of workload on staff members. Introducing our Weekly Status Update Dashboard With Project Budget set of slides. The topics discussed in these slides are Planning, Development, Projected Launch Date, Overdue Tasks. This is an immediately available PowerPoint presentation that can be conveniently customized. Download it and convince your audience.
-
 Project Tracker Dashboard With Multiple Metrics
The following slide highlights the KPI of project management to avoid deviations. It includes elements such as schedule, tasks, issue assessment, budget and risk analysis etc. Introducing our Project Tracker Dashboard With Multiple Metrics set of slides. The topics discussed in these slides areProjected Budget Analysis, Risk Analysis, Issue Assessment. This is an immediately available PowerPoint presentation that can be conveniently customized. Download it and convince your audience.
-
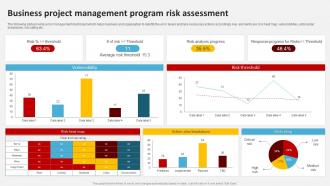 Business Project Management Program Risk Assessment
The following slide provide a risk management dashboard which helps business and organisation to identify the error levels and take necessary actions accordingly. Key elements are risk heat map, vulnerabilities, action plan breakdown, risk rating etc.Presenting our well structured Business Project Management Program Risk Assessment. The topics discussed in this slide are Response Progress, Average Risk Threshold, Management Program. This is an instantly available PowerPoint presentation that can be edited conveniently. Download it right away and captivate your audience.
-
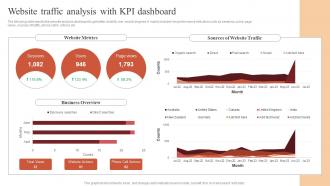 Website Traffic Analysis With Kpi Dashboard Paid Advertising Campaign Management
The following slide depicts the website analysis dashboard to get better visibility over search engines. It mainly includes key performance indicators such as sessions, users, page views, sources of traffic, phone call to actions etc. Present the topic in a bit more detail with this Website Traffic Analysis With Kpi Dashboard Paid Advertising Campaign Management. Use it as a tool for discussion and navigation on Business Overview, Website Metrics. This template is free to edit as deemed fit for your organization. Therefore download it now.
-
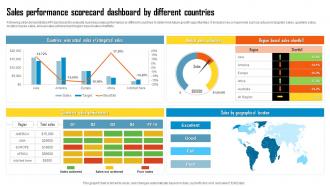 Sales Performance Scorecard Dashboard By Different Countries
Following slide demonstrates KPI dashboard to evaluate business sales performance by different countries to determine future growth opportunities. It includes key components such as actual v or s targeted sales, quarterly sales, location bases sales, annual sales achieved and region based sales shortfalls. Introducing our Sales Performance Scorecard Dashboard By Different Countries set of slides. The topics discussed in these slides are Countries, Actual Sales, Targeted Sales. This is an immediately available PowerPoint presentation that can be conveniently customized. Download it and convince your audience.
-
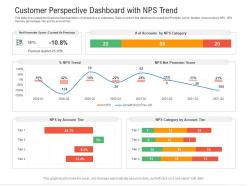 Customer perspective dashboard snapshot with nps trend powerpoint template
This slide Showcases the Graphical Representation of perspective of customers. Data covered in this dashboard includes Net Promoter score, Number of accounts by NPS, NPS trend by percentage, Tier and by account tier. This is a Customer Perspective Dashboard Snapshot With NPS Trend Powerpoint Template drafted with a diverse set of graphics, that can be reformulated and edited as per your needs and requirements. Just download it in your system and make use of it in PowerPoint or Google Slides, depending upon your presentation preferences.
-
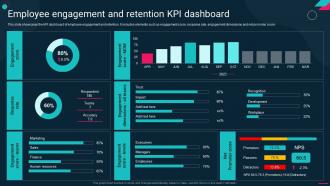 Employee Engagement And Retention KPI Dashboard Employee Engagement Action Plan
This slide showcases the KPI dashboard of employee engagement and retention. It includes elements such as engagement score, response rate, engagement dimensions and net promoter score.Present the topic in a bit more detail with this Employee Engagement And Retention KPI Dashboard Employee Engagement Action Plan. Use it as a tool for discussion and navigation on Response rate, Engagement score, Engagement score. This template is free to edit as deemed fit for your organization. Therefore download it now.
-
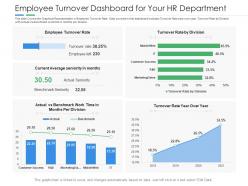 Employee turnover dashboard for your hr department powerpoint template
This slide Covers the Graphical Representation of Employee Turnover Rate. Data covered in this dashboard includes Turnover Rate year over year, Turnover Rate by Division with Actual Vs benchmark work time in months per division. This is a Employee Turnover Dashboard For Your HR Department Powerpoint Template drafted with a diverse set of graphics, that can be reformulated and edited as per your needs and requirements. Just download it in your system and make use of it in PowerPoint or Google Slides, depending upon your presentation preferences.
-
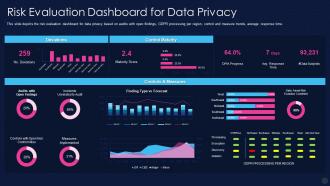 Data Privacy It Risk Evaluation Dashboard Snapshot For Data Privacy
This slide depicts the risk evaluation dashboard snapshot for data privacy based on audits with open findings, GDPR processing per region, control and measure trends, average response time. Present the topic in a bit more detail with this Data Privacy It Risk Evaluation Dashboard For Data Privacy. Use it as a tool for discussion and navigation on Risk Evaluation Dashboard For Data Privacy. This template is free to edit as deemed fit for your organization. Therefore download it now.
-
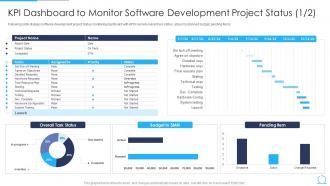 Kpi Dashboard To Monitor Software Development Project Status Agile Qa Model It
Following slide displays software development project status monitoring dashboard with KPIS namely overall task status, actual Vs planned budget, pending items. Present the topic in a bit more detail with this Kpi Dashboard To Monitor Software Development Project Status Agile Qa Model It Use it as a tool for discussion and navigation on Software, Development, Dashboard. This template is free to edit as deemed fit for your organization. Therefore download it now.
-
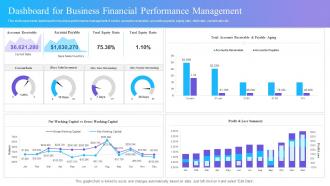 Dashboard For Business Financial Performance Management
This slide represents dashboard for business performance management. It covers accounts receivable, accounts payable, equity ratio, debt ratio, current ratio etc. Introducing our Dashboard For Business Financial Performance Management set of slides. The topics discussed in these slides are Dashboard, Business Financial, Performance Management. This is an immediately available PowerPoint presentation that can be conveniently customized. Download it and convince your audience.
-
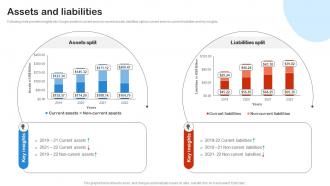 Assets And Liabilities Digital Advertising And Promotion Company Profile CP SS V
Following slide provides insights into Google assets in current and non current assets, liabilities split as current and non current liabilities and key insights. Present the topic in a bit more detail with this Assets And Liabilities Digital Advertising And Promotion Company Profile CP SS V. Use it as a tool for discussion and navigation on Liabilities, Assets, Current. This template is free to edit as deemed fit for your organization. Therefore download it now.
-
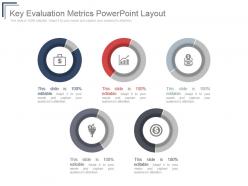 Key evaluation metrics powerpoint layout
Presenting key evaluation metrics powerpoint layout. This is a key evaluation metrics powerpoint layout. This is a five stage process. The stages in this process are icons, business, marketing, presentation, management.
-
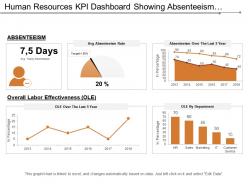 Human resources kpi dashboard showing absenteeism overall labor effectiveness
Presenting this set of slides with name - Human Resources Kpi Dashboard Showing Absenteeism Overall Labor Effectiveness. This is a five stage process. The stages in this process are Human Resource, Hrm, Human Capital.
-
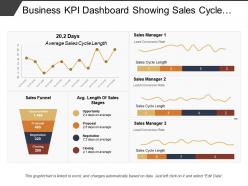 Business kpi dashboard showing sales cycle length and sales funnel
Presenting this set of slides with name - Business Kpi Dashboard Showing Sales Cycle Length And Sales Funnel. This is a three stage process. The stages in this process are Business Dashboard, Business Kpi, Business Performance.
-
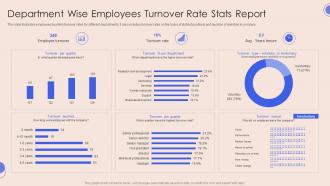 Department Wise Employees Turnover Rate Stats Report
This slide illustrates employees quarterly turnover rates for different departments. It also includes turnover rates on the basis of distinct positions and duration of retention in company. Presenting our well structured Department Wise Employees Turnover Rate Stats Report. The topics discussed in this slide are Turnover Per Quarter, Turnover Buckets, Turnover Reason. This is an instantly available PowerPoint presentation that can be edited conveniently. Download it right away and captivate your audience.
-
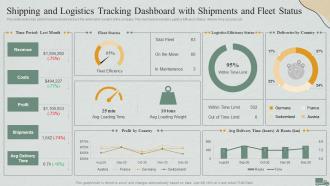 F611 Shipping And Logistics Tracking Dashboard With Shipments Logistics Management Steps Delivery Transportation
This slide covers Key performance indicators to track the automation system of the company. This dashboard includes Logistics Efficiency Status, delivery time accuracy etc. Present the topic in a bit more detail with this F611 Shipping And Logistics Tracking Dashboard With Shipments Logistics Management Steps Delivery Transportation. Use it as a tool for discussion and navigation on Dashboard, Shipments, Logistics Tracking. This template is free to edit as deemed fit for your organization. Therefore download it now.
-
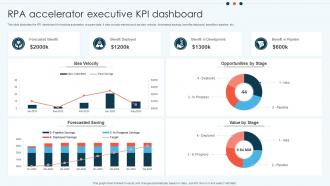 RPA Accelerator Executive KPI Dashboard Snapshot
This slide illustrates the KPI dashboard Snapshot for tracking automation program data. It also include metrics such as idea velocity, forecasted savings, benefits deployed, benefits in pipeline, etc. Introducing our RPA Accelerator Executive KPI Dashboard set of slides. The topics discussed in these slides are Forecasted Saving, Idea Velocity, Opportunities By Stage. This is an immediately available PowerPoint presentation that can be conveniently customized. Download it and convince your audience.
-
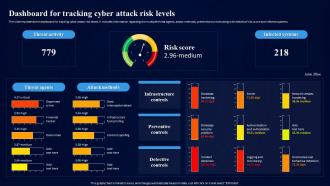 Cybersecurity Risk Assessment Program Dashboard For Tracking Cyber Attack Risk Levels
The slide represents the dashboard for tracking cyber attack risk levels. It includes information regarding the multiple threat agents, attack methods, preventive controls along with details of risk score and infected systems. Deliver an outstanding presentation on the topic using this Cybersecurity Risk Assessment Program Dashboard For Tracking Cyber Attack Risk Levels. Dispense information and present a thorough explanation of Infrastructure Controls, Preventive Controls, Detective Controls using the slides given. This template can be altered and personalized to fit your needs. It is also available for immediate download. So grab it now.


