Charts, Graphs PowerPoint Designs, Presentation Charts Designs & PPT Graphics
- Sub Categories
-
- Arrows and Targets
- Bullet and Text Slides
- Charts and Graphs
- Circular Cycle Diagrams
- Concepts and Shapes
- Custom Flat Designs
- Dashboards and Measuring
- Flow Process
- Funnels
- Gears
- Growth
- Harvey Balls
- Idea Innovation and Light Bulbs
- Leadership
- Linear Process Diagrams
- Magnifying Glass
- Misc Other Graphics
- Opportunity and Handshake
- Organization Charts
- Puzzles
- Pyramids
- Roadmaps and Timelines
- Silhouettes
- Steps
- Strategic Planning Analysis
- SWOT Analysis
- Tables and Matrix
- Teamwork
- Technology and Communication
- Venn Diagrams
- Visuals and Illustrations
-
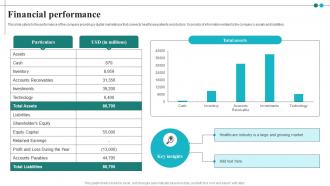 Financial Performance Remote Patient Care Marketplace Investor Funding Elevator Pitch Deck
This slide caters to the performance of the company providing a digital marketplace that connects healthcare patients and doctors. It consists of information related to the companys assets and liabilities. Present the topic in a bit more detail with this Financial Performance Remote Patient Care Marketplace Investor Funding Elevator Pitch Deck. Use it as a tool for discussion and navigation on Healthcare Industry, Key Insights, Growing Market. This template is free to edit as deemed fit for your organization. Therefore download it now.
-
 Real Estate Rental Feasibility Study
This slide showcases real estate rental feasibility study as per the number of bedrooms to show growth in market rental properties and rise in demand for housing from the year 2018 to 2023. Introducing our Real Estate Rental Feasibility Study set of slides. The topics discussed in these slides are Market Rent Per Unit, Rise In Interest Rate, Rental Properties. This is an immediately available PowerPoint presentation that can be conveniently customized. Download it and convince your audience.
-
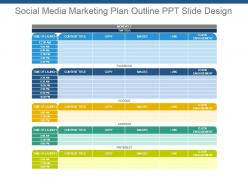 Social media marketing plan outline ppt slide design
Presenting social media marketing plan outline ppt slide design. This is a social media marketing plan outline ppt slide design. This is a five stage process. The stages in this process are twitter, facebook, google, linkedin, pinterest, time of launch, copy, images, link, click engagement.
-
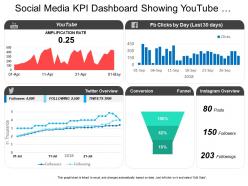 Social media kpi dashboard showing youtube amplification rate conversion
We introduces to you its new Social media KPI dashboard showing YouTube amplification rate conversion PowerPoint template. You can download the business template, edit the data in the excel sheet and the graph changes dynamically. You can add backgrounds to all of the slides. This presentation is available for free download in JPG and PDF format. All the slides in this presentation are fully compatible with Google slides. You can view this document in widescreen size and standard screen size.
-
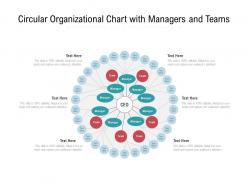 Circular organizational chart with managers and teams
Presenting this set of slides with name Circular Organizational Chart With Managers And Teams. This is a one stage process. The stages in this process are Circular Organizational Chart, Hierarchy Organizational Chart, Interconnected Organizational Chart. This is a completely editable PowerPoint presentation and is available for immediate download. Download now and impress your audience.
-
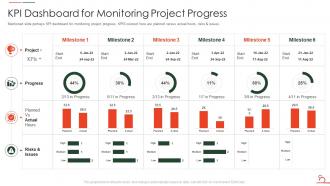 Agile Methodology For Data Migration Project It Kpi Dashboard For Monitoring Project Progress
Mentioned slide portrays KPI dashboard for monitoring project progress. KPIS covered here are planned versus actual hours, risks and issues. Present the topic in a bit more detail with this Agile Methodology For Data Migration Project It Kpi Dashboard For Monitoring Project Progress. Use it as a tool for discussion and navigation on KPI Dashboard For Monitoring Project Progress. This template is free to edit as deemed fit for your organization. Therefore download it now.
-
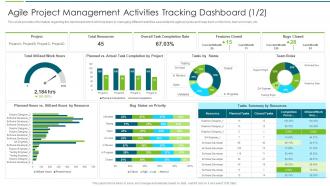 Agile Project Management Activities Tracking Agile Transformation Approach Playbook
This slide provides information regarding the dashboard which will help team in managing different activities associated to agile projects and keep track on the time, task summary, etc. Deliver an outstanding presentation on the topic using this Agile Project Management Activities Tracking Agile Transformation Approach Playbook. Dispense information and present a thorough explanation of Management, Dashboard, Associated using the slides given. This template can be altered and personalized to fit your needs. It is also available for immediate download. So grab it now.
-
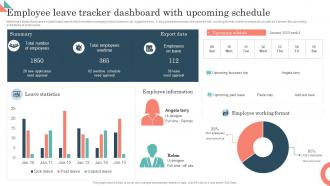 Employee Leave Tracker Dashboard With Upcoming Schedule
Mentioned slide showcases a dashboard report which enables manager to track leaves in an organized way. It also presents number of employee info.,working format, overtime requests as well as it shows the upcoming schedules of employees. Presenting our well structured Employee Leave Tracker Dashboard With Upcoming Schedule. The topics discussed in this slide are Summary, Employees, Export Data. This is an instantly available PowerPoint presentation that can be edited conveniently. Download it right away and captivate your audience.
-
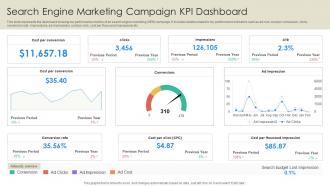 Search Engine Marketing Campaign Kpi Dashboard
This slide represents the dashboard showing key performance metrics of an search engine marketing SEM campaign. It includes details related to key performance indicators such as ad cost, cost per conversion, clicks, conversion rate, impressions, ad impressions, cost per click, cost per thousand impressions etc. Presenting our well structured Search Engine Marketing Campaign Kpi Dashboard. The topics discussed in this slide are Marketing, Campaign, Impressions. This is an instantly available PowerPoint presentation that can be edited conveniently. Download it right away and captivate your audience.
-
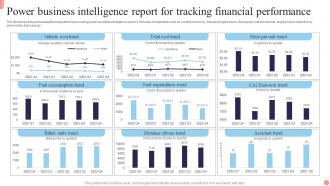 Power Business Intelligence Report For Tracking Financial Performance
The following slide showcases financial performance using power business intelligence report. It includes components such as monthly economy, reduced engine hours, decrease in carbon dioxide, engine hours reduction by automobile, fuel savings. Presenting our well structured Power Business Intelligence Report For Tracking Financial Performance. The topics discussed in this slide are Consumption Trend, Expenditure Trend, Emission Trend. This is an instantly available PowerPoint presentation that can be edited conveniently. Download it right away and captivate your audience.
-
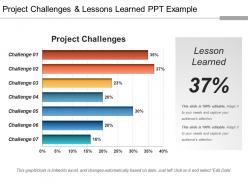 Project challenges and lessons learned ppt example
This intelligently designed project challenges and lessons learned PPT template can easily be updated by anyone. Our professional PPT experts have also provided important instructions to modify and personalize the design. PPT design is instantly downloadable into JPEG and PDF formats. Design template is fully compatible with Google Slides and MS PowerPoint software. High resolution icons and graphics have been used in the PPT design.
-
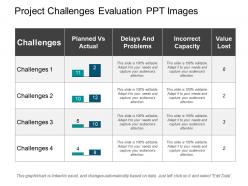 Project challenges evaluation ppt images
We bring to you our project challenge evaluation PPT images. This PowerPoint presentation is 100% editable, which allows you to add or delete any given feature of the slideshow. You can change the font color, font size and font style of the text used. The PPT presentation can be saved in the format of PDF or JPG. After you download the business template it can be viewed in standard size display ratio of 4:3 or widescreen display ratio of 16:9. The slideshow is very easy to deal with as it is also compatible with Google Slides.
-
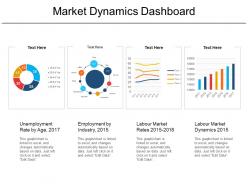 Market dynamics dashboard
Introducing the Market Dynamics Dashboard PowerPoint slide which is easily editable and can be downloaded in various formats like PNG, JPG and PDF. Compatible with Google Slides, it is easily accessible at one click. PPT template is available in both 4:3 and 16:9 aspect ratios. As per your requirements, modify font type, size and color. Used by business and market analysts.
-
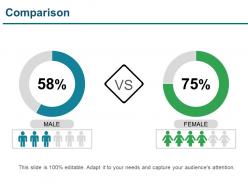 Comparison presentation powerpoint templates
Presenting our Comparison Presentation PowerPoint Templates. This PPT theme is available in both 4:3 and 16:9 aspect ratios. Choose this PPT graphic to display apt and suitable comparative graphs, charts, and images. This PPT layout is 100% adaptable allowing you to modify the font, color, font size, and shapes. This PPT presentation is also Google Slides compatible making it easily accessible. Without further ado, click the download button!
-
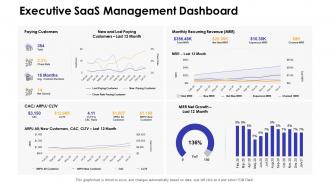 Dashboards by function executive saas management dashboard
Deliver an outstanding presentation on the topic using this Dashboards By Function Executive Saas Management Dashboard. Dispense information and present a thorough explanation of Management, Dashboard, Executive using the slides given. This template can be altered and personalized to fit your needs. It is also available for immediate download. So grab it now.
-
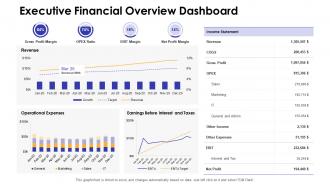 Executive financial overview dashboard snapshot by function
Present the topic in a bit more detail with this Executive Financial Overview Dashboard Snapshot By Function. Use it as a tool for discussion and navigation on Executive Financial Overview Dashboard. This template is free to edit as deemed fit for your organization. Therefore download it now.
-
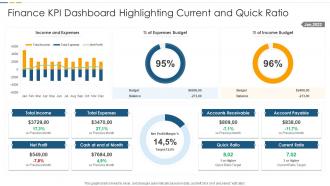 Finance KPI Dashboard Highlighting Current And Quick Ratio
Introducing our Finance KPI Dashboard Highlighting Current And Quick Ratio set of slides. The topics discussed in these slides are Income And Expenses, Expenses Budget, Income Budget. This is an immediately available PowerPoint presentation that can be conveniently customized. Download it and convince your audience.
-
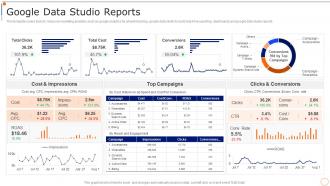 Content Marketing Playbook Google Data Studio Reports
This template covers tools to measure marketing analytics such as google analytics for all web tracking, google data studio to build real time reporting dashboards and google data studio reports. Present the topic in a bit more detail with this Content Marketing Playbook Google Data Studio Reports. Use it as a tool for discussion and navigation on Google Data Studio Reports. This template is free to edit as deemed fit for your organization. Therefore download it now.
-
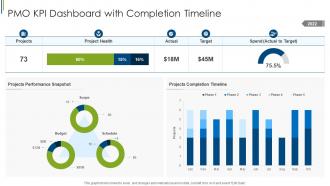 PMO KPI Dashboard With Completion Timeline
Presenting our well structured PMO KPI Dashboard With Completion Timeline. The topics discussed in this slide are PMO KPI Dashboard With Completion Timeline. This is an instantly available PowerPoint presentation that can be edited conveniently. Download it right away and captivate your audience.
-
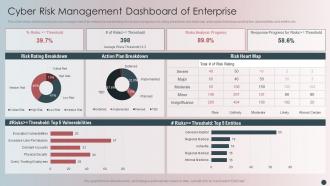 Cyber Risk Management Dashboard Of Enterprise
This slide shows dashboard of cyber risk management of an enterprise representing risk analysis progress, risk rating breakdown and heat map, action plan breakdown and top five vulnerabilities and entities etc. Introducing our Cyber Risk Management Dashboard Of Enterprise set of slides. The topics discussed in these slides are Cyber Risk Management, Dashboard Enterprise. This is an immediately available PowerPoint presentation that can be conveniently customized. Download it and convince your audience.
-
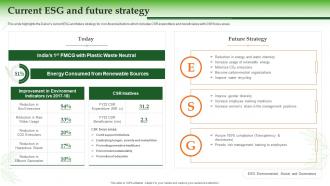 Dabur Company Profile Current Esg And Future Strategy Ppt Slides Information
This slide highlights the Daburs current ESG and future strategy for non-financial factors which includes CSR expenditure and beneficiaries with CSR focus areas. Present the topic in a bit more detail with this Dabur Company Profile Current Esg And Future Strategy Ppt Slides Information. Use it as a tool for discussion and navigation on Strategy, Management Positions, Governance. This template is free to edit as deemed fit for your organization. Therefore download it now.
-
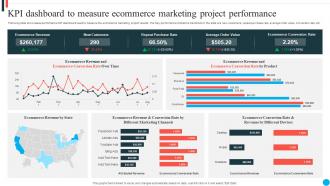 KPI Dashboard To Measure Ecommerce Marketing Project Performance
Following slide showcases performance KPI dashboard used to measure the ecommerce marketing project results. The Key performance indicators mentioned in the slide are new customers, repeat purchase rate, average order value, conversion rate, etc. Presenting our well-structured KPI Dashboard To Measure Ecommerce Marketing Project Performance. The topics discussed in this slide are KPI Dashboard, Measure, Ecommerce Marketing, Project Performance. This is an instantly available PowerPoint presentation that can be edited conveniently. Download it right away and captivate your audience.
-
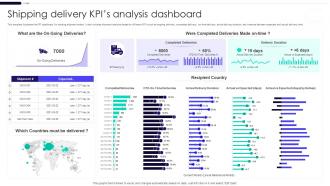 Shipping Delivery KPIs Analysis Dashboard
This template illustrates the KPI dashboard for tracking shipment orders. It also includes shipment analysis based on different KPIs such as ongoing delivery, completed delivery, on time delivery, actual delivery duration, and variance between expected and actual delivery time. Presenting our well-structured Shipping Delivery KPIs Analysis Dashboard. The topics discussed in this slide are Shipping Delivery, KPIS Analysis, Dashboard. This is an instantly available PowerPoint presentation that can be edited conveniently. Download it right away and captivate your audience.
-
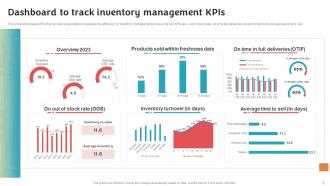 Dashboard To Track Inventory Management Stock Inventory Procurement And Warehouse
This slide showcases KPIs that can help organization to evaluate the efficiency of inventory management process. Its key KPIs are out of stock rate, on time full deliveries, inventory turnover and average time to sell. Present the topic in a bit more detail with this Dashboard To Track Inventory Management Stock Inventory Procurement And Warehouse. Use it as a tool for discussion and navigation on Products Sold, Inventory Turnover, Average Time To Sell. This template is free to edit as deemed fit for your organization. Therefore download it now.
-
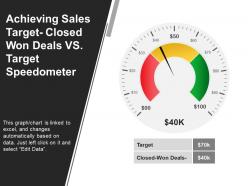 Achieving sales target closed won deals vs target speedometer ppt design
This sales target achievement presentation PPT template can be downloaded and converted into JPEG and PDF formats. You can change font type, size, color, shape, style, background according to your business preferences. Design allows full editing. PPT is fully compatible with Google Slides and MS PowerPoint software. Both normal and full screen design views are available. No change in the design quality even when viewed in full screen.
-
 New business journey ppt slide
Presenting New Business Journey PPT Slide. Individualize this PPT layout as per your requirements. You are free to change anything in this PPT slide. The colors, the font type, font size, and the background, everything is under your control. We offer you a high-resolution graphics template that is entirely compatible with Google Slides. Convert and save this slide in various formats, including JPG and PDF formats. Download this slide design in 2 screen sizes i.e., standard screen and widescreen.
-
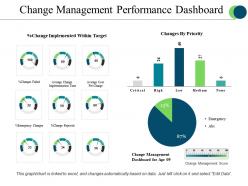 Change management performance dashboard powerpoint slide designs
Presenting change management performance dashboard powerpoint slide designs. This is a change management performance dashboard powerpoint slide designs. This is a three stage process. The stages in this process are critical, high, low, medium, none.
-
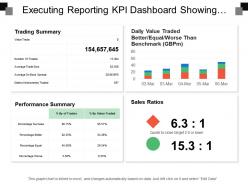 Executing reporting kpi dashboard showing trading summary performance summary and sales ratio
Presenting this set of slides with name - Executing Reporting Kpi Dashboard Showing Trading Summary Performance Summary And Sales Ratio. This is a four stage process. The stages in this process are Executive Reporting, Executive Analysis, Executive Performance.
-
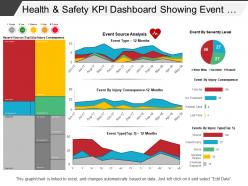 Health and safety kpi dashboard showing event source analysis
Presenting the colorful dashboard presentation layout. This modern dashboard design is fully editable and is created under the strict supervision of professionals. You can bring changes to the objects in the slide like font size and font color hassle-free. This presentation slide is fully compatible with Google Slide and can be saved in JPG or PDF file format without any hassle. Fast download this at the click of the button.
-
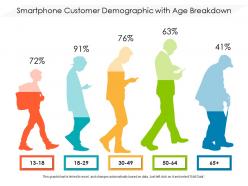 Smartphone customer demographic with age breakdown
Presenting this set of slides with name Smartphone Customer Demographic With Age Breakdown. The topics discussed in these slide is Smartphone Customer Demographic With Age Breakdown. This is a completely editable PowerPoint presentation and is available for immediate download. Download now and impress your audience.
-
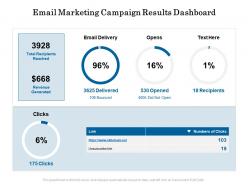 Email marketing campaign results dashboard
Presenting this set of slides with name Email Marketing Campaign Results Dashboard. The topics discussed in these slides are Delivered, Opened, Recipients. This is a completely editable PowerPoint presentation and is available for immediate download. Download now and impress your audience.
-
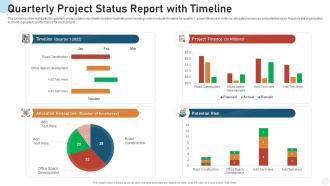 Quarterly project status report with timeline
Introducing our Quarterly Project Status Report With Timeline set of slides. The topics discussed in these slides are Timeline, Project Finance, Potential Risk. This is an immediately available PowerPoint presentation that can be conveniently customized. Download it and convince your audience.
-
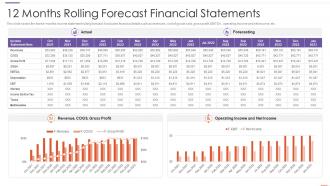 12 Months Rolling Forecast Financial Statements
This slide covers the twelve months income statement rolling forecast. It includes financial details such as revenues, cost of goods sold, gross profit, EBITDA, operating income and net income, etc. Presenting our well structured 12 Months Rolling Forecast Financial Statements. The topics discussed in this slide are Revenue, Operating Income And Net Income, Gross Profit. This is an instantly available PowerPoint presentation that can be edited conveniently. Download it right away and captivate your audience.
-
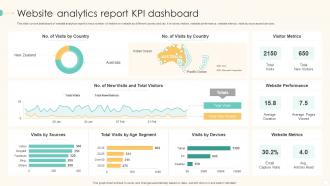 Website Analytics Report KPI Dashboard Snapshot
Introducing our Website Analytics Report KPI Dashboard Snapshot set of slides. The topics discussed in these slides are Website Analytics Report, KPI Dashboard Snapshot. This is an immediately available PowerPoint presentation that can be conveniently customized. Download it and convince your audience.
-
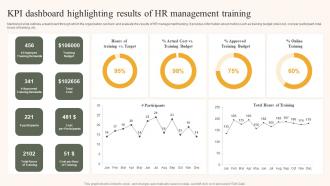 KPI Dashboard Highlighting Results Of HR Management Training
Mentioned slide outlines a dashboard through which the organization can track and evaluate the results of HR management training. It provides information about metrics such as training budget, total cost, cost per participant, total hours of training, etc. Presenting our well structured KPI Dashboard Highlighting Results Of HR Management Training. The topics discussed in this slide are Training Budget, Total Cost, Cost Per Participants. This is an instantly available PowerPoint presentation that can be edited conveniently. Download it right away and captivate your audience.
-
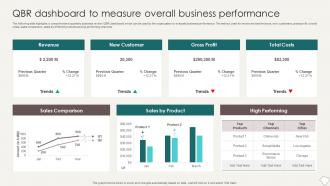 QBR Dashboard To Measure Overall Business Performance
The following slide highlights a comprehensive quarterly business review QBR dashboard which can be used by the organization to evaluate business performance. The metrics used for review are total revenue, new customers, gross profit, overall costs, sales comparison, sales by different products and top performing channels. Introducing our QBR Dashboard To Measure Overall Business Performance set of slides. The topics discussed in these slides are Revenue, New Customer, Gross Profit, Total Costs. This is an immediately available PowerPoint presentation that can be conveniently customized. Download it and convince your audience.
-
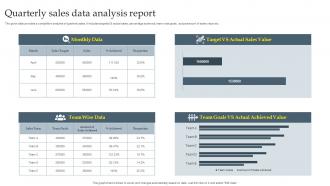 Quarterly Sales Data Analysis Report
The given slide provides a competitive analysis of quarterly sales. It includes targeted and actual sales, percentage achieved, team wise goals, actual amount of sales value etc. Presenting our well-structured Quarterly Sales Data Analysis Report. The topics discussed in this slide are Quarterly Sales, Data Analysis Report. This is an instantly available PowerPoint presentation that can be edited conveniently. Download it right away and captivate your audience.
-
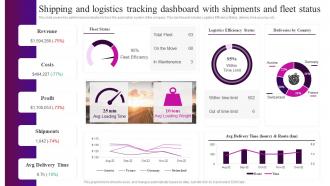 Automation In Logistics Industry Shipping And Logistics Tracking Dashboard
This slide covers Key performance indicators to track the automation system of the company. This dashboard includes Logistics Efficiency Status, delivery time accuracy etc. Present the topic in a bit more detail with this Automation In Logistics Industry Shipping And Logistics Tracking Dashboard. Use it as a tool for discussion and navigation on Profit, Costs, Revenue. This template is free to edit as deemed fit for your organization. Therefore download it now.
-
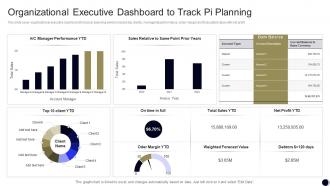 Organizational Executive Dashboard To Track PI Planning
This slide cover organizational executive dashboard to track pi planning which includes top clients, managerial performance, order margin and forecasted value with net profit Presenting our well-structured Organizational Executive Dashboard To Track PI Planning. The topics discussed in this slide are Organizational, Executive Dashboard, Track PI Planning. This is an instantly available PowerPoint presentation that can be edited conveniently. Download it right away and captivate your audience.
-
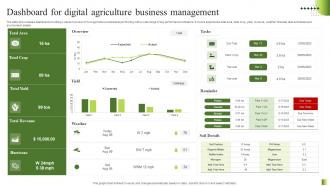 Dashboard For Digital Agriculture Business Management
Presenting our well structured Dashboard For Digital Agriculture Business Management. The topics discussed in this slide are Overview, Tasks, Soil Details. This is an instantly available PowerPoint presentation that can be edited conveniently. Download it right away and captivate your audience. The slide showcases a dashboard providing a visual overview of how agriculture business is performing with a wide range of key performance indicators. It covers aspects like total area, total crop, yield, revenue, weather forecast, task schedules and environment details.
-
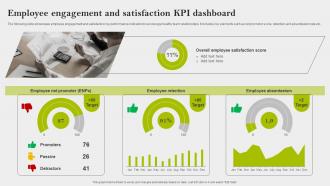 Employee Engagement And Satisfaction KPI Dashboard Implementing Employee Engagement Strategies
The following slide showcases employee engagement and satisfaction key performance indicators to encourage healthy team relationships. It includes key elements such as net promotor score, retention and absenteeism rate etc. Deliver an outstanding presentation on the topic using this Employee Engagement And Satisfaction KPI Dashboard Implementing Employee Engagement Strategies Dispense information and present a thorough explanation of Employee Net Promoter, Employee Retention, Employee Absenteeism using the slides given. This template can be altered and personalized to fit your needs. It is also available for immediate download. So grab it now.
-
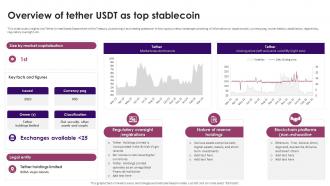 Guide On Defining Roles Of Stablecoins Overview Of Tether Usdt As Top Stablecoin BCT SS
This slide covers insights into Tether United States Department of the Treasury, positioning it as a leading stablecoin in the cryptocurrency landscape consisting of information on issuance year, currency peg, owner details, classification, legal entity, regulatory oversight, etc. Present the topic in a bit more detail with this Guide On Defining Roles Of Stablecoins Overview Of Tether Usdt As Top Stablecoin BCT SS. Use it as a tool for discussion and navigation on Nature Of Reserve Holdings, Blockchain Platforms, Regulatory Oversight Or Registrations. This template is free to edit as deemed fit for your organization. Therefore download it now.
-
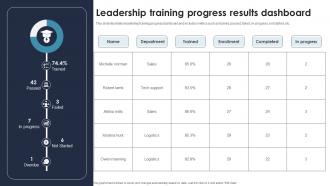 Leadership Training Progress Results Dashboard
This slide illustrates leadership training progress dashboard and includes metrics such as trained, passed, failed, in- progress, not started, etc. Introducing our Leadership Training Progress Results Dashboard set of slides. The topics discussed in these slides are Department, Enrollment, In Progress.This is an immediately available PowerPoint presentation that can be conveniently customized. Download it and convince your audience.
-
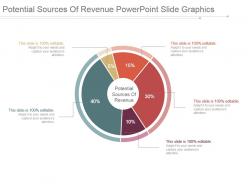 Potential sources of revenue powerpoint slide graphics
Presenting potential sources of revenue powerpoint slide graphics. This is a potential sources of revenue powerpoint slide graphics. This is a five stage process. The stages in this process are potential sources of revenue.
-
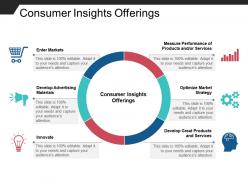 Consumer insights offerings
Presenting this Consumer Insights Offerings PowerPoint presentation. The slide is 100% adaptable in PowerPoint and compatible with Google Slides. Modify the font style, font color, and other components with ease. Convert this template into common document or image formats such as PDF or JPEG. High-quality graphics always ensure that quality is not affected.
-
 Comparison ppt icon examples
Presenting this set of slides with name - Comparison Ppt Icon Examples. This is a two stage process. The stages in this process are Business, Marketing, Male, Female, Comparison, Percentage.
-
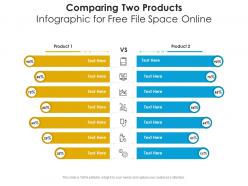 Comparing two products for free file space online infographic template
Deploy our Comparing Two Products For Free File Space Online Infographic Template to present high quality presentations. It is designed in PowerPoint and is available for immediate download in standard and widescreen sizes. Not only this, but this layout is also 100 percent editable, giving you full control over its applications.
-
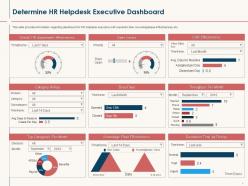 Hr service delivery determine hr helpdesk executive dashboard snapshot ppt powerpoint presentation styles
This slide provides information regarding dashboard for HR helpdesk executive with resolution time, knowledgebase effectiveness, etc. Deliver an outstanding presentation on the topic using this HR Service Delivery Determine HR Helpdesk Executive Dashboard Snapshot Ppt Powerpoint Presentation Styles. Dispense information and present a thorough explanation of Effectiveness, Priority using the slides given. This template can be altered and personalized to fit your needs. It is also available for immediate download. So grab it now.
-
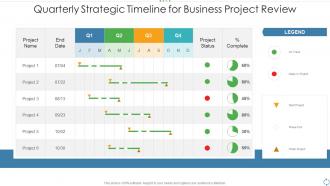 Quarterly strategic timeline for business project review
Introducing our Quarterly Strategic Timeline For Business Project Review set of slides. The topics discussed in these slides are Quarterly Strategic Timeline For Business Project Review. This is an immediately available PowerPoint presentation that can be conveniently customized. Download it and convince your audience.
-
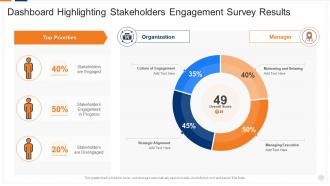 Dashboard Highlighting Stakeholders Engagement Survey Results
Introducing our Dashboard Highlighting Stakeholders Engagement Survey Results set of slides. The topics discussed in these slides are Dashboard Highlighting Stakeholders Engagement Survey Results. This is an immediately available PowerPoint presentation that can be conveniently customized. Download it and convince your audience.
-
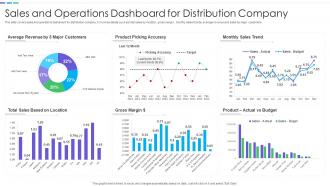 Sales And Operations Dashboard Snapshot For Distribution Company
This slide covers sales and operations dashboard for distribution company. It involves details such as total sales by location, gross margin, monthly sales trends, average revenue and sales by major customers. Presenting our well structured Sales And Operations Dashboard Snapshot For Distribution Company. The topics discussed in this slide are Monthly Sales Trend, Actual Vs Budget, Gross Margin. This is an instantly available PowerPoint presentation that can be edited conveniently. Download it right away and captivate your audience.
-
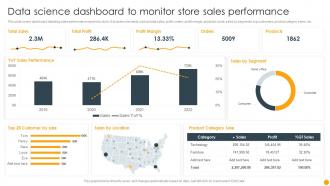 Data Science Dashboard Snapshot To Monitor Store Sales Performance
This slide covers dashboard depicting sales performance report of a store. It includes elements such as total sales, profit, orders, profit margin, products count, sales by segments, top customers, product category sales, etc. Introducing our Data Science Dashboard Snapshot To Monitor Store Sales Performance set of slides. The topics discussed in these slides are Data Science Dashboard, Monitor Store, Sales Performance. This is an immediately available PowerPoint presentation that can be conveniently customized. Download it and convince your audience.
-
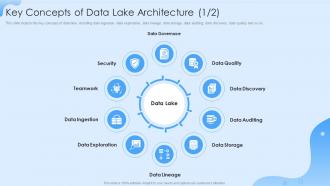 Data Lake Formation Key Concepts Of Data Lake Architecture
This slide depicts the key concepts of data lake, including data ingestion, data exploration, data lineage, data storage, data auditing, data discovery, data quality and so on. Introducing Data Lake Formation Key Concepts Of Data Lake Architecture to increase your presentation threshold. Encompassed with ten stages, this template is a great option to educate and entice your audience. Dispence information on Data Governace, Data Quality, Data Discovery, Data Auditing, using this template. Grab it now to reap its full benefits.
-
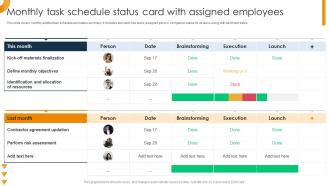 Monthly Task Schedule Status Card With Assigned Employees
This slide covers monthly allotted task schedule and status summary. It includes elements like tasks, assigned person, completion status for all tasks along with allotment dates. Presenting our well structured Monthly Task Schedule Status Card With Assigned Employees. The topics discussed in this slide are Monthly Task Schedule, Assigned Employees. This is an instantly available PowerPoint presentation that can be edited conveniently. Download it right away and captivate your audience.
-
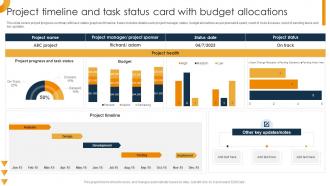 Project Timeline And Task Status Card With Budget Allocations
This slide covers project progress summary with task status graph and timeline. It also includes details such project manager, status, budget allocations as per planned and spent, count of risks and issues, count of pending tasks and key updates. Introducing our Project Timeline And Task Status Card With Budget Allocations set of slides. The topics discussed in these slides are Project Manager, Project Sponsor, Project Status. This is an immediately available PowerPoint presentation that can be conveniently customized. Download it and convince your audience.
-
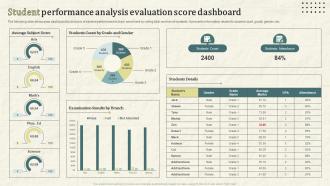 Student Performance Analysis Evaluation Score Dashboard
The following slide showcases dashboard for analysis of student performance to track enrolment by noting total number of students. It presents information related to student count, grade, gender, etc. Introducing our Student Performance Analysis Evaluation Score Dashboard set of slides. The topics discussed in these slides are Performance Analysis, Evaluation Score, Examination Results. This is an immediately available PowerPoint presentation that can be conveniently customized. Download it and convince your audience.
-
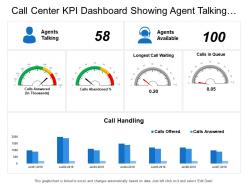 Call center kpi dashboard showing agent talking longest call waiting call handling
Presenting this set of slides with name - Call Center Kpi Dashboard Showing Agent Talking Longest Call Waiting Call Handling. This is a five stage process. The stages in this process are Call Center Agent, Customer Care, Client Support.
-
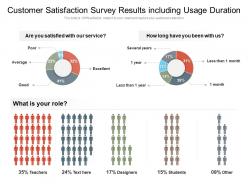 Customer satisfaction survey results including usage duration
Presenting this set of slides with name Customer Satisfaction Survey Results Including Usage Duration. The topics discussed in these slides are Excellent, Good, Satisfactory, Fair, Poor. This is a completely editable PowerPoint presentation and is available for immediate download. Download now and impress your audience.
-
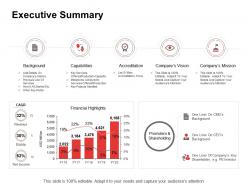 Promotion executive summary ppt powerpoint presentation inspiration clipart
Present the topic in a bit more detail with this Promotion Executive Summary Ppt Powerpoint Presentation Inspiration Clipart. Use it as a tool for discussion and navigation on Background, Capabilities, Accreditation, Companys Vision, Mission. This template is free to edit as deemed fit for your organization. Therefore download it now.
-
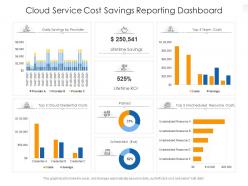 Cloud service cost savings reporting dashboard snapshot
Presenting our well-structured Cloud Service Cost Savings Reporting Dashboard Snapshot. The topics discussed in this slide are Daily Savings By Provider, Top 5 Team Costs, Lifetime ROI, Lifetime Savings, Top 5 Unscheduled Resource Costs, Top 3 Cloud Credential Costs. This is an instantly available PowerPoint presentation that can be edited conveniently. Download it right away and captivate your audience.


