Charts, Graphs PowerPoint Designs, Presentation Charts Designs & PPT Graphics
- Sub Categories
-
- Arrows and Targets
- Bullet and Text Slides
- Charts and Graphs
- Circular Cycle Diagrams
- Concepts and Shapes
- Custom Flat Designs
- Dashboards and Measuring
- Flow Process
- Funnels
- Gears
- Growth
- Harvey Balls
- Idea Innovation and Light Bulbs
- Leadership
- Linear Process Diagrams
- Magnifying Glass
- Misc Other Graphics
- Opportunity and Handshake
- Organization Charts
- Puzzles
- Pyramids
- Roadmaps and Timelines
- Silhouettes
- Steps
- Strategic Planning Analysis
- SWOT Analysis
- Tables and Matrix
- Teamwork
- Technology and Communication
- Venn Diagrams
- Visuals and Illustrations
-
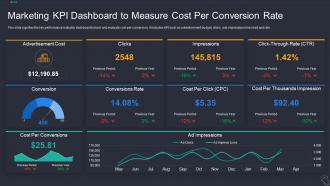 Marketing KPI Dashboard To Measure Cost Per Conversion Rate
This slide signifies the key performance indicator dashboard to track and evaluate cost per conversion. It includes KPI such as advertisement budget, clicks, ads impressions line chart and rate. Presenting our well structured Marketing KPI Dashboard To Measure Cost Per Conversion Rate. The topics discussed in this slide are Advertisement Cost, Conversion Impressions, Cost Per Thousands Impression, Dashboard To Measure Cost, Coat Per Click. This is an instantly available PowerPoint presentation that can be edited conveniently. Download it right away and captivate your audience.
-
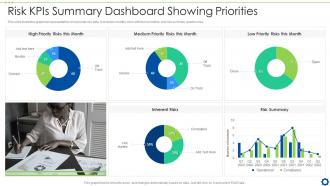 Risk KPIs Summary Dashboard Snapshot Showing Priorities
This slide illustrates graphical representation of corporate risk data. It includes monthly risks with their priorities, and risk summary quarter wise. Introducing our Risk KPIs Summary Dashboard Snapshot Showing Priorities set of slides. The topics discussed in these slides are High Priority Risks this Month, Medium Priority Risks this Month, Low Priority Risks this Month . This is an immediately available PowerPoint presentation that can be conveniently customized. Download it and convince your audience.
-
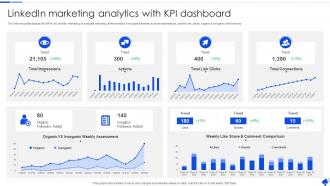 Linkedin Marketing Analytics With KPI Dashboard
The following slide depicts the KPAs of LinkedIn marketing to evaluate marketing effectiveness. It includes elements such as impressions, actions, link clicks, organic and inorganic followers etc. Introducing our Linkedin Marketing Analytics With KPI Dashboard set of slides. The topics discussed in these slides are Comment Comparison, Weekly Like Share, Inorganic Weekly Assessment. This is an immediately available PowerPoint presentation that can be conveniently customized. Download it and convince your audience.
-
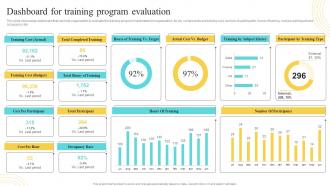 Dashboard For Training Program Evaluation Developing And Implementing
This slide showcases dashboard that can help organization to evaluate the training program implemented in organization. Its key components are training cost, number of participants, hours of training, cost per participant and occupancy rate. Deliver an outstanding presentation on the topic using this Dashboard For Training Program Evaluation Developing And Implementing. Dispense information and present a thorough explanation of Training, Dashboard, Training Program Evaluation using the slides given. This template can be altered and personalized to fit your needs. It is also available for immediate download. So grab it now.
-
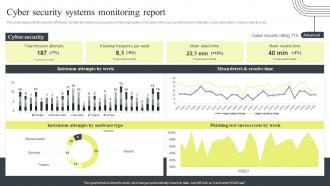 Cyber Security Attacks Response Plan Cyber Security Systems Monitoring Report
This slide represents the report to effectively monitor the networks and systems of the organization. It includes KPIs such as total intrusion attempts, mean detect team, mean resolve time etc. Present the topic in a bit more detail with this Cyber Security Attacks Response Plan Cyber Security Systems Monitoring Report. Use it as a tool for discussion and navigation on Cyber Security Systems, Monitoring Report, Mean Detect And Resolve Time. This template is free to edit as deemed fit for your organization. Therefore download it now.
-
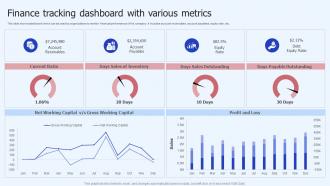 Finance Tracking Dashboard With Various Metrics
This slide shows dashboard which can be used by organizations to monitor financial performance of the company. It includes account receivables, account payables, equity ratio, etc. Introducing our Finance Tracking Dashboard With Various Metrics set of slides. The topics discussed in these slides are Days Sales Of Inventory, Gross Working Capital. This is an immediately available PowerPoint presentation that can be conveniently customized. Download it and convince your audience.
-
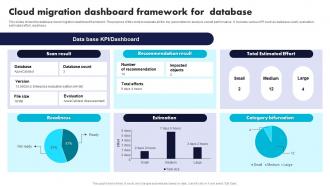 Cloud Migration Dashboard Framework For Database
This slides shows the database cloud migration dashboard framework. The purpose of this slide to evaluate all the key parameters to analysis overall performance . It includes various KPI such as database count, evaluation, estimated effort, readiness. Deliver an outstanding presentation on the topic using this Cloud Migration Dashboard Framework For Database. Dispense information and present a thorough explanation of Scan Result, Recommendation Result, Total Estimated Effort using the slides given. This template can be altered and personalized to fit your needs. It is also available for immediate download. So grab it now.
-
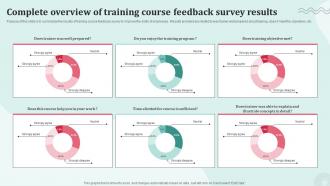 Complete Overview Of Training Course Feedback Survey Results Survey SS
Purpose of this slide is to summarize the results of training course feedback survey to improve the skills of employees . Results provided are related to was trainer well prepared about training, does it meet the objectives, etc. Introducing our Complete Overview Of Training Course Feedback Survey Results Survey SS set of slides. The topics discussed in these slides are Complete, Course, Feedback. This is an immediately available PowerPoint presentation that can be conveniently customized. Download it and convince your audience.
-
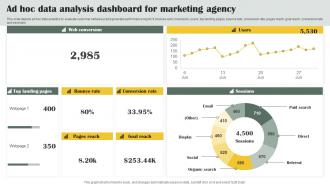 Ad Hoc Data Analysis Dashboard For Marketing Agency
This slide depicts ad hoc data analytics to evaluate customer behaviour and generate performance report. It involves web conversion, users, top landing pages, bounce rate, conversion rate, pages reach, goal reach, conversion rate and sessions. Introducing our Ad Hoc Data Analysis Dashboard For Marketing Agency set of slides. The topics discussed in these slides are Analysis, Marketing, Agency. This is an immediately available PowerPoint presentation that can be conveniently customized. Download it and convince your audience.
-
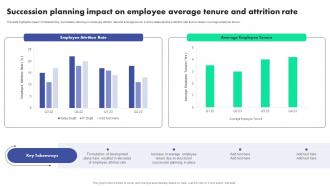 Succession Employee Average Tenure And Attrition Succession Planning To Identify Talent And Critical Job Roles
This slide highlights impact of implementing succession planning on employee attrition rate and average tenure. It showcases decline in attrition rate and increase in average employee tenure. Deliver an outstanding presentation on the topic using this Succession Employee Average Tenure And Attrition Succession Planning To Identify Talent And Critical Job Roles. Dispense information and present a thorough explanation of Succession, Planning, Development using the slides given. This template can be altered and personalized to fit your needs. It is also available for immediate download. So grab it now.
-
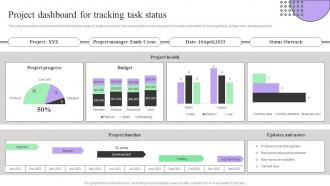 Project Dashboard For Tracking Task Status Creating Effective Project Schedule Management System
This slide presents project dashboard for tracking task status or phases of project, that would help to monitor progress. It includes information on ongoing phase, budget, risks, pending tasks etc Deliver an outstanding presentation on the topic using this Project Dashboard For Tracking Task Status Creating Effective Project Schedule Management System. Dispense information and present a thorough explanation of Resources, Dashboard, Information using the slides given. This template can be altered and personalized to fit your needs. It is also available for immediate download. So grab it now.
-
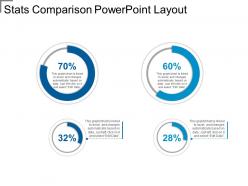 Stats comparison powerpoint layout
Presenting, our, stats comparison PowerPoint layout. Download this design within a few seconds and add your company logo. Alter the text to suit the context and justify your data. Use this stats comparison layout in your business meetings and use in both standard 4:3 and widescreen format 16:9 after downloading. No difference in the quality of PPT models after editing. Transform into jpeg/pdf as per term. This design is entirely compatible with Google Slides and various online and offline software. Pitch this PPT deck on widescreens to for an impactful activity. Personalize the color schemes, text and font as needed.
-
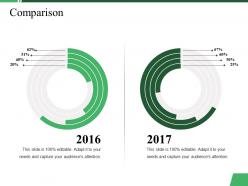 Comparison ppt summary rules
Presenting this set of slides with name - Comparison Ppt Summary Rules. This is a two stage process. The stages in this process are Comparison, Years, Business, Marketing, Strategy.
-
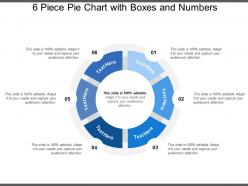 6 piece pie chart with boxes and numbers
Presenting this set of slides with name - 6 Piece Pie Chart With Boxes And Numbers. This is a six stage process. The stages in this process are 6 Piece Pie Chart, 6 Parts Pie Chart, 6 Segment Pie Chart.
-
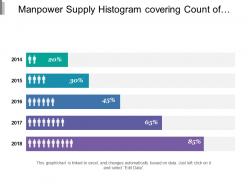 Manpower supply histogram covering count of hiring of year over year in percent
Presenting this set of slides with name - Manpower Supply Histogram Covering Count Of Hiring Of Year Over Year In Percent. This is a five stage process. The stages in this process are Manpower Supply, Manpower Service, Manpower Recruitment.
-
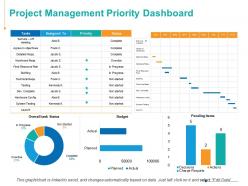 Project management priority dashboard marketing ppt powerpoint presentation inspiration outline
Presenting this set of slides with name - Project Management Priority Dashboard Marketing Ppt Powerpoint Presentation Inspiration Outline. This is a five stage process. The stages in this process are Staffing, Priority, Budget, Planned, Actual.
-
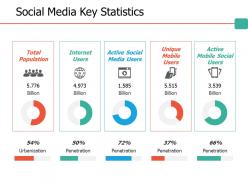 Social media key statistics ppt professional files
Presenting this set of slides with name - Social Media Key Statistics Ppt Professional Files. This is a five stage process. The stages in this process are Business, Management, Strategy, Analysis, Icons.
-
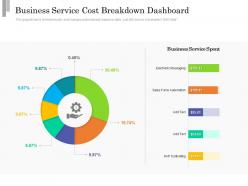 Business service cost breakdown dashboard
Presenting this set of slides with name Business Service Cost Breakdown Dashboard. The topics discussed in these slides are Business, Service, Sales. This is a completely editable PowerPoint presentation and is available for immediate download. Download now and impress your audience.
-
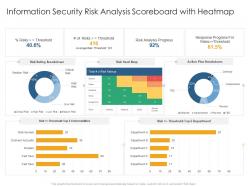 Information security risk analysis scoreboard with heatmap information security risk scorecard
Present the topic in a bit more detail with this Information Security Risk Analysis Scoreboard With Heatmap Information Security Risk Scorecard. Use it as a tool for discussion and navigation on Risk Rating Breakdown, Risk Heat Map, Action Plan Breakdown. This template is free to edit as deemed fit for your organization. Therefore download it now.
-
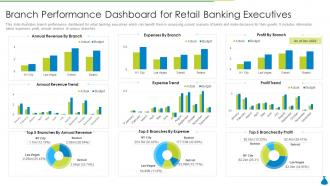 Branch performance dashboard for retail banking executives
Introducing our Branch Performance Dashboard For Retail Banking Executives set of slides. The topics discussed in these slides are Expenses, Revenue, Information. This is an immediately available PowerPoint presentation that can be conveniently customized. Download it and convince your audience.
-
 Learning and development dashboard employee professional growth ppt download
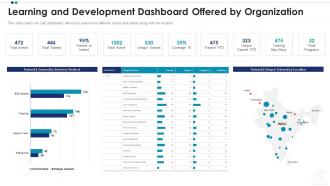
This slide covers the L and D dashboard offered by business to different teams and bands along with the location. Deliver an outstanding presentation on the topic using this Learning And Development Dashboard Employee Professional Growth Ppt Download. Dispense information and present a thorough explanation of Location, Product Training, Progress Workshop, Situational Leadership using the slides given. This template can be altered and personalized to fit your needs. It is also available for immediate download. So grab it now.
-
 Website Statistics Dashboard With Landing Pages Performance
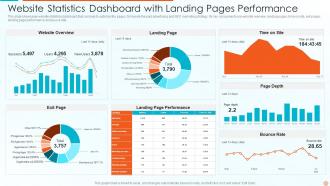
This slide showcases website statistics dashboard that can help to optimize the pages, formulate the paid advertising and SEO marketing strategy. Its key components are website overview, landing pages, time on site, exit pages, landing page performance and bounce rate. Introducing our Website Statistics Dashboard With Landing Pages Performance set of slides. The topics discussed in these slides are Statistics, Dashboard, Performance. This is an immediately available PowerPoint presentation that can be conveniently customized. Download it and convince your audience.
-
 Direct Marketing Dashboard For Tracking Business Revenues Effective B2b Marketing Organization Set 2
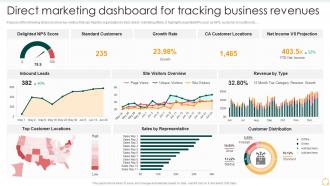
Purpose of the following slide is to show key metrics that can help the organization to track direct marketing efforts, it highlights essential KPIs such as NPS, customer by location etc. Present the topic in a bit more detail with this Direct Marketing Dashboard For Tracking Business Revenues Effective B2b Marketing Organization Set 2. Use it as a tool for discussion and navigation on Marketing, Dashboard, Business. This template is free to edit as deemed fit for your organization. Therefore download it now.
-
 Consumer Service Strategy Vendor Evaluation Matrix On Various Factors Consumer Service Strategy Transformation
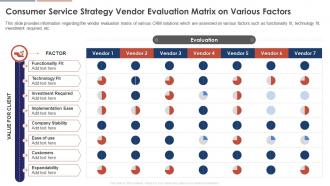
This slide provides information regarding the vendor evaluation matrix of various CRM solutions which are assessed on various factors such as functionality fit, technology fit, investment required, etc. Present the topic in a bit more detail with this Consumer Service Strategy Vendor Evaluation Matrix On Various Factors Consumer Service Strategy Transformation. Use it as a tool for discussion and navigation on Functionality Fit, Technology Fit, Investment Required, Implementation Ease. This template is free to edit as deemed fit for your organization. Therefore download it now.
-
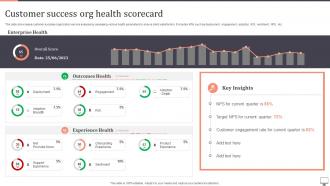 Customer Success Org Health Scorecard
This slide showcases customer success organization service analysis by assessing various health parameters to ensure client satisfaction. It includes KPIs such as deployment, engagement, adoption, ROI, sentiment, NPS, etc. Presenting our well-structured Customer Success Org Health Scorecard. The topics discussed in this slide are Customer Success, Org Health Scorecard. This is an instantly available PowerPoint presentation that can be edited conveniently. Download it right away and captivate your audience.
-
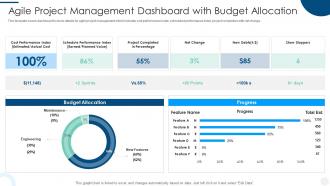 Agile Project Management Dashboard With Budget Allocation
This template covers dashboard to show details for agile project management which includes cost performance index, scheduled performance index, project completion with net change. Introducing our Agile Project Management Dashboard With Budget Allocation set of slides. The topics discussed in these slides are Cost Performance, Schedule Performance, Budget Allocation. This is an immediately available PowerPoint presentation that can be conveniently customized. Download it and convince your audience.
-
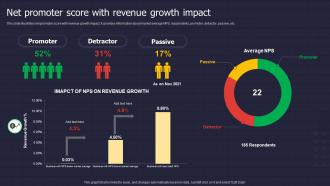 Net Promoter Score With Revenue Growth Impact
This slide illustrates net promoter score with revenue growth impact. It provides information about market average NPS, respondents, promoter, detractor, passive, etc. Introducing our Net Promoter Score With Revenue Growth Impact set of slides. The topics discussed in these slides are Promoter, Detractor, Passive, Revenue Growth. This is an immediately available PowerPoint presentation that can be conveniently customized. Download it and convince your audience.
-
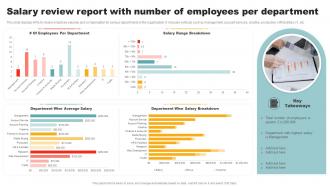 Salary Review Report With Number Of Employees Per Department
This slide displays KPIs to review employee salaries and compensation for various departments in the organization. It includes verticals such as management, account services, creative, production, HR facilities, IT, etc. Introducing our Salary Review Report With Number Of Employees Per Department set of slides. The topics discussed in these slides are Department Wise Salary Breakdown. This is an immediately available PowerPoint presentation that can be conveniently customized. Download it and convince your audience.
-
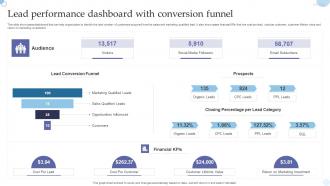 Lead Performance Dashboard With Conversion Funnel
This slide showcases dashboard that can help organization to identify the total number of customers acquired from the sales and marketing qualified lead. It also showcases financial KPIs that are cost per lead, cost per customer, customer lifetine value and return on marketing investment. Presenting our well structured Lead Performance Dashboard With Conversion Funnel. The topics discussed in this slide are Audience, Prospects, Customers. This is an instantly available PowerPoint presentation that can be edited conveniently. Download it right away and captivate your audience.
-
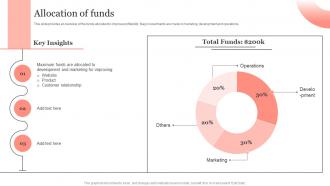 Allocation Of Funds Portable Printer Investor Fund Raising Pitch Deck
This slide provides an overview of the funds allocated to improve profitability. Major investments are made in marketing, development and operations. Present the topic in a bit more detail with this Allocation Of Funds Portable Printer Investor Fund Raising Pitch Deck. Use it as a tool for discussion and navigation on Operations, Marketing. This template is free to edit as deemed fit for your organization. Therefore download it now.
-
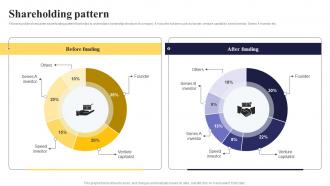 Shareholding Pattern Task Management Software Investment Pitch Deck
Following slide showcases shareholding pattern that helps to understand ownership structure of company. It includes holders such as funder, venture capitalist, seed investor, Series A investor etc. Deliver an outstanding presentation on the topic using this Shareholding Pattern Task Management Software Investment Pitch Deck. Dispense information and present a thorough explanation of Shareholding Pattern using the slides given. This template can be altered and personalized to fit your needs. It is also available for immediate download. So grab it now.
-
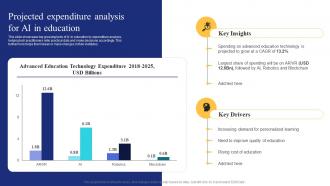 Projected Expenditure For Ai In Education Ai In Education Transforming Teaching And Learning AI SS
This slide showcases top grossing facts of AI in education by expenditure analysis, helping tech practitioners refer practical data and make decisions accordingly. This furthermore helps them tweak or make changes in their institutes. Deliver an outstanding presentation on the topic using this Projected Expenditure For Ai In Education Ai In Education Transforming Teaching And Learning AI SS. Dispense information and present a thorough explanation of Expenditure, Analysis, Personalized using the slides given. This template can be altered and personalized to fit your needs. It is also available for immediate download. So grab it now.
-
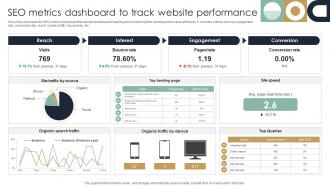 SEO Metrics Dashboard To Track Website Performance
This slide showcases the SEO metrics dashboard that assists businesses in tracking and monitoring their website performance effectively. It includes metrics such as engagement rate, conversion rate, reach, organic traffic, top queries, etc. Introducing our SEO Metrics Dashboard To Track Website Performance set of slides. The topics discussed in these slides are Track, Performance, Website. This is an immediately available PowerPoint presentation that can be conveniently customized. Download it and convince your audience.
-
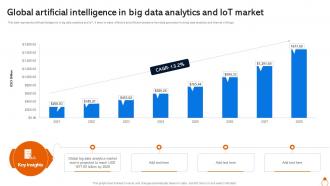 Global Artificial Intelligence In Big Data Analytics And IOT Market
This slide represents artificial intelligence in big data analytics and IoT. It aims to make effective and efficient decisions from data generated from big data analytics and internet of things. Introducing our Global Artificial Intelligence In Big Data Analytics And IOT Market set of slides. The topics discussed in these slides are Global Artificial Intelligence, Big Data Analytics This is an immediately available PowerPoint presentation that can be conveniently customized. Download it and convince your audience.
-
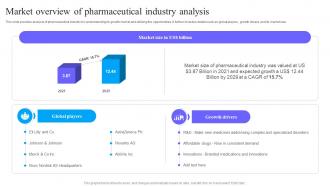 Market Overview Of Pharmaceutical Industry Analysis
This slide provides analysis of pharmaceutical industry for understanding its growth market and utilizing the opportunities. It further includes details such as global players , growth drivers and its market size. Presenting our well structured Market Overview Of Pharmaceutical Industry Analysis The topics discussed in this slide are Market Size, Growth Drivers, Global Players This is an instantly available PowerPoint presentation that can be edited conveniently. Download it right away and captivate your audience.
-
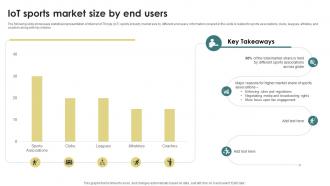 Future Of Sports IoT Sports Market Size By End Users IoT SS
Present the topic in a bit more detail with this Future Of Sports IoT Sports Market Size By End Users IoT SS Use it as a tool for discussion and navigation on Sports Associations, Enforcing Rules And Regulations, Broadcasting Rights This template is free to edit as deemed fit for your organization. Therefore download it now.
-
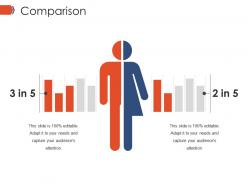 Comparison ppt infographics
Presenting comparison ppt infographics. This is a comparison ppt infographics. This is a two stage process. The stages in this process are comparison, business, marketing, management, percentage.
-
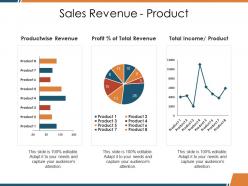 Sales revenue product ppt picture
Presenting this set of slides with name - Sales Revenue Product Ppt Picture. This is a three stage process. The stages in this process are Productwise Revenue, Total Revenue, Total Income, Business, Marketing.
-
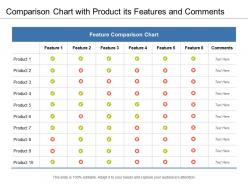 Comparison chart with product its features and comments
Presenting this set of slides with name - Comparison Chart With Product Its Features And Comments. This is a ten stage process. The stages in this process are Comparison Chart, Comparison Table, Comparison Matrix.
-
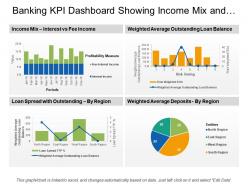 Banking kpi dashboard showing income mix and loan spread
Presenting this set of slides with name - Banking Kpi Dashboard Showing Income Mix And Loan Spread. This is a four stage process. The stages in this process are Banking, Finance, Money.
-
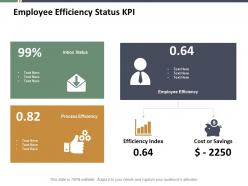 Employee efficiency status kpi ppt summary infographics
Presenting this set of slides with name - Employee Efficiency Status Kpi Ppt Summary Infographics. This is a four stage process. The stages in this process are Business, Management, Marketing.
-
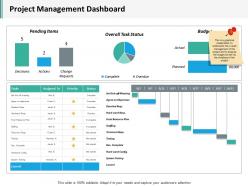 Project management dashboard snapshot ppt inspiration ideas
Presenting this set of slides with name - Project Management Dashboard Snapshot Ppt Inspiration Ideas. This is a three stage process. The stages in this process are Business, Management, Strategy, Analysis, Marketing.
-
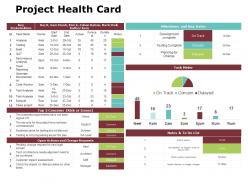 Project health card slide2 ppt powerpoint presentation gallery slides
Presenting this set of slides with name - Project Health Card Slide2 Ppt Powerpoint Presentation Gallery Slides. This is a two stage process. The stages in this process are Business, Management, Strategy, Analysis, Marketing.
-
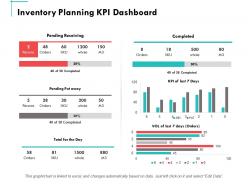 Inventory planning kpi dashboard ppt powerpoint presentation summary graphics
Presenting this set of slides with name - Inventory Planning Kpi Dashboard Ppt Powerpoint Presentation Summary Graphics. This is a four stages process. The stages in this process are Finance, Marketing, Management, Investment, Analysis.
-
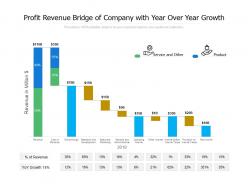 Profit revenue bridge of company with year over year growth
Presenting this set of slides with name Profit Revenue Bridge Of Company With Year Over Year Growth. The topics discussed in these slides are Revenue, Cost Of Revenue, Gross Margin, Research And Development, Sales And Marketing, General And Administrative, Operating Income. This is a completely editable PowerPoint presentation and is available for immediate download. Download now and impress your audience.
-
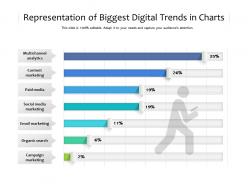 Representation of biggest digital trends in charts
Presenting this set of slides with name Representation Of Biggest Digital Trends In Charts. The topics discussed in these slides are Multichannel Analytics, Content Marketing, Email Marketing, Paid Media, Social Media Marketing, Campaign Marketing. This is a completely editable PowerPoint presentation and is available for immediate download. Download now and impress your audience.
-
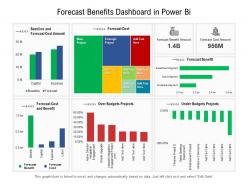 Forecast benefits dashboard in power bi
Presenting this set of slides with name Forecast Benefits Dashboard In Power Bi. The topics discussed in these slides are Budgets, Cost, Benefit. This is a completely editable PowerPoint presentation and is available for immediate download. Download now and impress your audience.
-
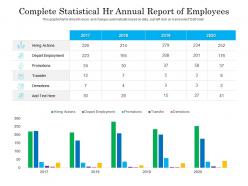 Complete statistical hr annual report of employees
Presenting this set of slides with name Complete Statistical HR Annual Report Of Employees. The topics discussed in these slides are Actions, Transfer, Demotions. This is a completely editable PowerPoint presentation and is available for immediate download. Download now and impress your audience.
-
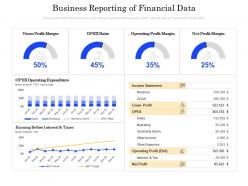 Business reporting of financial data
Presenting this set of slides with name Business Reporting Of Financial Data. The topics discussed in these slides are Gross Profit Margin, OPEX Ratio, Operating Profit Margin, Net Profit Margin. This is a completely editable PowerPoint presentation and is available for immediate download. Download now and impress your audience.
-
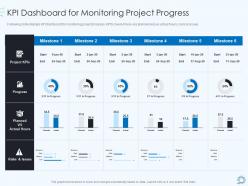 Devops pipeline it kpi dashboard for monitoring project progress ppt gallery graphics tutorials
Following slide displays KPI dashboard for monitoring project progress. KPIS covered here are planned versus actual hours, risks and issues. Present the topic in a bit more detail with this Devops Pipeline IT Kpi Dashboard For Monitoring Project Progress Ppt Gallery Graphics Tutorials. Use it as a tool for discussion and navigation on Project Kpis, Progress, Planned Vs Actual Hours, Risks And Issues. This template is free to edit as deemed fit for your organization. Therefore download it now.
-
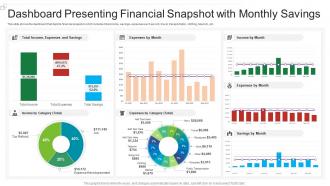 Dashboard presenting financial snapshot with monthly savings
Presenting our well structured Dashboard Presenting Financial Snapshot With Monthly Savings. The topics discussed in this slide are Income, Expenses. This is an instantly available PowerPoint presentation that can be edited conveniently. Download it right away and captivate your audience.
-
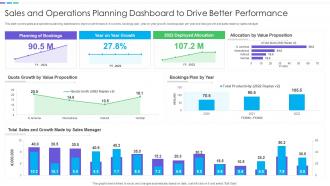 Sales And Operations Planning Dashboard To Drive Better Performance
This slide covers sales and operations planning dashboard to improve performance. It involves bookings plan, year on year growth, bookings plan per year and total growth and sales made by sales manager. Presenting our well structured Sales And Operations Planning Dashboard To Drive Better Performance. The topics discussed in this slide are Value Proposition, Sales And Growth, Sales Manager. This is an instantly available PowerPoint presentation that can be edited conveniently. Download it right away and captivate your audience.
-
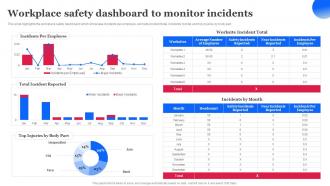 Workplace Safety Dashboard To Monitor Incidents Workplace Safety Management Hazard
This slide highlights the workplace safety dashboard which showcase incidents per employee, worksite incident total, incidents by total and top injuries by body part. Deliver an outstanding presentation on the topic using this Workplace Safety Dashboard To Monitor Incidents Workplace Safety Management Hazard. Dispense information and present a thorough explanation of Workplace Safety, Dashboard, Monitor Incidents using the slides given. This template can be altered and personalized to fit your needs. It is also available for immediate download. So grab it now.
-
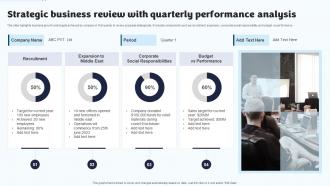 Strategic Business Review With Quarterly Performance Analysis
This slide highlights business growth and targets achieved by company in first quarter to review progress strategically. It includes components such as recruitment, expansion, corporate social responsibility and budget vs performance. Introducing our Strategic Business Review With Quarterly Performance Analysis set of slides. The topics discussed in these slides are Analysis Recruitment, Expansion To Middle East, Corporate Social Responsibilities. This is an immediately available PowerPoint presentation that can be conveniently customized. Download it and convince your audience.
-
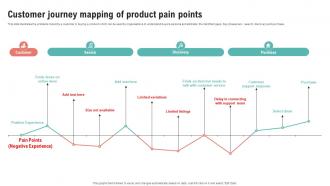 Customer Journey Mapping Of Product Pain Points
This slide illustrates the problems faced by a customer in buying a product which can be used by organisations to understand buyers persona and eliminate the identified gaps. Key phases are search, discovery and purchase. Deliver an outstanding presentation on the topic using this Customer Journey Mapping Of Product Pain Points. Dispense information and present a thorough explanation of Customer, Search, Discovery using the slides given. This template can be altered and personalized to fit your needs. It is also available for immediate download. So grab it now.
-
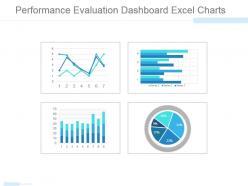 Performance evaluation dashboard excel charts powerpoint topics
Presenting performance evaluation dashboard excel charts powerpoint topics. This is a performance evaluation dashboard excel charts powerpoint topics. This is a four stage process. The stages in this process are graph, finance, dashboard, pie, business.
-
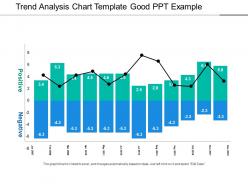 Trend analysis chart template good ppt example
Presenting Trend Analysis Chart Template Good Ppt Example. This PPT presentation is thoroughly researched by the experts and the slide consists of appropriate content that can be modified. It is fully customizable. You can add or delete the content as per your need. Not just this, you can also make the required changes in the texts and shapes. Download this professionally designed PPT, add your content and present it with confidence.
-
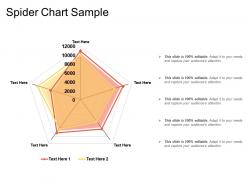 Spider chart sample
Presenting Spider Chart Sample template. Make modifications in the font color, font size, and font style of the slide as it is entirely customizable. Its compatibility with Google Slides makes it accessible at once. You can transform and save the slide in PDF and JPG formats as well. Get this high-quality slide to present it in front of thousands of people on a standard screen and widescreen.
-
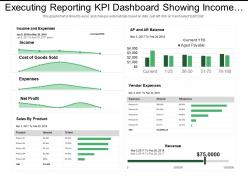 Executing reporting kpi dashboard snapshot showing income sales by product vendor expenses
Presenting this set of slides with name - Executing Reporting Kpi Dashboard Snapshot Showing Income Sales By Product Vendor Expenses. This is a four stage process. The stages in this process are Executive Reporting, Executive Analysis, Executive Performance.
-
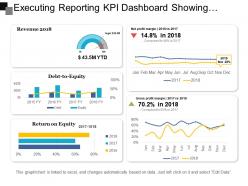 Executing reporting kpi dashboard showing revenue net profit margin debt to equity
Presenting this set of slides with name - Executing Reporting Kpi Dashboard Showing Revenue Net Profit Margin Debt To Equity. This is a five stage process. The stages in this process are Executive Reporting, Executive Analysis, Executive Performance.


