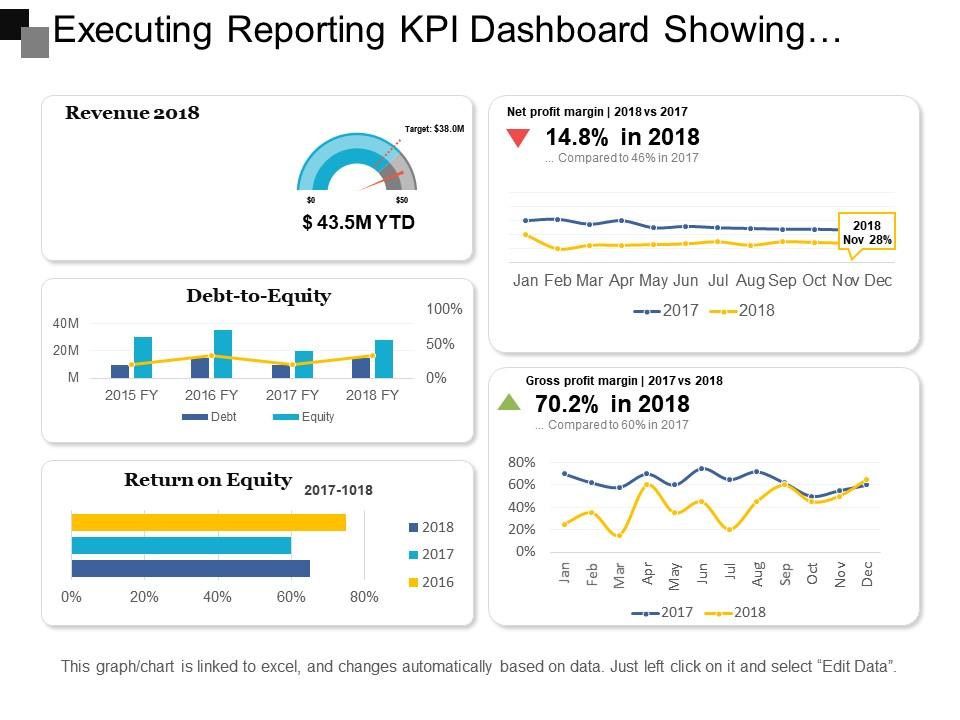
Executing reporting kpi dashboard showing revenue net profit margin debt to equity
Act as a beacon with our Executing Reporting Kpi Dashboard Showing Revenue Net Profit Margin Debt To Equity. Your guidance will be appreciated.
You must be logged in to download this presentation.
 Impress your
 audience
Editable
of Time
PowerPoint presentation slides
Presenting this set of slides with name - Executing Reporting Kpi Dashboard Showing Revenue Net Profit Margin Debt To Equity. This is a five stage process. The stages in this process are Executive Reporting, Executive Analysis, Executive Performance.
People who downloaded this PowerPoint presentation also viewed the following :
Executing reporting kpi dashboard showing revenue net profit margin debt to equity with all 6 slides:
Identify the axis to follow with our Executing Reporting Kpi Dashboard Showing Revenue Net Profit Margin Debt To Equity. Discover the best direction to advance along.
-
Great experience, I would definitely use your services further.
-
Great experience, I would definitely use your services further.


