Charts, Graphs PowerPoint Designs, Presentation Charts Designs & PPT Graphics
- Sub Categories
-
- Arrows and Targets
- Bullet and Text Slides
- Charts and Graphs
- Circular Cycle Diagrams
- Concepts and Shapes
- Custom Flat Designs
- Dashboards and Measuring
- Flow Process
- Funnels
- Gears
- Growth
- Harvey Balls
- Idea Innovation and Light Bulbs
- Leadership
- Linear Process Diagrams
- Magnifying Glass
- Misc Other Graphics
- Opportunity and Handshake
- Organization Charts
- Puzzles
- Pyramids
- Roadmaps and Timelines
- Silhouettes
- Steps
- Strategic Planning Analysis
- SWOT Analysis
- Tables and Matrix
- Teamwork
- Technology and Communication
- Venn Diagrams
- Visuals and Illustrations
-
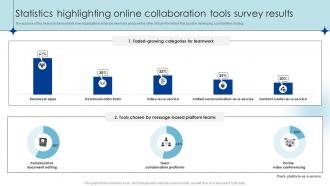 Statistics Highlighting Online Collaboration Tools Survey Results
The purpose of this slide is to demonstrate how organizations embrace new tools and provides other critical information that assist in developing a competitive strategy. Presenting our well structured Statistics Highlighting Online Collaboration Tools Survey Results. The topics discussed in this slide are Collaborative Document Editing, Team Collaboration Platforms, Online Video Conferencing. This is an instantly available PowerPoint presentation that can be edited conveniently. Download it right away and captivate your audience.
-
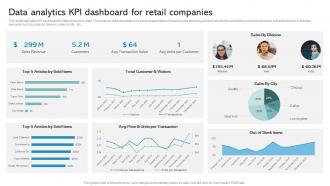 Data Analytics KPI Dashboard For Retail Companies
This slide highlights KPI dashboard for data analysis in retail. The purpose of this template is to assist organizations in tracking and analyzing product demand for predicting customer behaviour and preferences. It includes elements such as sales by division, sales by city, etc. Presenting our well structured Data Analytics KPI Dashboard For Retail Companies. The topics discussed in this slide are Total Customer And Visitors, Units Per Transaction, Articles By Sold Items. This is an instantly available PowerPoint presentation that can be edited conveniently. Download it right away and captivate your audience.
-
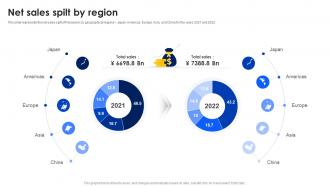 Net Sales Spilt By Region Panasonic Company Profile CP SS
This slide represents the net sales split of Panasonic by geographical regions Japan, Americas, Europe, Asia, and China for the years 2021 and 2022. Present the topic in a bit more detail with this Net Sales Spilt By Region Panasonic Company Profile CP SS. Use it as a tool for discussion and navigation on Geographical, Sales, Region. This template is free to edit as deemed fit for your organization. Therefore download it now.
-
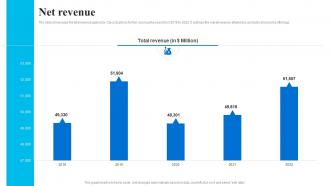 Net Revenue Cisco Company Profile CP SS
The slide showcases the total revenue gained by Cisco Systems for five consecutive years from 2018 to 2022. It outlines the overall revenue attained by products and service offerings. Present the topic in a bit more detail with this Net Revenue Cisco Company Profile CP SS. Use it as a tool for discussion and navigation on Revenue, Consecutive, Revenue. This template is free to edit as deemed fit for your organization. Therefore download it now.
-
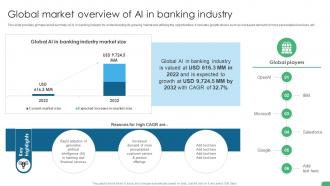 Global Market Overview Of Ai In Banking Industry Digital Transformation In Banking DT SS
This slide provides glimpse about summary of AI in banking industry for understanding its growing market and utilizing the opportunities. It includes growth drivers such as increased demand of more personalized services, etc. Present the topic in a bit more detail with this Global Market Overview Of Ai In Banking Industry Digital Transformation In Banking DT SS Use it as a tool for discussion and navigation on Global AI, Banking Industry Market Size, Microsoft This template is free to edit as deemed fit for your organization. Therefore download it now.
-
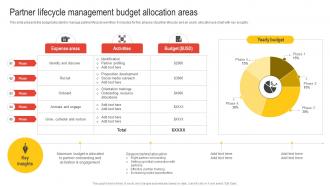 Partner Lifecycle Management Budget Allocation Areas Nurturing Relationships
This slide presents the budget allocated to manage partner lifecycle workflow. It includes for five phases of partner lifecycle and an yearly allocation pie chart with key insights. Present the topic in a bit more detail with this Partner Lifecycle Management Budget Allocation Areas Nurturing Relationships Use it as a tool for discussion and navigation on Expense Areas, Activities, Budget This template is free to edit as deemed fit for your organization. Therefore download it now.
-
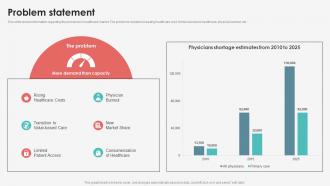 Problem Statement Digital Healthcare Company Fundraising
This slide shows information regarding the problems in healthcare market. The problems include increasing healthcare cost, limited access to healthcare, physical burnout, etc. Deliver an outstanding presentation on the topic using this Problem Statement Digital Healthcare Company Fundraising. Dispense information and present a thorough explanation of Healthcare, Physician, Market, Access, Consumerization using the slides given. This template can be altered and personalized to fit your needs. It is also available for immediate download. So grab it now.
-
 Firewall Network Security Firewall Protected Network Performance Tracking Dashboard
This slide outlines the overall performance of a firewall-protected network. The purpose of this slide is to showcase the total traffic, traffic by application, URLs by actions, threats by severity, traffic by source IP, traffic by application, blocked URLs by category, threats by severity, and so on. Deliver an outstanding presentation on the topic using this Firewall Network Security Firewall Protected Network Performance Tracking Dashboard Dispense information and present a thorough explanation of Software, Features, Providers using the slides given. This template can be altered and personalized to fit your needs. It is also available for immediate download. So grab it now.
-
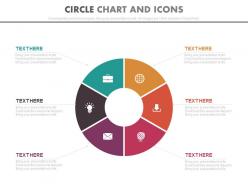 New six staged circle chart and icons for global business strategy flat powerpoint design
Presenting new six staged circle chart and icons for global business strategy flat powerpoint design. Presenting new six staged circle chart and icons for global business strategy flat powerpoint design. This Power Point template diagram has been crafted with graphic of six staged circle chart and icons. This PPT diagram contains the concept of global business strategy and analysis. Use this PPT diagram can be used for business and marketing related presentations.
-
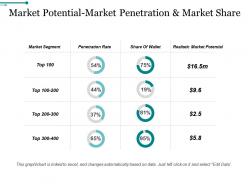 Market potential market penetration and market share ppt images gallery
Presenting market potential market penetration and market share ppt images gallery. This is a market potential market penetration and market share ppt images gallery. This is a eight stage process. The stages in this process are market segment, penetration rate, share of wallet, realistic market potential.
-
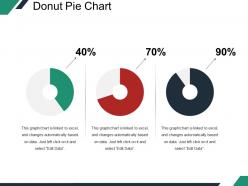 Donut pie chart ppt background
Presenting Donut Pie Chart PPT Background. This PPT presentation is Google Slides compatible hence it is easily accessible. You can download and save this PowerPoint layout in different formats like PDF, PNG, and JPG. This PPT theme is available in both 4:3 and 16:9 aspect ratios. This PowerPoint template is customizable so you can modify the font size, font type, color and shapes as per your requirements.
-
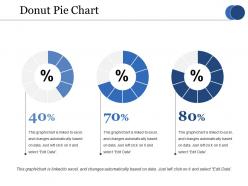 Donut pie chart ppt portfolio summary
Presenting this set of slides with name - Donut Pie Chart Ppt Portfolio Summary. This is a three stage process. The stages in this process are Percentage, Finance, Donut, Business.
-
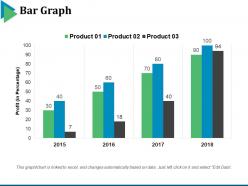 Bar graph powerpoint slide template
Presenting this set of slides with name - Bar Graph Powerpoint Slide Template. This is a three stage process. The stages in this process are Profit, Years, Business, Marketing, Finance, Graph.
-
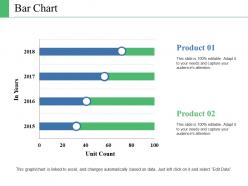 Bar chart ppt background graphics
Presenting a PowerPoint slide named Bar chart PPT background graphics. Use this completely customizable and easy-to-edit PPT slide to communicate your ideas in the presentation. You can format the font size, color and style of the slide. Background color can be altered too. Add your desired content anywhere in the slide. It’s compatibility with Google slides make it readily accessible. You can save it in PDF as well as JPG formats. This PPT template offers a simple and fresh design with lots of icons to choose from. This PPT slide is Excel-linked also. Have an engaging presentation ready in minutes with this PPT template.
-
 Training timeline process ppt infographics example introduction
Presenting this set of slides with name - Training Timeline Process Ppt Infographics Example Introduction. This is a six stage process. The stages in this process are Timeline, Business, Planning, Management, Process.
-
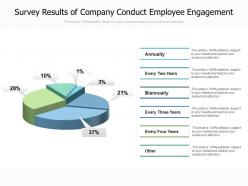 Survey results of company conduct employee engagement
Presenting this set of slides with name Survey Results Of Company Conduct Employee Engagement. This is a six stage process. The stages in this process are Survey Results Of Company Conduct Employee Engagement. This is a completely editable PowerPoint presentation and is available for immediate download. Download now and impress your audience.
-
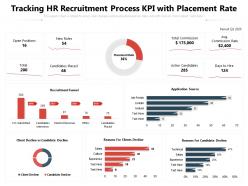 Tracking hr recruitment process kpi with placement rate
Presenting this set of slides with name Tracking HR Recruitment Process KPI With Placement Rate. The topics discussed in these slides are Open Positions, Total Commission, Recrement Funnel, Application Source, Client Decline, Candidate Decline. This is a completely editable PowerPoint presentation and is available for immediate download. Download now and impress your audience.
-
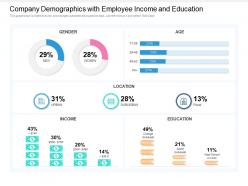 Company demographics with employee income and education
Presenting this set of slides with name Company Demographics With Employee Income And Education. The topics discussed in these slides are Income, Education, Location. This is a completely editable PowerPoint presentation and is available for immediate download. Download now and impress your audience.
-
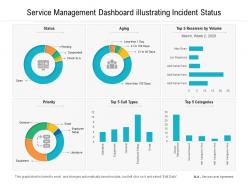 Service management dashboard illustrating incident status
Presenting this set of slides with name Service Management Dashboard Illustrating Incident Status. The topics discussed in these slides are Priority, Status, Aging. This is a completely editable PowerPoint presentation and is available for immediate download. Download now and impress your audience.
-
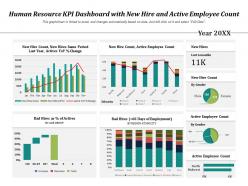 Human resource kpi dashboard with new hire and active employee count
Introducing our Human Resource KPI Dashboard With New Hire And Active Employee Count set of slides. The topics discussed in these slides are Human Resource KPI Dashboard With New Hire And Active Employee Count. This is an immediately available PowerPoint presentation that can be conveniently customized. Download it and convince your audience.
-
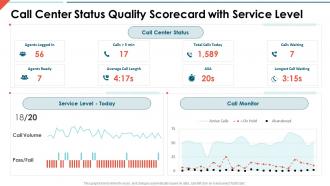 Call center quality scorecard call center status quality scorecard with service level
Deliver an outstanding presentation on the topic using this Call Center Quality Scorecard Call Center Status Quality Scorecard With Service Level. Dispense information and present a thorough explanation of Call Center Status Quality Scorecard With Service Level using the slides given. This template can be altered and personalized to fit your needs. It is also available for immediate download. So grab it now.
-
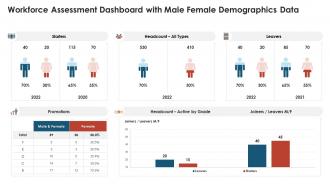 Workforce assessment dashboard with male female demographics data
Presenting our well structured Workforce Assessment Dashboard With Male Female Demographics Data. The topics discussed in this slide are Workforce Assessment Dashboard With Male Female Demographics Data. This is an instantly available PowerPoint presentation that can be edited conveniently. Download it right away and captivate your audience.
-
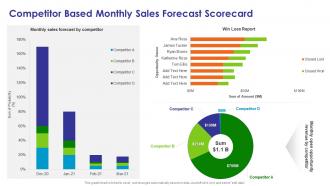 Monthly sales scorecard competitor based monthly sales forecast scorecard
Deliver an outstanding presentation on the topic using this Monthly Sales Scorecard Competitor Based Monthly Sales Forecast Scorecard. Dispense information and present a thorough explanation of Competitor Based Monthly Sales Forecast Scorecard using the slides given. This template can be altered and personalized to fit your needs. It is also available for immediate download. So grab it now.
-
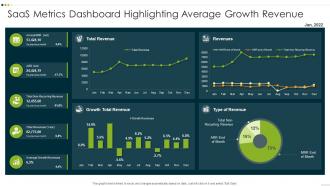 SaaS Metrics Dashboard Highlighting Average Growth Revenue
Introducing our SaaS Metrics Dashboard Highlighting Average Growth Revenue set of slides. The topics discussed in these slides are Revenue, Growth Total Revenue, Type Of Revenue. This is an immediately available PowerPoint presentation that can be conveniently customized. Download it and convince your audience.
-
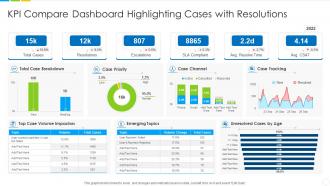 KPI Compare Dashboard Highlighting Cases With Resolutions
Introducing our KPI Compare Dashboard Highlighting Cases With Resolutions set of slides. The topics discussed in these slides are Case Priority, Case Channel, Case Tracking. This is an immediately available PowerPoint presentation that can be conveniently customized. Download it and convince your audience.
-
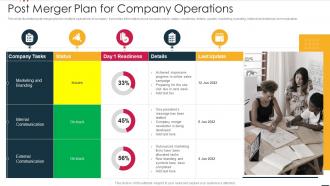 Post Merger Plan For Company Operations
This slide illustrates post merger plan for multiple operations of company. It provides information about company tasks, status, readiness, details, update, marketing, branding, internal and external communication. Presenting our well structured Post Merger Plan For Company Operations. The topics discussed in this slide are Marketing And Branding, Internal Communication, External Communication. This is an instantly available PowerPoint presentation that can be edited conveniently. Download it right away and captivate your audience.
-
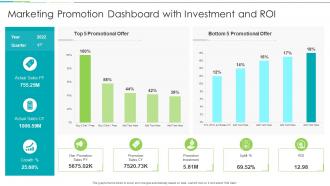 Marketing Promotion Dashboard With Investment And ROI
Presenting our well structured Marketing Promotion Dashboard With Investment And ROI. The topics discussed in this slide are Promotional Offer, Promotion Sales, Promotion Investment. This is an instantly available PowerPoint presentation that can be edited conveniently. Download it right away and captivate your audience.
-
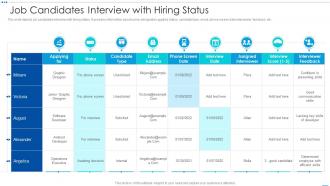 Job Candidates Interview With Hiring Status
This slide depicts job candidates interview with hiring status. It provides information about name, designation applied, status, candidate type, email, phone screen date interviewer, feedback, etc. Presenting our well structured Job Candidates Interview With Hiring Status. The topics discussed in this slide are Junior Graphic Designer, Android Developer, Operations Executive. This is an instantly available PowerPoint presentation that can be edited conveniently. Download it right away and captivate your audience.
-
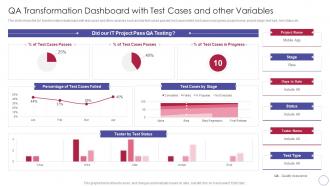 Implementing Quality Assurance Transformation Qa Transformation Dashboard Test
This slide shows the QA transformation dashboard with test cases and other variables such as total test cases passed, test cases failed, test cases in progress, project name, project stage, test type, test status etc. Deliver an outstanding presentation on the topic using this Implementing Quality Assurance Transformation Qa Transformation Dashboard Test. Dispense information and present a thorough explanation of QA Transformation Dashboard With Test Cases And Other Variables using the slides given. This template can be altered and personalized to fit your needs. It is also available for immediate download. So grab it now.
-
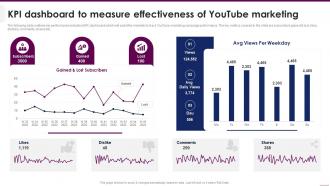 KPI Dashboard Snapshot To Measure Effectiveness Implementing Video Marketing Strategies
The following slide outlines key performance indicator KPI dashboard which will assist the marketer to track YouTube marketing campaign performance. The key metrics covered in the slide are subscribers gained and lost, likes, dislikes, comments, shares etc. Present the topic in a bit more detail with this KPI Dashboard Snapshot To Measure Effectiveness Implementing Video Marketing Strategies. Use it as a tool for discussion and navigation on Dashboard, Measure Effectiveness, Youtube Marketing. This template is free to edit as deemed fit for your organization. Therefore download it now.
-
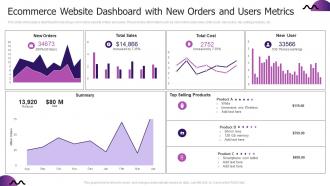 Ecommerce Website Dashboard With New Orders And Users Metrics
This slide showcases a dashboard for tracking e commerce website orders and users. This provides information such as new orders, total sales, total costs, new users, top-selling products, etc. Introducing our Ecommerce Website Dashboard With New Orders And Users Metrics set of slides. The topics discussed in these slides are Ecommerce Website Dashboard, New Orders, Users Metrics. This is an immediately available PowerPoint presentation that can be conveniently customized. Download it and convince your audience.
-
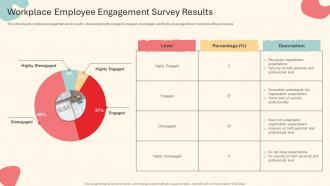 Workplace Employee Engagement Survey Results
This slide depicts employee engagement survey results, showcasing highly engaged, engaged, disengaged, and highly disengaged team members at the workspace. Introducing our Workplace Employee Engagement Survey Results set of slides. The topics discussed in these slides are Highly Disengaged, Disengaged, Engaged, Highly Engaged. This is an immediately available PowerPoint presentation that can be conveniently customized. Download it and convince your audience.
-
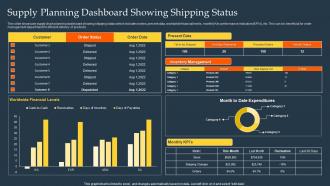 Supply Planning Dashboard Snapshot Showing Shipping Status
This slide showcase supply chain planning dashboard snapshot showing shipping status which includes orders, present data, worldwide financial levels, monthly Key performance indicators KPIs, etc. This can be beneficial for order management department for efficient delivery of products. Introducing our Supply Planning Dashboard Showing Shipping Status set of slides. The topics discussed in these slides are Supply Planning, Dashboard Showing Shipping, Status. This is an immediately available PowerPoint presentation that can be conveniently customized. Download it and convince your audience.
-
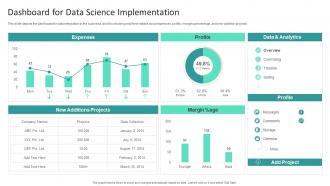 Dashboard For Data Science Implementation Information Studies
This slide depicts the dashboard for data integration in the business, and it is showing real-time details about expenses, profits, margins percentage, and new addition projects. Present the topic in a bit more detail with this Dashboard For Data Science Implementation Information Studies. Use it as a tool for discussion and navigation on Implementation, Dashboard, Business. This template is free to edit as deemed fit for your organization. Therefore download it now.
-
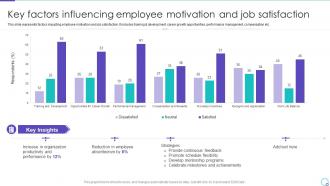 Key Factors Influencing Employee Motivation And Job Satisfaction Ppt Inspiration
This slide represents factors impacting employee motivation and job satisfaction. It includes training and development, career growth opportunities, performance management, compensation etc. Deliver an outstanding presentation on the topic using this Key Factors Influencing Employee Motivation And Job Satisfaction Ppt Inspiration. Dispense information and present a thorough explanation of Organization Productivity, Strategies, Continuous Feedback using the slides given. This template can be altered and personalized to fit your needs. It is also available for immediate download. So grab it now.
-
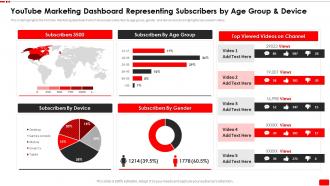 Youtube Marketing Dashboard Representing Subscribers By Video Content Marketing Plan For Youtube Advertising
This slide highlights the YouTube Marketing dashboard which showcase subscriber by age group, gender and device and also highlights top viewed videos. Present the topic in a bit more detail with this Youtube Marketing Dashboard Representing Subscribers By Video Content Marketing Plan For Youtube Advertising. Use it as a tool for discussion and navigation on Marketing, Dashboard, Representing. This template is free to edit as deemed fit for your organization. Therefore download it now.
-
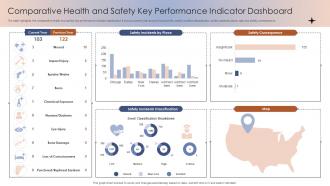 Comparative Health And Safety Key Performance Indicator Dashboard
The slide highlights the comparative health and safety key performance indicator dashboard. It shows current year and previous events, safety incident classification, safety cases by place, map and safety consequence Introducing our Comparative Health And Safety Key Performance Indicator Dashboard set of slides. The topics discussed in these slides are Comparative Health, Safety, Key Performance Indicator, Dashboard. This is an immediately available PowerPoint presentation that can be conveniently customized. Download it and convince your audience.
-
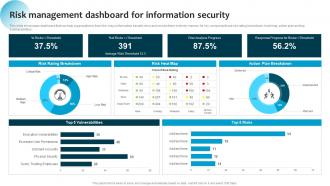 Information System Security And Risk Administration Plan Risk Management Dashboard For Information Security
This slide showcases dashboard that can help organization to track the major information security risks and resolve them in timely manner. Its key components are risk rating breakdown, heat map, action plan and top 5 vulnerabilities. Deliver an outstanding presentation on the topic using this Information System Security And Risk Administration Plan Risk Management Dashboard For Information Security. Dispense information and present a thorough explanation of Risk Rating Breakdown, Risk Heat Map, Action Plan Breakdown using the slides given. This template can be altered and personalized to fit your needs. It is also available for immediate download. So grab it now.
-
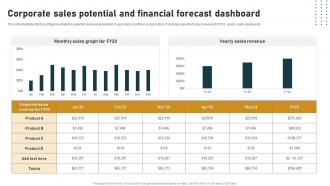 Corporate Sales Potential And Financial Forecast Dashboard
This slide illustrates facts and figures related to expected revenue generation in upcoming months in a corporation. It includes expected sales revenue for FY23, yearly sales revenue etc. Introducing our Corporate Sales Potential And Financial Forecast Dashboard set of slides. The topics discussed in these slides are Monthly Sales Graph, Revenue, Corporate Sales. This is an immediately available PowerPoint presentation that can be conveniently customized. Download it and convince your audience.
-
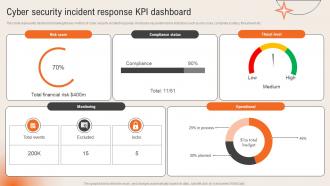 Cyber Security Incident Response Kpi Dashboard Deploying Computer Security Incident Management
This slide represents dashboard showing the key metrics of cyber security incident response. It includes key performance indicators such as risk score, compliance status, threat level etc.Present the topic in a bit more detail with this Cyber Security Incident Response Kpi Dashboard Deploying Computer Security Incident Management. Use it as a tool for discussion and navigation on Compliance Status, Threat Level, Operational. This template is free to edit as deemed fit for your organization. Therefore download it now.
-
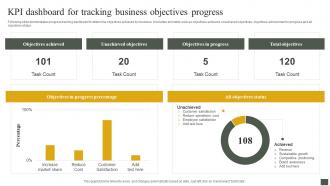 Kpi Dashboard For Tracking Business Objectives Progress
Following slide demonstrates progress tracking dashboard to determine objectives achieved by business. It includes elements such as objectives achieved, unachieved objectives, objectives achievement in progress and all objectives status.Presenting our well structured Kpi Dashboard For Tracking Business Objectives Progress. The topics discussed in this slide are Objectives Achieved, Unachieved Objectives, Objectives Progress . This is an instantly available PowerPoint presentation that can be edited conveniently. Download it right away and captivate your audience.
-
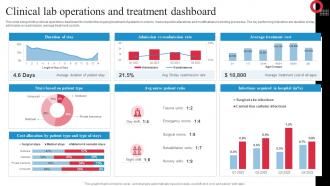 Clinical Lab Operations And Treatment Dashboard
This slide brings forth a clinical operations dashboard to monitor the ongoing treatment of patients in order to make requisite alterations and modifications in existing processes. The key performing indicators are duration of stay, admission vs readmission, average treatment cost etc. Introducing our Clinical Lab Operations And Treatment Dashboard set of slides. The topics discussed in these slides are Emergency, Trauma, Surgical. This is an immediately available PowerPoint presentation that can be conveniently customized. Download it and convince your audience.
-
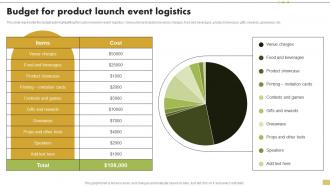 Budget For Product Launch Event Logistics Steps For Implementation Of Corporate
This slide represents the budget plan highlighting the costs involved in event logistics. Various items included are venue charges, food and beverages, product showcase, gifts, rewards, giveaways, etc. Present the topic in a bit more detail with this Budget For Product Launch Event Logistics Steps For Implementation Of Corporate. Use it as a tool for discussion and navigation on Items, Cost. This template is free to edit as deemed fit for your organization. Therefore download it now.
-
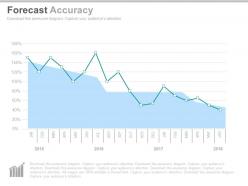 One forecast accuracy curve powerpoint slides
Presenting one forecast accuracy curve powerpoint slides. This Power Point template slide has been crafted with graphic of parabolic curves charts. This PPT slide contains the concept of result forecast accuracy analysis. Use this PPT slide for business and marketing related presentations.
-
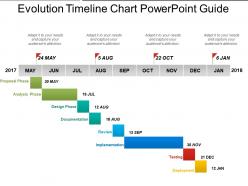 Evolution timeline chart powerpoint guide
Presenting evolution timeline chart PowerPoint guide PPT slide which is 100% editable. This PPT slide is easy to customize and enables you to personalize it as per your own criteria. The presentation slide is fully compatible with Google slides, multiple format and software options. In case of any assistance, kindly take instructions from our presentation design services and it is easy to download in a very short span of time. The images, layouts, designs are of high quality and ensures quality in widescreen. Sales professionals makes use of this template.
-
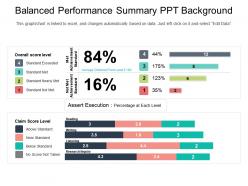 Balanced performance summary ppt background
Presenting Balanced Performance Summary PPT Background which is professionally designed and 100% editable. You can customize the color, fonts, font size and font types as per the requirement. This slide is adaptable with the Google Slides which makes it easily accessible at once. Can be converted into formats like PDF, JPG and PNG. It is available in both standard and widescreen. You can modify the shape of the diagram which makes your presentation look even more engaging.
-
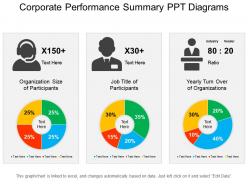 Corporate performance summary ppt diagrams
Presenting a PPT template named Corporate Performance Summary PPT Diagram. You can edit the color, style and size of the font. You can replace and rewrite the text as per your requirement. Add or delete the content anywhere in the deck of PPT slides. We at SlideTeam offer you with high-quality visuals and graphics to enhance your presentation. Provide your audience with the needful visual aid by using this template. This PowerPoint slide is compatible with Google Slides. You can export the slide anywhere in any format like JPG or PDF formats.
-
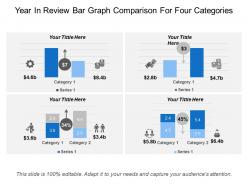 Year in review bar graph comparison for four categories
Presenting this set of slides with name - Year In Review Bar Graph Comparison For Four Categories. This is a four stage process. The stages in this process are Year In Review, Year Highlights, Countdowns.
-
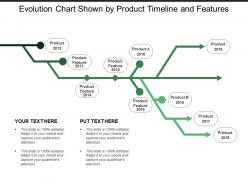 Evolution chart shown by product timeline and features
Presenting this set of slides with name - Evolution Chart Shown By Product Timeline And Features. This is a eight stage process. The stages in this process are Evolution Chart, Transformation Chart, Evolution Graph.
-
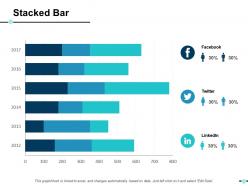 Stacked bar ppt slides summary
Presenting this set of slides with name - Stacked Bar Ppt Slides Summary. This is a three stage process. The stages in this process are Business, Management, Strategy, Analysis, Marketing.
-
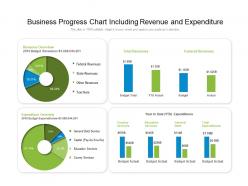 Business progress chart including revenue and expenditure
Presenting this set of slides with name Business Progress Chart Including Revenue And Expenditure. The topics discussed in these slides are Federal Revenues, State Revenues, Other Revenues. This is a completely editable PowerPoint presentation and is available for immediate download. Download now and impress your audience.
-
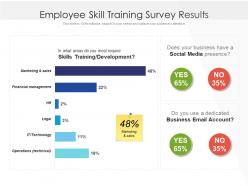 Employee skill training survey results
Presenting this set of slides with name Employee Skill Training Survey Results. The topics discussed in these slides are Marketing And Sales, Financial Management, Technology, Legal, Operations Technical. This is a completely editable PowerPoint presentation and is available for immediate download. Download now and impress your audience.
-
 Lead to win dashboard with pipeline trends and source powerpoint template
This slide shows the graphs related to Pipeline trends and Number of leads to win. Additionally, it covers data such as number of leads created, number of leads qualified, number of opportunities created and closed, etc. This is Lead To Win Dashboard With Pipeline Trends And Source Powerpoint Template with high quality vector based graphics, that can be edited as per your business needs. You can also reproduce this slide in various formats, be it PNG, JPG, etc. This slide also comes with an additional feature of portrayal on standard and widescreen aspect ratios, thus retaining its high quality.
-
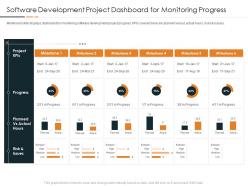 Software Development Project Dashboard For MonIToring Progress DevOps In Hybrid Model IT
Mentioned slide displays dashboard for monitoring software development project progress. KPIs covered here are planned versus actual hours, risks and issues. Present the topic in a bit more detail with this Software Development Project Dashboard For MonIToring Progress DevOps In Hybrid Model IT. Use it as a tool for discussion and navigation on Project KPIS, Progress, Planned Vs Actual Hours, Risk And Issues, Milestone. This template is free to edit as deemed fit for your organization. Therefore download it now.
-
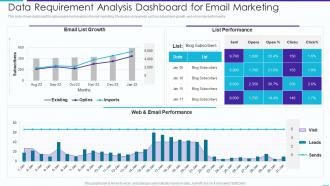 Data Requirement Analysis Dashboard Snapshot For Email Marketing
This slide shows dashboard for data requirement analysis of email marketing. It includes components such as subscribers growth, web and email performance. Presenting our well-structured Data Requirement Analysis Dashboard Snapshot For Email Marketing. The topics discussed in this slide are Requirement, Analysis, Dashboard. This is an instantly available PowerPoint presentation that can be edited conveniently. Download it right away and captivate your audience.
-
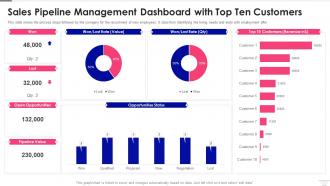 Sales Pipeline Management Pipeline Management Dashboard With Top Ten Customers
This slide shows the process steps followed by the company for the recruitment of new employees. It stars from Identifying the hiring needs and ends with employment offer Deliver an outstanding presentation on the topic using this Sales Pipeline Management Pipeline Management Dashboard With Top Ten Customers. Dispense information and present a thorough explanation of Pipeline, Management, Dashboard using the slides given. This template can be altered and personalized to fit your needs. It is also available for immediate download. So grab it now.
-
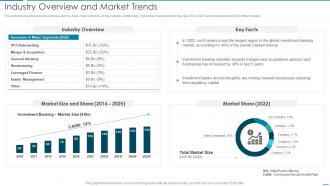 Industry Overview And Market Trends Pitchbook For Investment Bank Underwriting Deal
The slide provides the industry overview and key facts market trends of the industry. Additionally, it provides market size for the year 2014 to 2023 and market share 2019 of the industry.Present the topic in a bit more detail with this Industry Overview And Market Trends Pitchbook For Investment Bank Underwriting Deal Use it as a tool for discussion and navigation on Industry Overview, Investment Banking , Towards Businesses This template is free to edit as deemed fit for your organization. Therefore download it now.
-
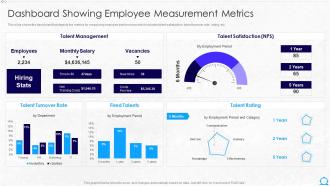 Dashboard Showing Employee Measurement Metrics Hr Robotic Process Automation
This slide shows the dashboard that depicts the metrics for measuring employee performance which includes talent satisfaction, talent turnover rate, rating, etc. Deliver an outstanding presentation on the topic using this Dashboard Showing Employee Measurement Metrics Hr Robotic Process Automation. Dispense information and present a thorough explanation of Measurement, Dashboard, Measuring using the slides given. This template can be altered and personalized to fit your needs. It is also available for immediate download. So grab it now.
-
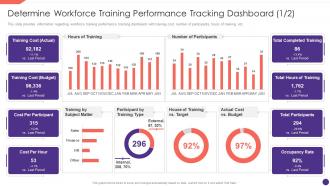 F330 Determine Workforce Training Performance Tracking Dashboard Employee Upskilling Playbook
This slide provides information regarding workforce training performance tracking dashboard with training cost, number of participants, hours of training, etc. Deliver an outstanding presentation on the topic using this F330 Determine Workforce Training Performance Tracking Dashboard Employee Upskilling Playbook. Dispense information and present a thorough explanation of Performance, Dashboard, Information using the slides given. This template can be altered and personalized to fit your needs. It is also available for immediate download. So grab it now.
-
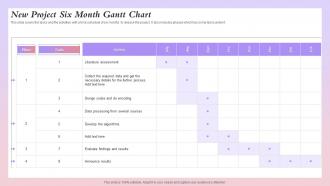 New Project Six Month Gantt Chart
This slide covers the tasks and the activities with a time schedule of six months to release the project. It also includes phases which has some tasks under it. Introducing our New Project Six Month Gantt Chart that is designed to showcase some of the vital components that will help you create timelines, roadmaps, and project plans. In addition, also communicate your project durations, milestones, tasks, subtasks, dependencies, and other attributes using this well-structured New Project Six Month Gantt Chart template. You can also exhibit preeminence against time by deploying this easily adaptable slide to your business presentation. Our experts have designed this template in such a way that it is sure to impress your audience. Thus, download it and steer your project meetings, meetups, and conferences.


