Charts, Graphs PowerPoint Designs, Presentation Charts Designs & PPT Graphics
- Sub Categories
-
- Arrows and Targets
- Bullet and Text Slides
- Charts and Graphs
- Circular Cycle Diagrams
- Concepts and Shapes
- Custom Flat Designs
- Dashboards and Measuring
- Flow Process
- Funnels
- Gears
- Growth
- Harvey Balls
- Idea Innovation and Light Bulbs
- Leadership
- Linear Process Diagrams
- Magnifying Glass
- Misc Other Graphics
- Opportunity and Handshake
- Organization Charts
- Puzzles
- Pyramids
- Roadmaps and Timelines
- Silhouettes
- Steps
- Strategic Planning Analysis
- SWOT Analysis
- Tables and Matrix
- Teamwork
- Technology and Communication
- Venn Diagrams
- Visuals and Illustrations
-
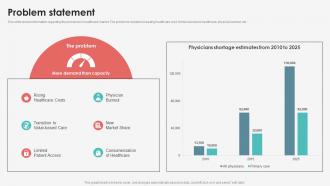 Problem Statement Digital Healthcare Company Fundraising
This slide shows information regarding the problems in healthcare market. The problems include increasing healthcare cost, limited access to healthcare, physical burnout, etc. Deliver an outstanding presentation on the topic using this Problem Statement Digital Healthcare Company Fundraising. Dispense information and present a thorough explanation of Healthcare, Physician, Market, Access, Consumerization using the slides given. This template can be altered and personalized to fit your needs. It is also available for immediate download. So grab it now.
-
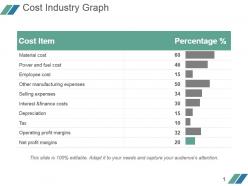 Cost industry graph powerpoint slide background image
Presenting cost industry graph powerpoint slide background image. This is a cost industry graph powerpoint slide background image. This is a ten stage process. The stages in this process are cost item, material cost, power and fuel cost, employee cost, other manufacturing expenses, selling expenses, interest and finance costs, depreciation, tax, operating profit margins, net profit margins, percentage.
-
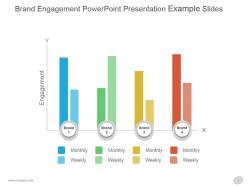 Brand engagement powerpoint presentation example slides
Presenting brand engagement powerpoint presentation example slides. This is a brand engagement powerpoint presentation example slides. This is a four stage process. The stages in this process are engagement, monthly, weekly, brand.
-
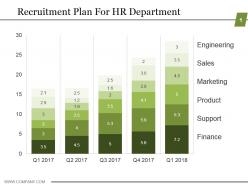 Recruitment plan for hr department ppt examples
Presenting recruitment plan for hr department ppt examples. This is a recruitment plan for hr department ppt examples. This is a five stage process. The stages in this process are engineering, sales, marketing, product, support, finance.
-
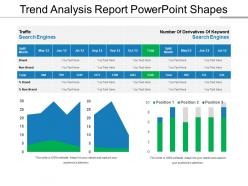 Trend analysis report powerpoint shapes
Presenting Trend Analysis Report PowerPoint Shapes. Customize the slide as per your wants. You are free to change anything in the slide. Modify the colors, background, font type, and font size. It can be transformed and saved in various formats like JPG, PNG, PDF, and JPEG. The slide goes well with the Google Slides and major Microsoft versions. It can be viewed on standard screen size and widescreen size as well.
-
 Start stop colored icons with grey base
Presenting this set of slides with name - Start Stop Colored Icons With Grey Base. This is a two stage process. The stages in this process are Start Stop, On Off, Start Pause.
-
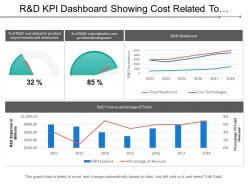 R and d kpi dashboard showing cost related to product improvements and extensions
Presenting this set of slides with name - R And D Kpi Dashboard Showing Cost Related To Product Improvements And Extensions. This is a four stage process. The stages in this process are R And D, Research And Development, Research And Technological Development.
-
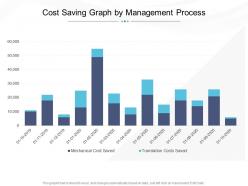 Cost saving graph by management process
Presenting this set of slides with name Cost Saving Graph By Management Process. The topics discussed in these slide is Cost Saving Graph By Management Process. This is a completely editable PowerPoint presentation and is available for immediate download. Download now and impress your audience.
-
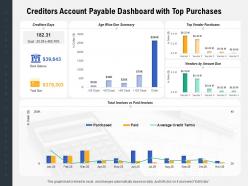 Creditors account payable dashboard with top purchases
Presenting this set of slides with name Creditors Account Payable Dashboard With Top Purchases. The topics discussed in these slides are Dollar, Paid Invoices, Gola. This is a completely editable PowerPoint presentation and is available for immediate download. Download now and impress your audience.
-
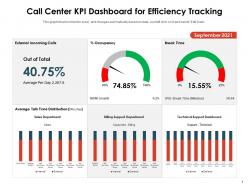 Call center kpi dashboard for efficiency tracking
Introducing our Call Center KPI Dashboard For Efficiency Tracking set of slides. The topics discussed in these slides are Call Center KPI Dashboard For Efficiency Tracking. This is an immediately available PowerPoint presentation that can be conveniently customized. Download it and convince your audience.
-
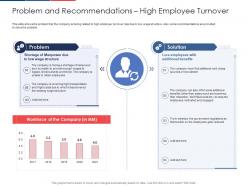 Problem and recommendations high employee turnover benefits ppt infographics show
Present the topic in a bit more detail with this Problem And Recommendations High Employee Turnover Benefits Ppt Infographics Show. Use it as a tool for discussion and navigation on Problem And Recommendations High Employee Turnover. This template is free to edit as deemed fit for your organization. Therefore download it now.
-
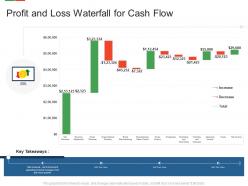 Profit and loss waterfall for cash flow
Introducing our Profit And Loss Waterfall For Cash Flow set of slides. The topics discussed in these slides are Profit And Loss Waterfall For Cash Flow. This is an immediately available PowerPoint presentation that can be conveniently customized. Download it and convince your audience.
-
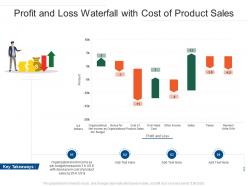 Profit and loss waterfall with cost of product sales
Introducing our Profit And Loss Waterfall With Cost Of Product Sales set of slides. The topics discussed in these slides are Budget, Organizational, Sales. This is an immediately available PowerPoint presentation that can be conveniently customized. Download it and convince your audience.
-
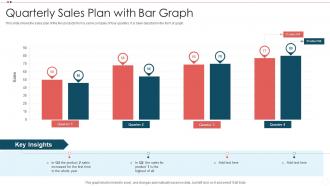 Quarterly Sales Plan With Bar Graph
This slide shows the sales plan of the two products from a same company of four quarters. It is been depicted in the form of graph. Introducing our Quarterly Sales Plan With Bar Graph set of slides. The topics discussed in these slides are Quarterly Sales Plan With Bar Graph. This is an immediately available PowerPoint presentation that can be conveniently customized. Download it and convince your audience.
-
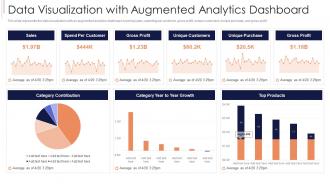 Data Visualization With Augmented Analytics Dashboard Snapshot Ppt Infographics
This slide represents the data visualization with an augmented analytics dashboard covering sales, spending per customer, gross profit, unique customers, unique purchase, and gross profit. Present the topic in a bit more detail with this Data Visualization With Augmented Analytics Dashboard Snapshot Ppt Infographics. Use it as a tool for discussion and navigation on Data Visualization With Augmented Analytics Dashboard. This template is free to edit as deemed fit for your organization. Therefore download it now.
-
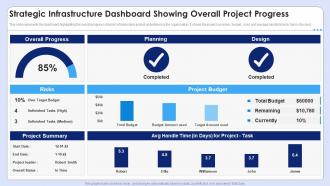 Strategic Infrastructure Dashboard Showing Overall Project Progress
This slide represents the dashboard highlighting the overall progress of public infrastructure project undertaken by the organisation. It shows the project summary, budget , risks and average handle time for tasks of project. Introducing our Strategic Infrastructure Dashboard Showing Overall Project Progress set of slides. The topics discussed in these slides are Overall Progress, Planning, Design, Project Budget, Project Summary, Risks. This is an immediately available PowerPoint presentation that can be conveniently customized. Download it and convince your audience.
-
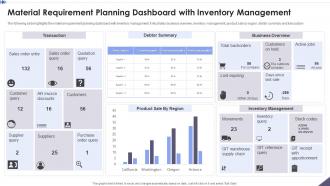 Material Requirement Planning Dashboard With Inventory Management
The following slide highlights the material requirement planning dashboard with inventory management, It illustrates business overview, inventory management, product sale by region, debtor summary and transaction. Presenting our well structured Material Requirement Planning Dashboard With Inventory Management. The topics discussed in this slide are Transaction, Debtor Summary, Business Overview. This is an instantly available PowerPoint presentation that can be edited conveniently. Download it right away and captivate your audience.
-
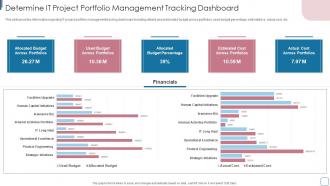 Determine IT Project Portfolio Management Tracking Dashboard Improvise Technology Spending
This slide provides information regarding IT project portfolio management tracking dashboard including details about allocated budget across portfolios, used budget percentage, estimated vs. actual cost, etc. Present the topic in a bit more detail with this Determine IT Project Portfolio Management Tracking Dashboard Improvise Technology Spending. Use it as a tool for discussion and navigation on Allocated Budget Across Portfolios, Used Budget Across Portfolios. This template is free to edit as deemed fit for your organization. Therefore download it now
-
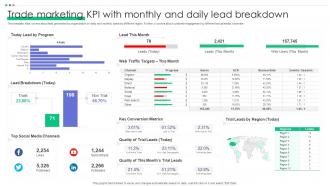 Trade Marketing KPI With Monthly And Daily Lead Breakdown
This template slide covers about lead generated by organization on daily and monthly basis by different region. Further, it covers about customer engagement by different social media channels. Presenting our well structured Trade Marketing KPI With Monthly And Daily Lead Breakdown. The topics discussed in this slide are Today Lead By Program, Lead This Month, Lead Breakdown. This is an instantly available PowerPoint presentation that can be edited conveniently. Download it right away and captivate your audience.
-
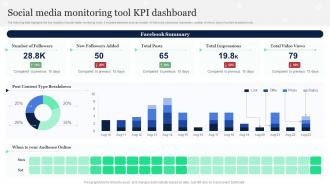 Social Media Monitoring Tool KPI Dashboard
The following slide highlights the key insights of social media monitoring tools. It includes elements such as number of followers, total posts, impression, number of views, type of content breakdown etc. Introducing our Social Media Monitoring Tool KPI Dashboard set of slides. The topics discussed in these slides are Social Media Monitoring, Tool, KPI Dashboard. This is an immediately available PowerPoint presentation that can be conveniently customized. Download it and convince your audience.
-
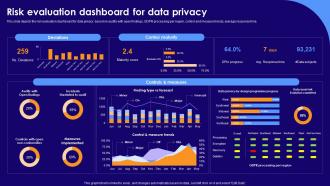 Risk Evaluation Dashboard For Data Privacy Ppt Powerpoint Presentation Slides Background
This slide depicts the risk evaluation dashboard for data privacy based on audits with open findings, GDPR processing per region, control and measure trends, average response time. Present the topic in a bit more detail with this Risk Evaluation Dashboard For Data Privacy Ppt Powerpoint Presentation Slides Background. Use it as a tool for discussion and navigation on Control Maturity, Controls And Measures. This template is free to edit as deemed fit for your organization. Therefore download it now.
-
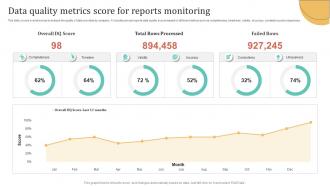 Data Quality Metrics Score For Reports Monitoring
This slide covers overall scores to analyse the quality of data provided by company. It includes annual reports data quality scores based on different metrics such as completeness, timeliness, validity, accuracy, consistency and uniqueness. Presenting our well structured Data Quality Metrics Score For Reports Monitoring. The topics discussed in this slide are Completeness, Timeliness, Uniqueness. This is an instantly available PowerPoint presentation that can be edited conveniently. Download it right away and captivate your audience.
-
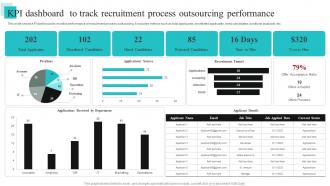 Kpi Dashboard To Track Recruitment Process Outsourcing Performance
This slide shows KPI dashboard to monitor performance of recruitment process outsourcing. It includes metrics such as total applicants, shortlisted applicants, hired candidates, positions available, etc. Presenting our well structured Kpi Dashboard To Track Recruitment Process Outsourcing Performance. The topics discussed in this slide are Analytics, Positions, Accounts. This is an instantly available PowerPoint presentation that can be edited conveniently. Download it right away and captivate your audience.
-
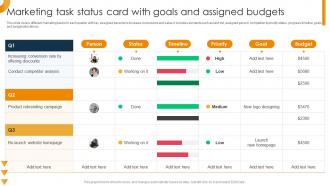 Marketing Task Status Card With Goals And Assigned Budgets
This slide covers different marketing tasks for each quarter with key assigned persons to increase conversions and sales. It includes elements such as task list, assigned person, completion and priority status, progress timeline, goals and budget allocations. Presenting our well structured Marketing Task Status Card With Goals And Assigned Budgets. The topics discussed in this slide are Marketing Task, Card With Goals, Assigned Budgets. This is an instantly available PowerPoint presentation that can be edited conveniently. Download it right away and captivate your audience.
-
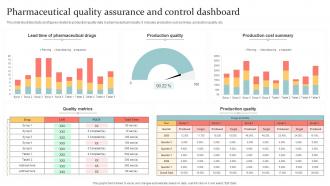 Pharmaceutical Quality Assurance And Control Dashboard
This slide illustrates facts and figures related to production quality data in pharmaceutical industry. It includes production cost summary, production quality, etc. Introducing our Pharmaceutical Quality Assurance And Control Dashboard set of slides. The topics discussed in these slides are Lead Time, Pharmaceutical Drugs, Production Quality. This is an immediately available PowerPoint presentation that can be conveniently customized. Download it and convince your audience.
-
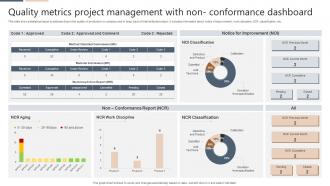 Quality Metrics Project Management With Non- Conformance Dashboard
This slide shows statistical report to address drop in the quality of products in a company and to keep track of total defected output. It includes information about notice of improvement, work discipline, NCR classification, etc. Presenting our well structured Quality Metrics Project Management With Non- Conformance Dashboard. The topics discussed in this slide are Notice For Improvement, Non Conformance Report. This is an instantly available PowerPoint presentation that can be edited conveniently. Download it right away and captivate your audience.
-
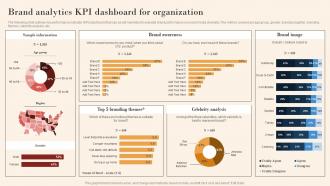 Brand Analytics KPI Dashboard For Organization Mkt Ss V
The following slide outlines key performance indicator KPI dashboard that can assist marketers to evaluate brand performance on social media channels. The metrics covered are age group, gender, brand perception, branding themes, celebrity analysis, etc. Present the topic in a bit more detail with this Brand Analytics KPI Dashboard For Organization Mkt Ss V. Use it as a tool for discussion and navigation on Sample Information, Brand Awareness. This template is free to edit as deemed fit for your organization. Therefore download it now.
-
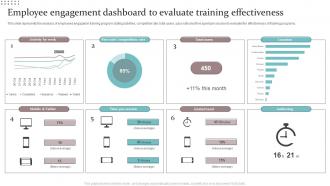 Employee Engagement Dashboard To Evaluate Training Effectiveness
This slide represents the analysis of employees engaged in training program stating activities, completion rate, total users, pass rate and time spent per session to evaluate the effectiveness of training programs. Introducing our Employee Engagement Dashboard To Evaluate Training Effectiveness set of slides. The topics discussed in these slides are Activity By Week, Location, Mobile And Tablet, Global Trend. This is an immediately available PowerPoint presentation that can be conveniently customized. Download it and convince your audience.
-
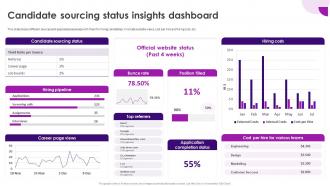 Recruitment And Selection Process Candidate Sourcing Status Insights Dashboard
This slide shows different sources and associated expenses with them for hiring candidates. It include website views, cost per hire and hiring cost, etc. Deliver an outstanding presentation on the topic using this Recruitment And Selection Process Candidate Sourcing Status Insights Dashboard. Dispense information and present a thorough explanation of Candidate Sourcing Status, Dashboard, Hiring Candidates, Sources And Associated Expenses using the slides given. This template can be altered and personalized to fit your needs. It is also available for immediate download. So grab it now.
-
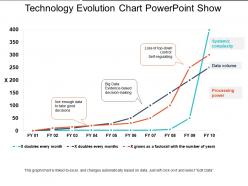 Technology evolution chart powerpoint show
Introducing technology evolution chart PowerPoint slide. Informational PPT structure altogether valuable for IT experts, IT managers and other IT professionals, business specialists, and more. Advantageous PPT Image which offers a scope to add the organization name, structure, or symbol or logo. Consonant with all other accessible software applications and Google Slides. Highlights such as the image, style, text, font, color and more. are also 100% editable.
-
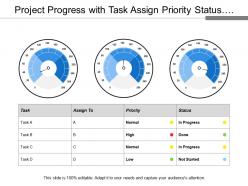 Project progress with task assign priority status and meter with different rating
Presenting this set of slides with name - Project Progress With Task Assign Priority Status And Meter With Different Rating. This is a three stage process. The stages in this process are Project Progress, Project Growth, Project Management.
-
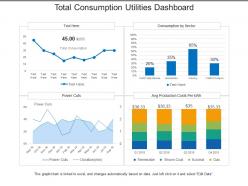 Total consumption utilities dashboard
Presenting this set of slides with name - Total Consumption Utilities Dashboard. This is a four stage process. The stages in this process are Utilities, Use, Advantage.
-
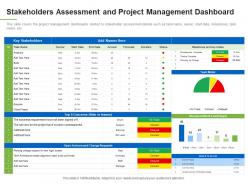 Stakeholders project management dashboard understanding overview stakeholder assessment ppt layout
This slide covers the project management dashboards related to stakeholder assessment details such as task name, owner, start date, milestones, task meter, etc. Deliver an outstanding presentation on the topic using this Stakeholders Project Management Dashboard Understanding Overview Stakeholder Assessment Ppt Layout. Dispense information and present a thorough explanation of Key Stakeholders, Business Requirement, Resource Work Load using the slides given. This template can be altered and personalized to fit your needs. It is also available for immediate download. So grab it now.
-
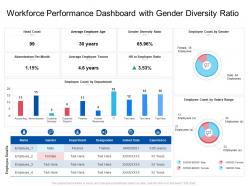 Workforce performance dashboard with gender diversity ratio
Presenting our well structured Workforce Performance Dashboard With Gender Diversity Ratio. The topics discussed in this slide are Average Employee, Salary Range, Employee Ratio. This is an instantly available PowerPoint presentation that can be edited conveniently. Download it right away and captivate your audience.
-
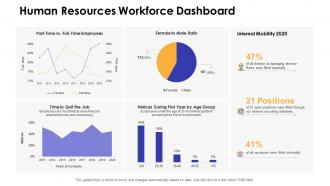 Dashboards by function human resources workforce dashboard
Deliver an outstanding presentation on the topic using this Dashboards By Function Human Resources Workforce Dashboard. Dispense information and present a thorough explanation of Human Resources Workforce Dashboard using the slides given. This template can be altered and personalized to fit your needs. It is also available for immediate download. So grab it now.
-
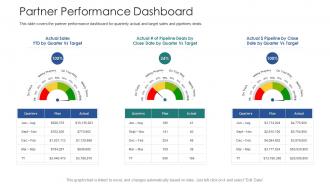 Vendor channel partner training partner performance dashboard
This slide covers the partner performance dashboard for quarterly actual and target sales and pipelines deals. Deliver an outstanding presentation on the topic using this Vendor Channel Partner Training Partner Performance Dashboard. Dispense information and present a thorough explanation of Target, Plan using the slides given. This template can be altered and personalized to fit your needs. It is also available for immediate download. So grab it now.
-
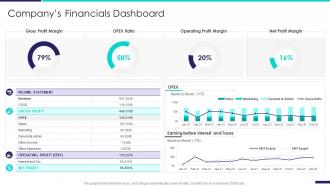 Company profile information technology companys financials dashboard snapshot
This graph or chart is linked to excel, and changes automatically based on data. Just left click on it and select Edit Data. Present the topic in a bit more detail with this Company Profile Information Technology Companys Financials Dashboard snapshot. Use it as a tool for discussion and navigation on Gross Profit Margin, OPEX Ratio, Operating Profit Margin, Net Profit Margin. This template is free to edit as deemed fit for your organization. Therefore download it now.
-
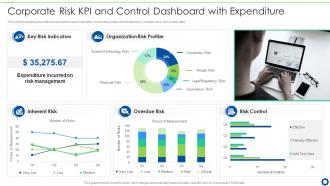 Corporate Risk KPI And Control Dashboard Snapshot With Expenditure
This slide illustrates corporate risk key performance indicators. It includes graphs of inherent risks, overdue risks, risk control data. Introducing our Corporate Risk KPI And Control Dashboard Snapshot With Expenditure set of slides. The topics discussed in these slides are Key Risk Indicators, Organization Risk Profiler, Overdue Risk, Risk Control, Inherent Risk. This is an immediately available PowerPoint presentation that can be conveniently customized. Download it and convince your audience.
-
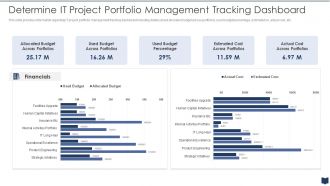 It Project Portfolio Management Tracking Dashboard Cios Cost Optimization Playbook
This slide provides information regarding IT project portfolio management tracking dashboard including details about allocated budget across portfolios, used budget percentage, estimated vs. actual cost, etc. Deliver an outstanding presentation on the topic using this It Project Portfolio Management Tracking Dashboard Cios Cost Optimization Playbook. Dispense information and present a thorough explanation of Portfolio, Management, Dashboard using the slides given. This template can be altered and personalized to fit your needs. It is also available for immediate download. So grab it now.
-
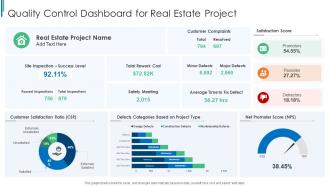 Quality Control Dashboard Snapshot For Real Estate Project
This graph or chart is linked to excel, and changes automatically based on data. Just left click on it and select edit data. Introducing our Quality Control Dashboard Snapshot For Real Estate Project set of slides. The topics discussed in these slides are Customer Complaints, Satisfaction Score, Total Rework Cost, Passed Inspections. This is an immediately available PowerPoint presentation that can be conveniently customized. Download it and convince your audience.
-
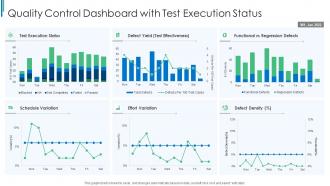 Quality Control Dashboard Snapshot With Test Execution Status
This graph or chart is linked to excel, and changes automatically based on data. Just left click on it and select edit data. Presenting our well structured Quality Control Dashboard Snapshot With Test Execution Status. The topics discussed in this slide are Test Execution Status, Functional vs Regression Defects, Effort Variation, Schedule Variation. This is an instantly available PowerPoint presentation that can be edited conveniently. Download it right away and captivate your audience.
-
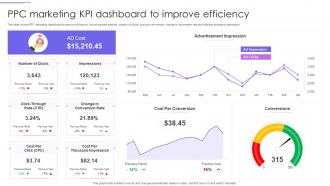 PPC Marketing KPI Dashboard To Improve Efficiency
This slide covers PPC marketing dashboard to improve efficiency. It involves total spends, number of clicks, cost per conversion, change in conversion rate and cost per thousand impression. Presenting our well structured PPC Marketing KPI Dashboard To Improve Efficiency. The topics discussed in this slide are Advertisement Impression, Cost Per Thousand, Cost Per Click. This is an instantly available PowerPoint presentation that can be edited conveniently. Download it right away and captivate your audience.
-
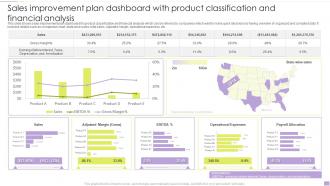 Sales Improvement Plan Dashboard With Product Classification And Financial Analysis
This slide shows sales improvement plan dashboard for product classification and financial analysis which can be referred by companies which want to make quick decisions by having overview of organized and compiled data. It includes details such as comparison chart, state wise sales, total sales, adjusted margin, operational expenses, etc.. Introducing our Sales Improvement Plan Dashboard With Product Classification And Financial Analysis set of slides. The topics discussed in these slides are Sales Improvement Plan, Dashboard, Product Classification, Financial Analysis. This is an immediately available PowerPoint presentation that can be conveniently customized. Download it and convince your audience.
-
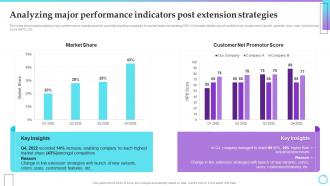 Analyzing Major Performance Indicators Post Brand Extension Strategy Implementation For Gainin
This slide showcases analyzing major performance indicators which can help branding managers to assess extension strategy KPIs. It provides details about market share, product line, launch, variants, color, size, net promotor score NPS, etc. Deliver an outstanding presentation on the topic using this Analyzing Major Performance Indicators Post Brand Extension Strategy Implementation For Gainin. Dispense information and present a thorough explanation of Market Share, Customer, Net Promotor Score, Key Insights using the slides given. This template can be altered and personalized to fit your needs. It is also available for immediate download. So grab it now.
-
 Cloud Kitchen And Dine In Restaurant Sales Comparison Global Cloud Kitchen Platform Market Analysis
The following slide highlights comparison of cloud kitchen and dine in restaurants based on gross food sales of previous years. It presents yearly sales growth of cloud kitchen and direct restaurant. Deliver an outstanding presentation on the topic using this Cloud Kitchen And Dine In Restaurant Sales Comparison Global Cloud Kitchen Platform Market Analysis. Dispense information and present a thorough explanation of Sales, Market using the slides given. This template can be altered and personalized to fit your needs. It is also available for immediate download. So grab it now.
-
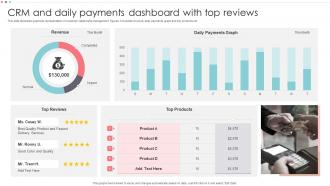 CRM And Daily Payments Dashboard With Top Reviews
This slide illustrates graphical representation of customer relationship management figures. It includes revenue, daily payments graph and top products etc. Introducing our CRM And Daily Payments Dashboard With Top Reviews set of slides. The topics discussed in these slides are Revenue, Top Products. This is an immediately available PowerPoint presentation that can be conveniently customized. Download it and convince your audience.
-
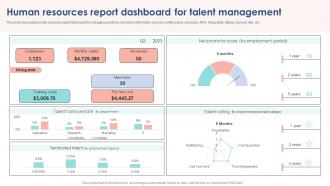 Human Resources Report Dashboard For Talent Management
This slide showcases human resources report dashboard for managing workforce. It provides information such as monthly salary, vacancies, NPS, hiring stats, ratings, turnover rate, etc. Introducing our Human Resources Report Dashboard For Talent Management set of slides. The topics discussed in these slides are Employees, Monthly Salary, Vacancies, Training Costs. This is an immediately available PowerPoint presentation that can be conveniently customized. Download it and convince your audience.
-
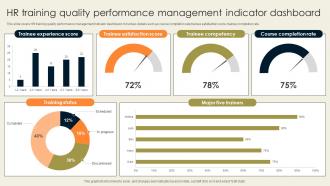 HR Training Quality Performance Management Indicator Dashboard
This slide covers HR training quality performance management indicator dashboard. It involves details such as course completion rate, trainee satisfaction score, trainee completion rate. Introducing our HR Training Quality Performance Management Indicator Dashboard set of slides. The topics discussed in these slides are Trainee Competency, Training Status, Major Five Trainers. This is an immediately available PowerPoint presentation that can be conveniently customized. Download it and convince your audience.
-
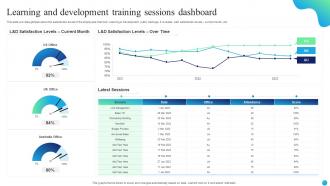 Learning And Development Training Sessions Dashboard
This slide provides glimpse about the satisfaction levels of the employees that took Learning Development L and D trainings. It includes L and D satisfaction levels current month, etc.Introducing our Learning And Development Training Sessions Dashboard set of slides. The topics discussed in these slides are Latest Sessions, Satisfaction Levels, Current Month. This is an immediately available PowerPoint presentation that can be conveniently customized. Download it and convince your audience.
-
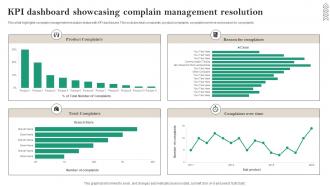 KPI Dashboard Showcasing Complain Management Resolution
This slide highlights complain management resolution status with KPI dashboard. This includes total complaints, product complaints, complaint over time and reason for complaints. Introducing our KPI Dashboard Showcasing Complain Management Resolution set of slides. The topics discussed in these slides are Product Complaints, Reason For Complaints, Total Complaints. This is an immediately available PowerPoint presentation that can be conveniently customized. Download it and convince your audience.
-
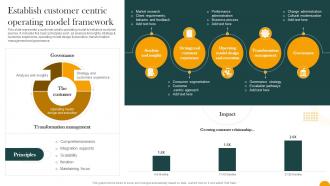 Establish Customer Centric Operating Model Framework How Digital Transformation DT SS
This slide represents a customer centric operating model to enhance customer journey. It includes five basic principles such as analysis and insights, strategy and customer experience, operating model design and execution, transformation management and governance. Present the topic in a bit more detail with this Establish Customer Centric Operating Model Framework How Digital Transformation DT SS. Use it as a tool for discussion and navigation on Analysis And Insights, Customer Experience, Operating Model. This template is free to edit as deemed fit for your organization. Therefore download it now.
-
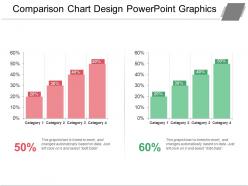 Comparison chart design powerpoint graphics
Presenting comparison chart design PowerPoint graphics PPT slide. The bar chart diagram slide specially designed by SlideTeam for professionals for sharing the required strategies for project or process. The chart design slide is 100% editable in PowerPoint and gets synced with Google Slides. A user can easily edit the font type, font size, color & size of bar graph and aspect ratios of this template, without affecting template's quality. The text placeholder is editable and you can edit as per your preference.
-
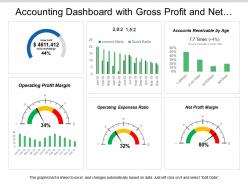 Accounting dashboard with gross profit and net profit margin
Introducing accounting dashboard with gross profit and net profit margin PPT slideshow. Loaded with incomparable benefits. Readymade PPT graphic helps in saving time and effort. Can be personalized by adding company trademark, logo, brand and symbols. Can be utilized for displaying both simple and complex information. Include or exclude slide content as per your individual need. Colors and text can be easily changed as the PPT slide is completely editable. Useful for every business leader and professional, project management team, business analysts, etc.
-
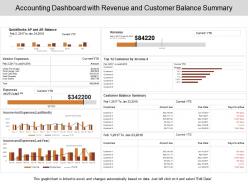 Accounting dashboard with revenue and customer balance summary
Pre-designed accounting dashboard with revenue and customer balance summary PPT template. High-resolution PowerPoint presentation backgrounds for better clarity of the information displayed. Offers wide variety of options and colors to alter the appearance. Allows adding of enterprise personal details such as brand name, logo and much more. Enough space available to enter text and its related points in the PPT slide. This slide is available in both Standard and Widescreen slide size. Compatible with multiple formats like JPEG, PDF and Google slides.
-
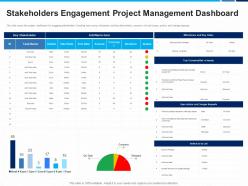 Stakeholders engagement project management dashboard risk status ppt designs
This slide covers the project dashboard for engaging stakeholders including task name, milestones and key deliverables, concerns risk and issues, actions and change requests Deliver an outstanding presentation on the topic using this Stakeholders Engagement Project Management Dashboard Risk Status Ppt Designs. Dispense information and present a thorough explanation of Stakeholders Engagement Project Management Dashboard using the slides given. This template can be altered and personalized to fit your needs. It is also available for immediate download. So grab it now.
-
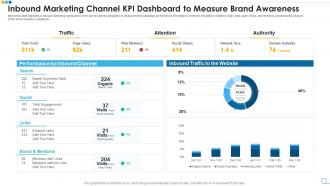 Inbound marketing channel kpi dashboard to measure brand awareness
Presenting our well structured Inbound Marketing Channel KPI Dashboard To Measure Brand Awareness. The topics discussed in this slide are Inbound Marketing Channel KPI Dashboard To Measure Brand Awareness. This is an instantly available PowerPoint presentation that can be edited conveniently. Download it right away and captivate your audience.
-
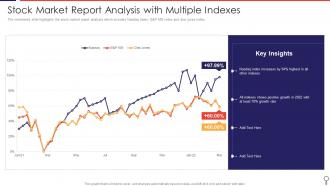 Stock Market Report Analysis With Multiple Indexes
The mentioned slide highlights the stock market report analysis which includes Nasdaq index, S and P 500 index and dow jones index. Introducing our Stock Market Report Analysis With Multiple Indexes set of slides. The topics discussed in these slides are Stock Market Report Analysis With Multiple Indexes. This is an immediately available PowerPoint presentation that can be conveniently customized. Download it and convince your audience.
-
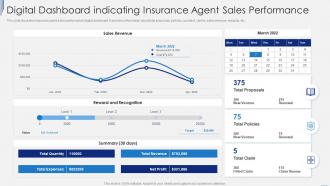 Digital Dashboard Indicating Insurance Agent Sales Performance
This slide illustrates insurance agent sales performance digital dashboard. It provides information about total proposals, policies, accident, claims, sales revenue, rewards, etc. Introducing our Digital Dashboard Indicating Insurance Agent Sales Performance set of slides. The topics discussed in these slides are Sales Revenue, Reward And Recognition, Expenses. This is an immediately available PowerPoint presentation that can be conveniently customized. Download it and convince your audience.
-
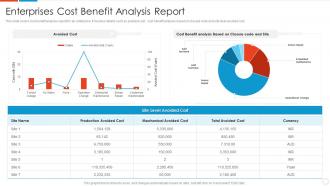 Enterprises Cost Benefit Analysis Report
This slide covers cost benefit analysis report for an enterprise. It involves details such as avoided cost , cost benefit analysis based on closure code and site level avoided cost. Presenting our well-structured Enterprises Cost Benefit Analysis Report. The topics discussed in this slide are Enterprises Cost Benefit Analysis Report. This is an instantly available PowerPoint presentation that can be edited conveniently. Download it right away and captivate your audience.
-
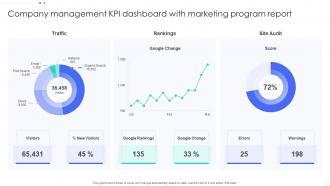 Company Management KPI Dashboard Snapshot With Marketing Program Report
This graph or chart is linked to excel, and changes automatically based on data. Just left click on it and select Edit Data. Introducing our Company Management KPI Dashboard Snapshot With Marketing Program Report set of slides. The topics discussed in these slides are Rankings, Site Audit, Traffic. This is an immediately available PowerPoint presentation that can be conveniently customized. Download it and convince your audience.


