Charts, Graphs PowerPoint Designs, Presentation Charts Designs & PPT Graphics
- Sub Categories
-
- Arrows and Targets
- Bullet and Text Slides
- Charts and Graphs
- Circular Cycle Diagrams
- Concepts and Shapes
- Custom Flat Designs
- Dashboards and Measuring
- Flow Process
- Funnels
- Gears
- Growth
- Harvey Balls
- Idea Innovation and Light Bulbs
- Leadership
- Linear Process Diagrams
- Magnifying Glass
- Misc Other Graphics
- Opportunity and Handshake
- Organization Charts
- Puzzles
- Pyramids
- Roadmaps and Timelines
- Silhouettes
- Steps
- Strategic Planning Analysis
- SWOT Analysis
- Tables and Matrix
- Teamwork
- Technology and Communication
- Venn Diagrams
- Visuals and Illustrations
-
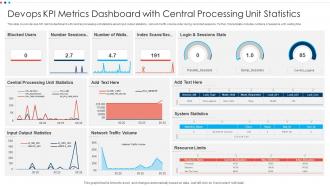 Devops KPI Metrics Dashboard With Central Processing Unit Statistics
This slide covers devops KPI metrics dashboard with central processing unit statistics about input output statistics , network traffic volume under during recorded sessions. Further, this template includes numbers of sessions with waiting time. Introducing our Devops KPI Metrics Dashboard With Central Processing Unit Statistics set of slides. The topics discussed in these slides are Devops KPI Metrics Dashboard with Central Processing Unit Statistics. This is an immediately available PowerPoint presentation that can be conveniently customized. Download it and convince your audience.
-
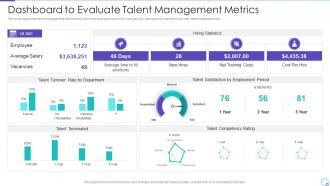 Talent Management System for Effective Hiring Process Dashboard to Evaluate Talent
This slide represents talent management dashboards. It includes average time to hire, cost per hire, training cost, talent turnover rate, talent satisfaction etc. Present the topic in a bit more detail with this Talent Management System for Effective Hiring Process Dashboard to Evaluate Talent. Use it as a tool for discussion and navigation on Dashboard To Evaluate Talent Management Metrics. This template is free to edit as deemed fit for your organization. Therefore download it now.
-
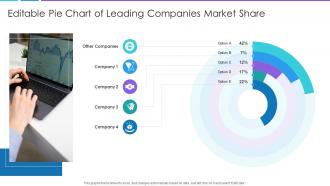 Editable Pie Chart Of Leading Companies Market Share
Presenting our well structured Editable Pie Chart Of Leading Companies Market Share. The topics discussed in this slide are Editable Pie Chart Of Leading Companies Market Share. This is an instantly available PowerPoint presentation that can be edited conveniently. Download it right away and captivate your audience.
-
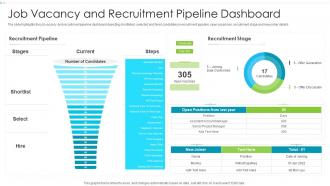 Job Vacancy And Recruitment Pipeline Dashboard
The slide highlights the job vacancy and recruitment pipeline dashboard depicting shortlisted, selected and hired candidates in recruitment pipeline, open vacancies, recruitment stage and new joiner details. Introducing our Job Vacancy And Recruitment Pipeline Dashboard set of slides. The topics discussed in these slides are Recruitment Stage, Recruitment Pipeline, Offer Discussion. This is an immediately available PowerPoint presentation that can be conveniently customized. Download it and convince your audience.
-
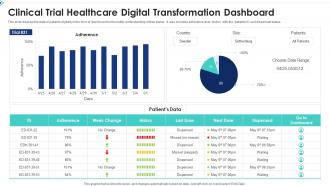 Clinical Trial Healthcare Digital Transformation Dashboard
This slide displays the data of patients digitally in the form of dashboard for the better understanding of their status. It also includes adherence level, history with the patients ID and dispensed status. Introducing our Clinical Trial Healthcare Digital Transformation Dashboard set of slides. The topics discussed in these slides are Clinical Trial Healthcare Digital Transformation Dashboard. This is an immediately available PowerPoint presentation that can be conveniently customized. Download it and convince your audience.
-
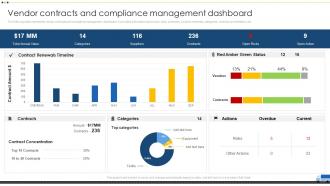 Vendor Contracts And Compliance Management Vendor Management For Effective Procurement
The following slide represents vendor contracts and compliance management dashboard. It provides information about open risks, contracts, contract renewals, categories, contract concentration, etc. Present the topic in a bit more detail with this Vendor Contracts And Compliance Management Vendor Management For Effective Procurement. Use it as a tool for discussion and navigation on Compliance, Management, Dashboard. This template is free to edit as deemed fit for your organization. Therefore download it now.
-
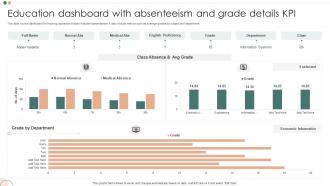 Education Dashboard With Absenteeism And Grade Details KPI
This slide covers dashboard for tracking causes and rates of student absenteeism. It also include metrics such as average grades by subject and department. Introducing our Education Dashboard With Absenteeism And Grade Details KPI set of slides. The topics discussed in these slides are Information Systems, Economic Informatics, Education Dashboard. This is an immediately available PowerPoint presentation that can be conveniently customized. Download it and convince your audience.
-
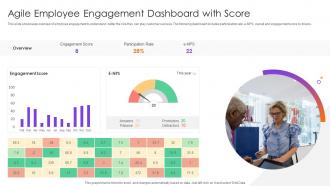 Agile Employee Engagement Dashboard With Score
This slide showcases overview of employee engagement to understand better the role they can play customer success. The following dashboard includes participation rate, e-NPS, overall and engagement score by drivers. Introducing our Agile Employee Engagement Dashboard With Score set of slides. The topics discussed in these slides are Engagement Score, Participation Rate, Engagement Score. This is an immediately available PowerPoint presentation that can be conveniently customized. Download it and convince your audience.
-
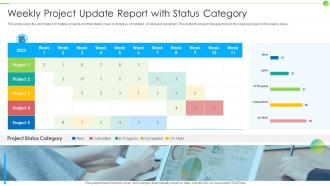 Weekly Project Update Report With Status Category
This slide covers the information of multiple projects and their status new, in progress, completed, on hold and cancelled. This helps the project manager to track the ongoing project on the weekly basis. Presenting our well structured Weekly Project Update Report With Status Category. The topics discussed in this slide are Project Status Category, In Progress, Completed. This is an instantly available PowerPoint presentation that can be edited conveniently. Download it right away and captivate your audience.
-
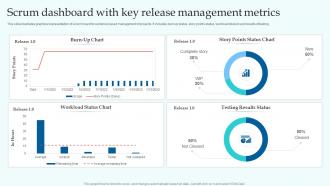 Scrum Dashboard With Key Release Management Metrics
This slide illustrates graphical representation of scrum board for evidence based management of projects. It includes burn up status, story points status, workload division and results of testing. Introducing our Scrum Dashboard With Key Release Management Metrics set of slides. The topics discussed in these slides are Testing Results Status, Workload Status Chart, Burn Up Chart. This is an immediately available PowerPoint presentation that can be conveniently customized. Download it and convince your audience.
-
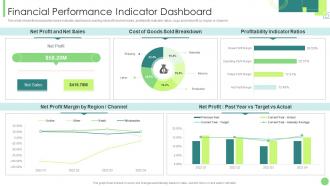 Financial Performance Indicator Dashboard Kpis To Assess Business Performance
This slide shows financial performance indicator dashboard covering net profit and net sales, profitability indicator ratios, cogs and net profit by region or channel. Present the topic in a bit more detail with this Financial Performance Indicator Dashboard Kpis To Assess Business Performance. Use it as a tool for discussion and navigation on Financial, Performance, Dashboard. This template is free to edit as deemed fit for your organization. Therefore download it now.
-
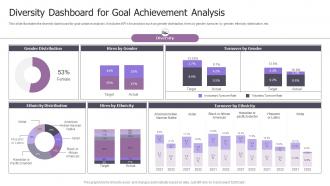 Diversity Dashboard For Goal Achievement Analysis
This slide illustrates the diversity dashboard for goal variance analysis. It includes KPIs for analysis such as gender distribution, hires by gender, turnover by gender, ethnicity distribution, etc. Introducing our Diversity Dashboard For Goal Achievement Analysis set of slides. The topics discussed in these slides are Dashboard, Achievement, Analysis. This is an immediately available PowerPoint presentation that can be conveniently customized. Download it and convince your audience.
-
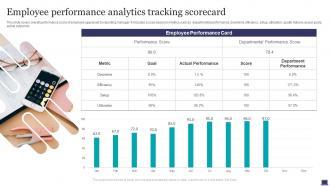 Employee Performance Analytics Tracking Scorecard
This slide covers overall performance score of employee appraised by reporting manager. It includes scores based on metrics such as departmental performance, downtime, efficiency, setup, utilization, quality failures as per goals, actual output etc. Introducing our Employee Performance Analytics Tracking Scorecard set of slides. The topics discussed in these slides are Employee Performance Analytics, Tracking Scorecard. This is an immediately available PowerPoint presentation that can be conveniently customized. Download it and convince your audience.
-
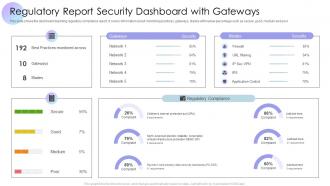 Regulatory Report Security Dashboard Snapshot With Gateways
This slide shows the dashboard depicting regulatory compliance report. It covers information about monitoring practices, gateways, blades with review percentage such as secure, good, medium and poor Introducing our Regulatory Report Security Dashboard Snapshot With Gateways set of slides. The topics discussed in these slides are Secure, Good, Medium, Poor. This is an immediately available PowerPoint presentation that can be conveniently customized. Download it and convince your audience.
-
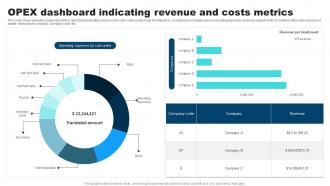 OPEX Dashboard Indicating Revenue And Costs Metrics
This slide shows operating expenses OPEX dashboard indicating revenue and costs metrics which can be referred by companies to manage various operating expenses of various departments. It contains information about cost center, revenue per company, company code, etc. Presenting our well-structured OPEX Dashboard Indicating Revenue And Costs Metrics. The topics discussed in this slide are OPEX Dashboard, Indicating Revenue, Costs Metrics. This is an instantly available PowerPoint presentation that can be edited conveniently. Download it right away and captivate your audience.
-
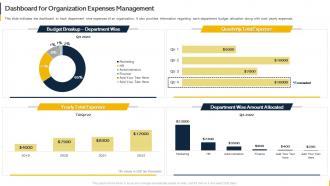 Dashboard For Organization Expenses Management Organization Budget Forecasting
This slide indicates the dashboard to track department wise expenses of an organization. It also provides information regarding each department budget allocation along with total yearly expenses. Present the topic in a bit more detail with this Dashboard For Organization Expenses Management Organization Budget Forecasting. Use it as a tool for discussion and navigation on Dashboard, Organization, Expenses Management. This template is free to edit as deemed fit for your organization. Therefore download it now.
-
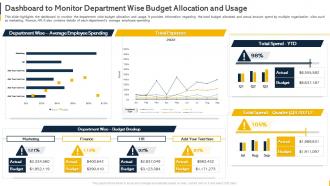 Dashboard To Monitor Department Wise Budget Allocation And Usage Organization Budget Forecasting
This slide highlights the dashboard to monitor the department wise budget allocation and usage. It provides information regarding the total budget allocated and actual amount spent by multiple organization silos such as marketing, finance, HR. It also contains details of each departments average employee spending. Deliver an outstanding presentation on the topic using this Dashboard To Monitor Department Wise Budget Allocation And Usage Organization Budget Forecasting. Dispense information and present a thorough explanation of Dashboard To Monitor, Department Wise Budget, Allocation And Usage using the slides given. This template can be altered and personalized to fit your needs. It is also available for immediate download. So grab it now.
-
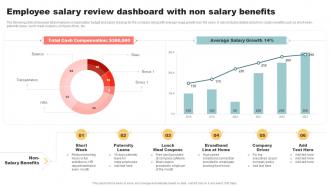 Employee Salary Review Dashboard With Non Salary Benefits
The following slide showcases total employee compensation budget and salary breakup for the company along with average wage growth over the years. It also includes details about non- salary benefits such as short week, paternity leave, lunch meal coupons, company driver, etc. Introducing our Employee Salary Review Dashboard With Non Salary Benefits set of slides. The topics discussed in these slides are Short Week, Broadband Line Home. This is an immediately available PowerPoint presentation that can be conveniently customized. Download it and convince your audience.
-
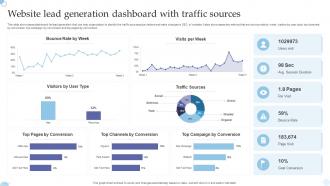 Website Lead Generation Dashboard With Traffic Sources
This slide showcases dashboard for lead generation that can help organziation to identify the traffic sources plus visitors and make changes in SEO of website. It also showcases key metrics that are bounce rate by week, visitors by user type, top channels by conversion, top campaign by conversion and top pages by conversion. Introducing our Website Lead Generation Dashboard With Traffic Sources set of slides. The topics discussed in these slides are Traffic Sources, Visits Per Week. This is an immediately available PowerPoint presentation that can be conveniently customized. Download it and convince your audience.
-
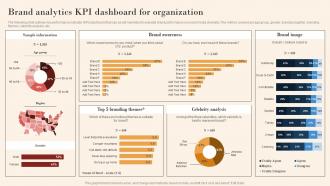 Brand Analytics KPI Dashboard For Organization Mkt Ss V
The following slide outlines key performance indicator KPI dashboard that can assist marketers to evaluate brand performance on social media channels. The metrics covered are age group, gender, brand perception, branding themes, celebrity analysis, etc. Present the topic in a bit more detail with this Brand Analytics KPI Dashboard For Organization Mkt Ss V. Use it as a tool for discussion and navigation on Sample Information, Brand Awareness. This template is free to edit as deemed fit for your organization. Therefore download it now.
-
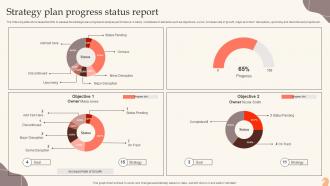 Strategy Plan Progress Status Report
The following slide showcases the KPIs to assess the strategic plan progress to analyse performance. It mainly constitutes of elements such as objectives, owner, increase rate of growth, major and minor disruptions, upcoming and discontinued projects etc. Introducing our Strategy Plan Progress Status Report set of slides. The topics discussed in these slides are Strategy Plan, Progress Status Report. This is an immediately available PowerPoint presentation that can be conveniently customized. Download it and convince your audience.
-
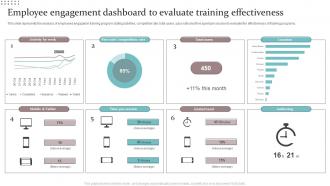 Employee Engagement Dashboard To Evaluate Training Effectiveness
This slide represents the analysis of employees engaged in training program stating activities, completion rate, total users, pass rate and time spent per session to evaluate the effectiveness of training programs. Introducing our Employee Engagement Dashboard To Evaluate Training Effectiveness set of slides. The topics discussed in these slides are Activity By Week, Location, Mobile And Tablet, Global Trend. This is an immediately available PowerPoint presentation that can be conveniently customized. Download it and convince your audience.
-
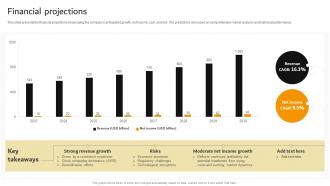 Financial Projections Amazon Business Model BMC SS
This slide presents the financial projections showcasing the companys anticipated growth, net income, cost, and risk. The predictions are based on comprehensive market analysis and historical performance. Present the topic in a bit more detail with this Financial Projections Amazon Business Model BMC SS Use it as a tool for discussion and navigation on Product Sourcing And Procurement, Fulfillment And Delivery, Marketing And Advertising This template is free to edit as deemed fit for your organization. Therefore download it now.
-
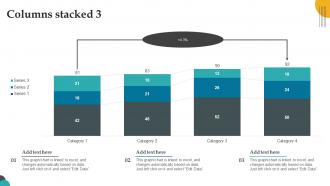 Columns Stacked 3 PU Chart SS
Introducing our Columns Stacked 3 PU Chart SS set of slides. The topics discussed in these slides are Columns Stacked 3. This is an immediately available PowerPoint presentation that can be conveniently customized. Download it and convince your audience.
-
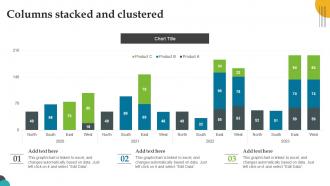 Columns Stacked And Clustered PU Chart SS
Presenting our well structured Columns Stacked And Clustered PU Chart SS. The topics discussed in this slide are Columns Stacked And Clustered. This is an instantly available PowerPoint presentation that can be edited conveniently. Download it right away and captivate your audience.
-
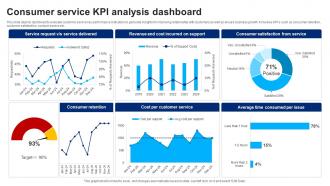 Consumer Service KPI Analysis Dashboard
This slide depicts dashboard to evaluate customer service key performance indicators to generate insights for improving relationship with customers as well as ensure business growth. It involves KPIs such as consumer retention, customer satisfaction, cost per service etc. Introducing our Consumer Service KPI Analysis Dashboard set of slides. The topics discussed in these slides are Customer, Average, Satisfaction. This is an immediately available PowerPoint presentation that can be conveniently customized. Download it and convince your audience.
-
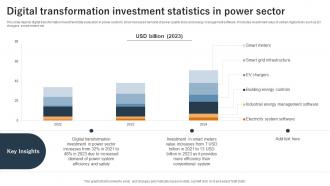 Digital Transformation Investment Statistics In Power Sector
This slide depicts digital transformation investment data evaluation in power sector to show increased demand of power quality tools and energy management software. It includes investment value of certain digital tools such as EV chargers, smart meters etc. Presenting our well structured Digital Transformation Investment Statistics In Power Sector. The topics discussed in this slide are Investment, System, Increases. This is an instantly available PowerPoint presentation that can be edited conveniently. Download it right away and captivate your audience.
-
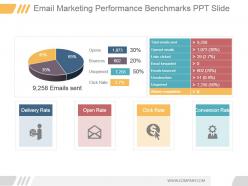 Email marketing performance benchmarks ppt slide
Presenting email marketing performance benchmarks ppt slide. This is a email marketing performance benchmarks ppt slide. This is a two stage process. The stages in this process are opens, bounces, unopened, click rate, emails sent, total emails sent, opened emails, links clicked, email forwarded, emails bounced, unsubscribes, unopened, abuse complaints, delivery rate, open rate, click rate, conversion rate.
-
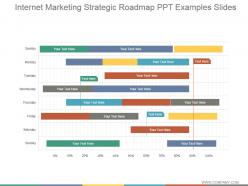 Internet marketing strategic roadmap ppt examples slides
Presenting internet marketing strategic roadmap ppt examples slides. This is a internet marketing strategic roadmap ppt examples slides. This is a seven stage process. The stages in this process are business, marketing, management, strategy, success.
-
 Price chart design powerpoint images
Presenting price chart design PowerPoint images which is 100% editable. This PPT slide is easy to customize and enables you to personalize it as per your own criteria. The presentation slide is fully compatible with Google slides, multiple format and software options. In case of any assistance, kindly take instructions from our presentation design services and it is easy to download in a very short span of time. The images, layouts, designs are of high quality and ensures quality in widescreen.
-
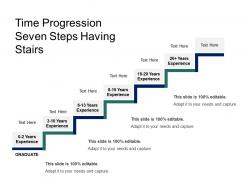 Time progression seven steps having stairs
Presenting this set of slides with name - Time Progression Seven Steps Having Stairs. This is a seven stage process. The stages in this process are Time Progression, Progress Bars.
-
 Customer lifetime value and total mrr sales dashboards
Presenting this set of slides with name - Customer Lifetime Value And Total Mrr Sales Dashboards. This is a three stage process. The stages in this process are Sales Dashboard, Sales Kpis, Sales Performance.
-
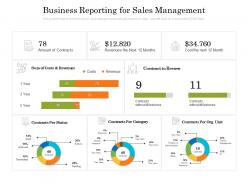 Business reporting for sales management
Presenting this set of slides with name Business Reporting For Sales Management. The topics discussed in these slides are Costs And Revenues, Contracts Per Status, Contracts Per Category. This is a completely editable PowerPoint presentation and is available for immediate download. Download now and impress your audience.
-
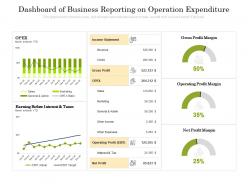 Dashboard Snapshot of business reporting on operation expenditure
Presenting this set of slides with name Dashboard Snapshot Of Business Reporting On Operation Expenditure. The topics discussed in these slides are Income Statement, Gross Profit, Sales, Marketing, OPEX. This is a completely editable PowerPoint presentation and is available for immediate download. Download now and impress your audience.
-
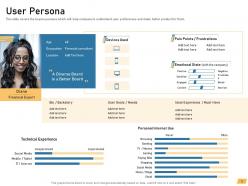 User persona requirement management planning ppt sample
This slide covers the buyers persona which will help company to understand user preferences and make better product for them. Present the topic in a bit more detail with this User Persona Requirement Management Planning Ppt Sample. Use it as a tool for discussion and navigation on emotional state, social media. This template is free to edit as deemed fit for your organization. Therefore download it now.
-
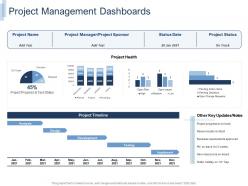 It project team building project management dashboards ppt powerpoint presentation slide
Present the topic in a bit more detail with this IT project Team Building Project Management Dashboards Ppt Powerpoint Presentation Slide. Use it as a tool for discussion and navigation on Analysis, Design, Development, Testing, Implement. This template is free to edit as deemed fit for your organization. Therefore download it now.
-
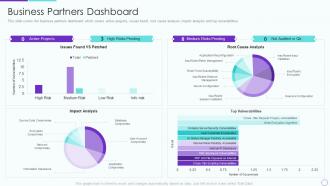 Business partners dashboard ppt slides guide partner relationship management prm
This slide covers the business partners dashboard which covers active projects, issues found, root cause analysis, impact analysis and top vulnerabilities. Deliver an outstanding presentation on the topic using this Business Partners Dashboard Ppt Slides Guide Partner Relationship Management PRM. Dispense information and present a thorough explanation of Active Projects, High Risks Pending, Medium Risks Pending, Not Audited In Qtr, Impact Analysis, Top Vulnerabilities using the slides given. This template can be altered and personalized to fit your needs. It is also available for immediate download. So grab it now.
-
 Cost benefits iot digital twins implementation healthcare dashboard showing analytical data
This slide shows the healthcare dashboard that presents analytical data such as occupancy, patient turnover, efficiency and costs, satisfaction and service indicators. Deliver an outstanding presentation on the topic using this Cost Benefits Iot Digital Twins Implementation Healthcare Dashboard Showing Analytical Data. Dispense information and present a thorough explanation of Healthcare Dashboard Showing Analytical Data using the slides given. This template can be altered and personalized to fit your needs. It is also available for immediate download. So grab it now.
-
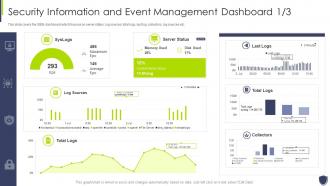 Security information event management dashboard improve security vulnerability management
This slide covers the SIEM dashboard which focuses on server status, log sources, total logs, last log, collectors, log sources etc. Deliver an outstanding presentation on the topic using this Security Information Event Management Dashboard Improve Security Vulnerability Management. Dispense information and present a thorough explanation of Management, Dashboard, Information using the slides given. This template can be altered and personalized to fit your needs. It is also available for immediate download. So grab it now.
-
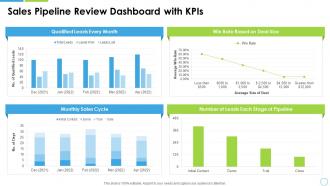 Sales pipeline review dashboard snapshot with kpis
Introducing our Sales Pipeline Review Dashboard Snapshot With KPIs set of slides. The topics discussed in these slides are Sales Pipeline Review Dashboard With KPIs. This is an immediately available PowerPoint presentation that can be conveniently customized. Download it and convince your audience.
-
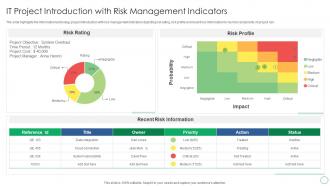 IT Project Introduction With Risk Management Indicators
The slide highlights the information technology project introduction with risk management indicators depicting risk rating, risk profile and recent risk information for number and priority of project risk. Introducing our IT Project Introduction With Risk Management Indicators set of slides. The topics discussed in these slides are Risk Rating, Probability, Risk Profile, Recent Risk Information. This is an immediately available PowerPoint presentation that can be conveniently customized. Download it and convince your audience.
-
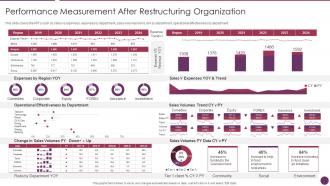 Company Reorganization Process Performance Measurement After Restructuring
This slide covers the KPIs such as sales vs expenses, expenses by department, sales volumes trend, risk by department, operational effectiveness by department Present the topic in a bit more detail with this Company Reorganization Process Performance Measurement After Restructuring Use it as a tool for discussion and navigation on Performance Measurement After Restructuring Organization This template is free to edit as deemed fit for your organization. Therefore download it now.
-
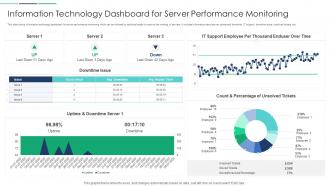 Information Technology Dashboard For Server Performance Monitoring
This slide shows information technology dashboard for server performance monitoring which can be referred by technical heads to improve the working of servers. It includes information about server uptime and downtime, IT support, downtime issue, unsolved tickets, etc. Presenting our well structured Information Technology Dashboard For Server Performance Monitoring. The topics discussed in this slide are Information Technology Dashboard For Server Performance Monitoring. This is an instantly available PowerPoint presentation that can be edited conveniently. Download it right away and captivate your audience.
-
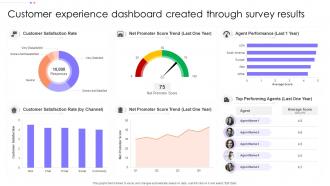 Customer Experience Dashboard Snapshot Created Through Survey Results
This graph or chart is linked to excel, and changes automatically based on data. Just left click on it and select Edit Data. Introducing our Customer Experience Dashboard Snapshot Created Through Survey Results set of slides. The topics discussed in these slides are Customer Satisfaction Rate, Agent Performance, Net Promoter, Score Trend. This is an immediately available PowerPoint presentation that can be conveniently customized. Download it and convince your audience.
-
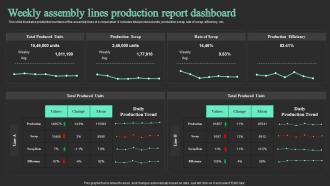 Weekly Assembly Lines Production Report Dashboard Snapshot
This slide illustrates production numbers of the assembly lines of a corporation. It includes total produced units, production scrap, rate of scrap, efficiency, etc. Introducing our Weekly Assembly Lines Production Report Dashboard set of slides. The topics discussed in these slides are Total Produced Units, Production Scrap, Production Efficiency. This is an immediately available PowerPoint presentation that can be conveniently customized. Download it and convince your audience.
-
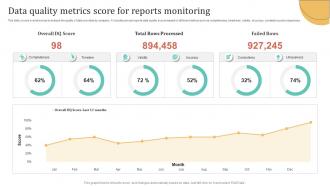 Data Quality Metrics Score For Reports Monitoring
This slide covers overall scores to analyse the quality of data provided by company. It includes annual reports data quality scores based on different metrics such as completeness, timeliness, validity, accuracy, consistency and uniqueness. Presenting our well structured Data Quality Metrics Score For Reports Monitoring. The topics discussed in this slide are Completeness, Timeliness, Uniqueness. This is an instantly available PowerPoint presentation that can be edited conveniently. Download it right away and captivate your audience.
-
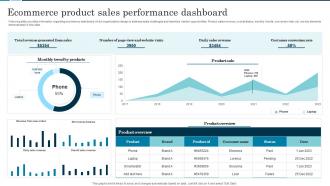 Ecommerce Product Sales Performance Dashboard
Following slide provides information regarding ecommerce dashboard which organizations design to address sales challenges and maximize market opportunities. Product sales revenue, overall status, monthly trends, conversion rate, etc. are key elements demonstrated in this slide. Introducing our Ecommerce Product Sales Performance Dashboard set of slides. The topics discussed in these slides are Daily Sales Revenue, Costumer Conversion Rate, Product Sale. This is an immediately available PowerPoint presentation that can be conveniently customized. Download it and convince your audience.
-
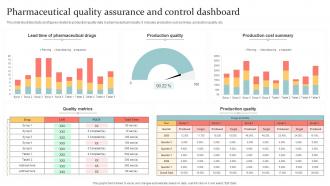 Pharmaceutical Quality Assurance And Control Dashboard
This slide illustrates facts and figures related to production quality data in pharmaceutical industry. It includes production cost summary, production quality, etc. Introducing our Pharmaceutical Quality Assurance And Control Dashboard set of slides. The topics discussed in these slides are Lead Time, Pharmaceutical Drugs, Production Quality. This is an immediately available PowerPoint presentation that can be conveniently customized. Download it and convince your audience.
-
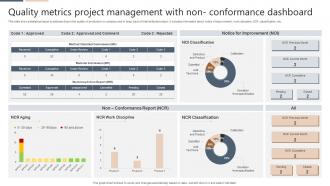 Quality Metrics Project Management With Non- Conformance Dashboard
This slide shows statistical report to address drop in the quality of products in a company and to keep track of total defected output. It includes information about notice of improvement, work discipline, NCR classification, etc. Presenting our well structured Quality Metrics Project Management With Non- Conformance Dashboard. The topics discussed in this slide are Notice For Improvement, Non Conformance Report. This is an instantly available PowerPoint presentation that can be edited conveniently. Download it right away and captivate your audience.
-
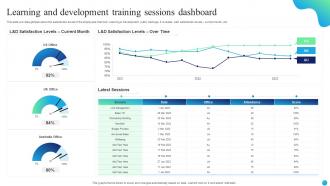 Learning And Development Training Sessions Dashboard
This slide provides glimpse about the satisfaction levels of the employees that took Learning Development L and D trainings. It includes L and D satisfaction levels current month, etc.Introducing our Learning And Development Training Sessions Dashboard set of slides. The topics discussed in these slides are Latest Sessions, Satisfaction Levels, Current Month. This is an immediately available PowerPoint presentation that can be conveniently customized. Download it and convince your audience.
-
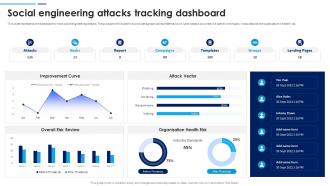 Social Engineering Attacks Tracking Dashboard Social Engineering Attacks Prevention
Deliver an outstanding presentation on the topic using this Social Engineering Attacks Tracking Dashboard Social Engineering Attacks Prevention. Dispense information and present a thorough explanation of Social Engineering Attacks, Tracking Dashboard, Organization Health Risk, Improvement Curve using the slides given. This template can be altered and personalized to fit your needs. It is also available for immediate download. So grab it now.
-
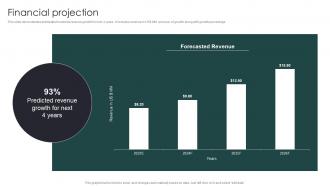 Financial Projection Big Data Management Investment Raising Pitch Deck
This slide demonstrates anticipated business revenue growth for next 4 years. It includes revenue in US dollar MM and year of growth along with growth percentage. Present the topic in a bit more detail with this Financial Projection Big Data Management Investment Raising Pitch Deck. Use it as a tool for discussion and navigation on Predicted Revenue Growth, Forecasted Revenue, 2023 To 2028. This template is free to edit as deemed fit for your organization. Therefore download it now.
-
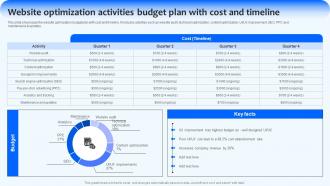 Website Optimization Activities Budget Implementing Management Strategies Strategy SS V
This slide showcases the website optimization budget plan with cost and timeline. It includes activities such as website audit, technical optimization, content optimization, UI UX improvement, SEO, PPC and maintenance and updates. Present the topic in a bit more detail with this Website Optimization Activities Budget Implementing Management Strategies Strategy SS V. Use it as a tool for discussion and navigation on Activities, Budget, Timeline. This template is free to edit as deemed fit for your organization. Therefore download it now.
-
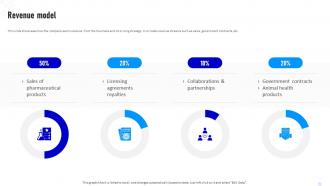 Revenue Model Pfizer Business Model Ppt File Background Designs BMC SS
This slide showcases how the company earns revenue from the business and its pricing strategy. It includes revenue streams such as sales, government contracts, etc. Deliver an outstanding presentation on the topic using this Revenue Model Pfizer Business Model Ppt File Background Designs BMC SS. Dispense information and present a thorough explanation of Licensing Agreements Royalties, Sales Of Pharmaceutical Products, Collaborations And Partnerships using the slides given. This template can be altered and personalized to fit your needs. It is also available for immediate download. So grab it now.
-
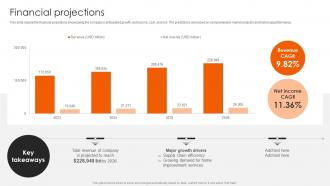 Financial Projections Home Depot Business Model BMC SS
This slide display the financial projections showcasing the companys anticipated growth, net income, cost, and risk. The predictions are based on comprehensive market analysis and historical performance. Present the topic in a bit more detail with this Financial Projections Home Depot Business Model BMC SS Use it as a tool for discussion and navigation on Financial Projections This template is free to edit as deemed fit for your organization. Therefore download it now.
-
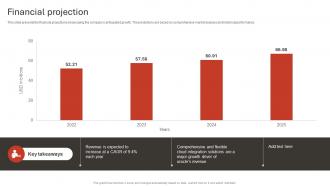 Financial Projection Oracle Business Model BMC SS
This slide presents the financial projections showcasing the companys anticipated growth. The predictions are based on comprehensive market analysis and historical performance. Present the topic in a bit more detail with this Financial Projection Oracle Business Model BMC SS Use it as a tool for discussion and navigation on Financial Projection This template is free to edit as deemed fit for your organization. Therefore download it now.
-
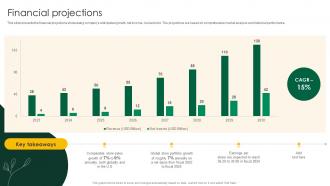 Financial Projections Starbucks Business Model BMC SS
This slide presents the financial projections showcasing companys anticipated growth, net income, cost and risk. The projections are based on comprehensive market analysis and historical performance. Present the topic in a bit more detail with this Financial Projections Starbucks Business Model BMC SS Use it as a tool for discussion and navigation on Financial Projections This template is free to edit as deemed fit for your organization. Therefore download it now.
-
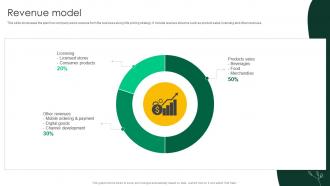 Revenue Model Starbucks Business Model BMC SS
This slide showcases the plan how company earns revenue from the business along it its pricing strategy. It include revenue streams such as product sales, licensing and other revenues. Present the topic in a bit more detail with this Revenue Model Starbucks Business Model BMC SS Use it as a tool for discussion and navigation on Consumer Products, Other Revenues, Products Sales This template is free to edit as deemed fit for your organization. Therefore download it now.
-
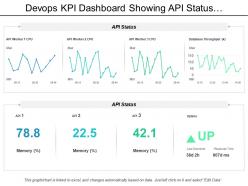 Devops kpi dashboard showing api status and uptime
Presenting this set of slides with name - Devops Kpi Dashboard Showing Api Status And Uptime. This is a four stage process. The stages in this process are Development And Operations, Devops.
-
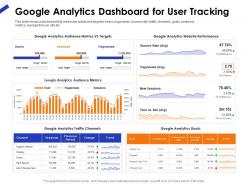 Google analytics dashboard for user tracking ppt example file
This slide shows a dashboard that measures actual and targeted users page views bounce rate traffic channels goals audience metrics average time on site etc. Presenting this set of slides with name Google Analytics Dashboard For User Tracking Ppt Example File. The topics discussed in these slides are Google Analytics Dashboard For User Tracking. This is a completely editable PowerPoint presentation and is available for immediate download. Download now and impress your audience.


