Charts, Graphs PowerPoint Designs, Presentation Charts Designs & PPT Graphics
- Sub Categories
-
- Arrows and Targets
- Bullet and Text Slides
- Charts and Graphs
- Circular Cycle Diagrams
- Concepts and Shapes
- Custom Flat Designs
- Dashboards and Measuring
- Flow Process
- Funnels
- Gears
- Growth
- Harvey Balls
- Idea Innovation and Light Bulbs
- Leadership
- Linear Process Diagrams
- Magnifying Glass
- Misc Other Graphics
- Opportunity and Handshake
- Organization Charts
- Puzzles
- Pyramids
- Roadmaps and Timelines
- Silhouettes
- Steps
- Strategic Planning Analysis
- SWOT Analysis
- Tables and Matrix
- Teamwork
- Technology and Communication
- Venn Diagrams
- Visuals and Illustrations
-
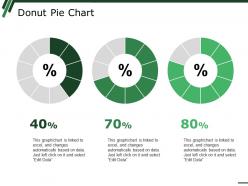 Donut pie chart ppt summary background images
Presenting Donut Pie Chart PPT Summary Background Images PPT slide. The donut design template designed by the professional team of SlideTeam to present the numerical data. The fully editable donut pie chart PowerPoint slide is compatible with Google Slide. You can modify the font size, font type, color, and shape of the donut design as the pie chart template can help a user in processing the data. You can insert the text related to the sales distribution of your organization. Numerous customized icons available at SlideTeam website, you can download and insert icons in your presentation.
-
 Our market share ppt show
Presenting this set of slides with name - Our Market Share Ppt Show. This is a four stage process. The stages in this process are Wages, Depreciation, Rent And Utilities, Marketing.
-
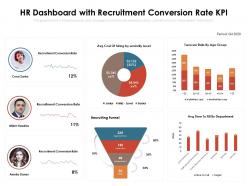 Hr dashboard with recruitment conversion rate kpi
Presenting this set of slides with name HR Dashboard With Recruitment Conversion Rate KPI. The topics discussed in these slides are Recruitment Conversion Rate, Applications, Hires, Interview, Assessment. This is a completely editable PowerPoint presentation and is available for immediate download. Download now and impress your audience.
-
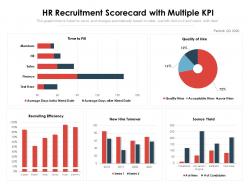 Hr recruitment scorecard with multiple kpi
Presenting this set of slides with name HR Recruitment Scorecard With Multiple KPI. The topics discussed in these slides are Quality Hire, Acceptable Hire, Poor Hire Finance, Sales. This is a completely editable PowerPoint presentation and is available for immediate download. Download now and impress your audience.
-
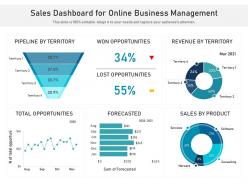 Sales dashboard for online business management
Presenting our well-structured Sales Dashboard For Online Business Management. The topics discussed in this slide are Pipeline By Territory, Won Opportunities, Revenue By Territory, Sales By Product, Forecasted. This is an instantly available PowerPoint presentation that can be edited conveniently. Download it right away and captivate your audience.
-
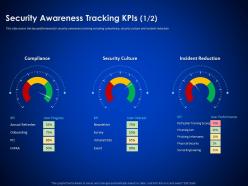 Security awareness tracking kpis survey enterprise cyber security ppt themes
This slide covers the key performance for security awareness training including compliance, security culture and incident reduction Deliver an outstanding presentation on the topic using this Security Awareness Tracking Kpis Survey Enterprise Cyber Security Ppt Themes. Dispense information and present a thorough explanation of Compliance, Security Culture, Incident Reduction using the slides given. This template can be altered and personalized to fit your needs. It is also available for immediate download. So grab it now.
-
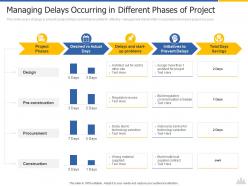 Managing delays occurring in construction project risk landscape ppt summary
This slide covers strategy to prevent project delays and enhance ability for effective management stakeholders crucial tasks to ensure project success. Present the topic in a bit more detail with this Managing Delays Occurring In Construction Project Risk Landscape Ppt Summary. Use it as a tool for discussion and navigation on Procurement, Construction, Days Savings, Project, Communication. This template is free to edit as deemed fit for your organization. Therefore download it now.
-
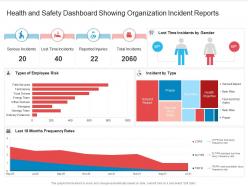 Health and safety dashboard showing organization incident reports
Presenting our well structured Health And Safety Dashboard Showing Organization Incident Reports. The topics discussed in this slide are Reported Injuries, Serious Incidents, Lost Time Incidents. This is an instantly available PowerPoint presentation that can be edited conveniently. Download it right away and captivate your audience.
-
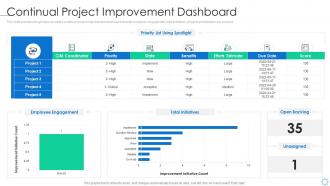 Software process improvement continual project improvement dashboard
This slide provides the glimpse about the continual project improvement dashboard wherein employee engagement, total initiatives, projects prioritization are covered. Present the topic in a bit more detail with this Software Process Improvement Continual Project Improvement Dashboard. Use it as a tool for discussion and navigation on Continual Project Improvement Dashboard. This template is free to edit as deemed fit for your organization. Therefore download it now.
-
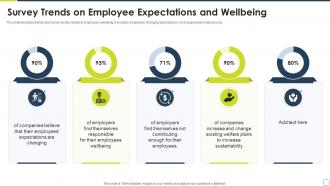 Survey Trends On Employee Expectations And Wellbeing
This slide illustrates trends and survey results related to employees wellbeing. It includes employees changing expectations, more responsible employers etc. Introducing our Survey Trends On Employee Expectations And Wellbeing set of slides. The topics discussed in these slides are Survey Trends On Employee Expectations And Wellbeing. This is an immediately available PowerPoint presentation that can be conveniently customized. Download it and convince your audience.
-
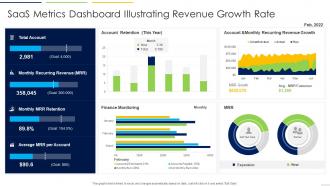 SaaS Metrics Dashboard Illustrating Revenue Growth Rate
Introducing our SaaS Metrics Dashboard Illustrating Revenue Growth Rate set of slides. The topics discussed in these slides are Account Retention, Finance Monitoring, Revenue Growth. This is an immediately available PowerPoint presentation that can be conveniently customized. Download it and convince your audience.
-
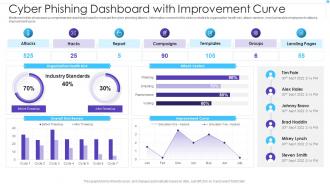 Cyber Phishing Dashboard With Improvement Curve
Mentioned slide showcases a comprehensive dashboard used to measure the cyber phishing attacks. Information covered in this slide is related to organization health risk, attack vendors, most vulnerable employees to attacks, improvement curve. Introducing our Cyber Phishing Dashboard With Improvement Curve set of slides. The topics discussed in these slides are Attacks, Campaigns, Templates. This is an immediately available PowerPoint presentation that can be conveniently customized. Download it and convince your audience.
-
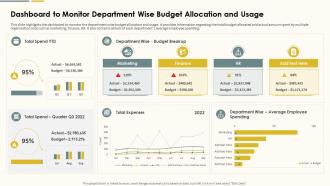 Dashboard To Monitor Department Wise Budget Action Plan For Marketing
This slide highlights the dashboard to monitor the department wise budget allocation and usage. It provides information regarding the total budget allocated and actual amount spent by multiple organization silos such as marketing, finance, HR. It also contains details of each departments average employee spending. Deliver an outstanding presentation on the topic using this Dashboard To Monitor Department Wise Budget Action Plan For Marketing. Dispense information and present a thorough explanation of Marketing, Finance, Department Wise using the slides given. This template can be altered and personalized to fit your needs. It is also available for immediate download. So grab it now.
-
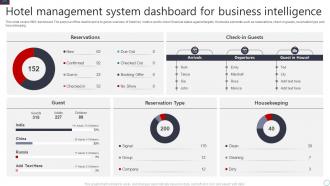 Hotel Management System Dashboard Snapshot For Business Intelligence
This slide covers HMS dashboard. The purpose of this dashboard is to get an overview of hotel key metrics and to check financial status against targets. It includes elements such as reservations, check in guests, reservation type and housekeeping. Presenting our well structured Hotel Management System Dashboard Snapshot For Business Intelligence. The topics discussed in this slide are Hotel Management, System Dashboard, Business Intelligence. This is an instantly available PowerPoint presentation that can be edited conveniently. Download it right away and captivate your audience.
-
 Project Data Quality Metrics Summary Dashboard With Threshold
This slide covers different KPIs to measure performance of data quality for project completion. It includes metric such as consistency, completeness, orderliness, timeliness, accuracy, auditability and uniqueness with thresholds. Presenting our well structured Project Data Quality Metrics Summary Dashboard With Threshold. The topics discussed in this slide are Consistency, Dashboard, Completeness. This is an instantly available PowerPoint presentation that can be edited conveniently. Download it right away and captivate your audience.
-
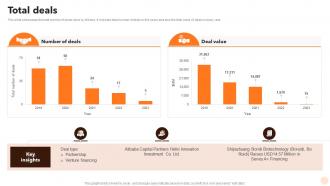 Total Deals Alibaba Company Profile Ppt Infographics CP SS
This slide showcases the total number of deals done by Alibaba. It includes total number of deals in five years and also the total value of deals in every year. Present the topic in a bit more detail with this Total Deals Alibaba Company Profile Ppt Infographics CP SS. Use it as a tool for discussion and navigation on Number Of Deals, Deal Value. This template is free to edit as deemed fit for your organization. Therefore download it now.
-
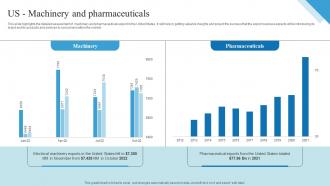 Us Machinery And Pharmaceuticals Outbound Trade Business Plan BP SS
This slide highlights the detailed assessment of machinery and pharmaceuticals export in the United States. It will help in getting valuable insights and project the success that the export business expects while introducing its brand and its products and services to consumers within the market. Deliver an outstanding presentation on the topic using this Us Machinery And Pharmaceuticals Outbound Trade Business Plan BP SS Dispense information and present a thorough explanation of Machinery, Pharmaceuticals using the slides given. This template can be altered and personalized to fit your needs. It is also available for immediate download. So grab it now.
-
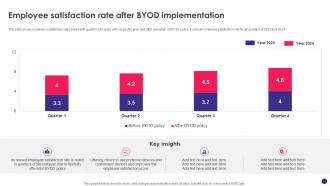 Implementing Byod Policy To Enhance Employee Satisfaction Rate After Byod Implementation
This slide shows employee satisfaction rates linked with quarters of 2 years with respect to prior and after execution of BYOD policy. It include employee satisfaction rate for all quarters of 2023 and 2024. Deliver an outstanding presentation on the topic using this Implementing Byod Policy To Enhance Employee Satisfaction Rate After Byod Implementation. Dispense information and present a thorough explanation of Employee Satisfaction Rate, BYOD Implementation, Employee Satisfaction Score using the slides given. This template can be altered and personalized to fit your needs. It is also available for immediate download. So grab it now.
-
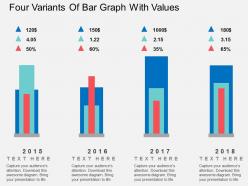 Four variants of bar graph with values flat powerpoint design
We are proud to present our four variants of bar graph with values flat powerpoint design. Graphic of four variants of bar graph with values has been used to craft this power point template diagram. This PPT diagram contains the concept of result analysis. Use this PPT diagram for business and marketing result related presentations.
-
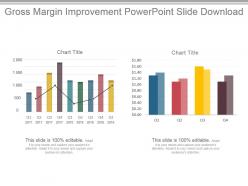 Gross margin improvement powerpoint slide download
Presenting gross margin improvement powerpoint slide download. Presenting gross margin improvement powerpoint slide download. Presenting gross margin improvement powerpoint slide download. This is a gross margin improvement powerpoint slide download. This is two stage process. The stages in this process are chart title, gross margin, improvement, business, success.
-
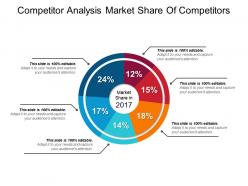 Competitor analysis market share of competitors ppt inspiration
Presenting competitor analysis market share of competitors PPT inspiration PPT slide. This presentation slide is widely applicable by a team of managers and business analyst who foresee the business in light of prosperity, by students and others. PPT has impressive picture quality with high resolution. 100 percent editable slide design. There is freedom to execute the changes in color, font, text and more as per one’s personal choice. Ease of personalization with your company name and logo. PPT is compatible with a wide variety of format options. PPT is harmonious with a set of software options, available both online and offline.
-
 Revenue icon presentation background images
Presenting revenue icon presentation background images. This is a revenue icon presentation background images. This is a six stage process. The stages in this process are revenue icon, income icon, turnover icon, sales icon.
-
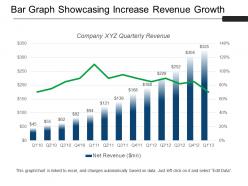 Bar graph showcasing increase revenue growth sample of ppt
Presenting the bar graph showcasing increase revenue growth sample of PPT. This PowerPoint theme is fully supported by Google Slides. Simple data input with linked Excel chart, just right click to input values. The picture quality of these slides does not change even when you project them on a large screen. Quick downloading speed and formats can be easily changed to other applications like JPEG and PDF. This template is suitable for marketing, salespersons, business managers, and entrepreneurs.
-
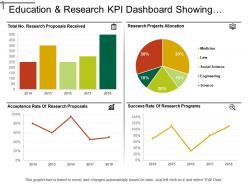 Education and research kpi dashboard showing research project allocation
Presenting education and research KPI dashboard showing research project allocation PPT slide. The project reporting design presentation template designed by professional team of SlideTeam. The research project PPT slide is fully customizable in PowerPoint. The project allocation dashboard PowerPoint slide is also compatible with Google Slide so a user can share this slide with others. A user can make changes in the font size, font type, color as well as dimensions of the allocated project report detail slide as per the requirement. You may edit the value in the education KPI dashboard PowerPoint template as the slide gets linked with the Excel sheet.
-
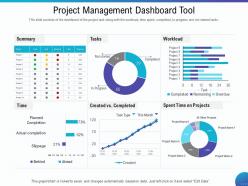 Project management dashboard tool ahead ppt powerpoint presentation icon gridlines
This slide consists of the dashboard of the project task along with the workload, time spent, completed, in progress and not started tasks. Presenting this set of slides with name Project Management Dashboard Tool Ahead Ppt Powerpoint Presentation Icon Gridlines. The topics discussed in these slides are Tasks, Projects, Time. This is a completely editable PowerPoint presentation and is available for immediate download. Download now and impress your audience.
-
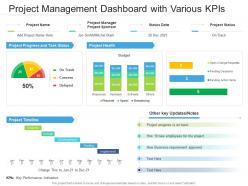 Project management dashboard snapshot with various kpis
Introducing our Project Management Dashboard Snapshot With Various KPIs set of slides. The topics discussed in these slides are Project Timeline, Project Progress, Project Health, Project Status, Analysis. This is an immediately available PowerPoint presentation that can be conveniently customized. Download it and convince your audience.
-
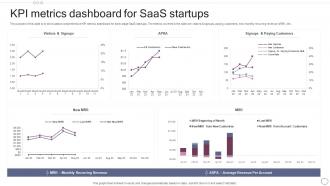 KPI Metrics Dashboard For SAAS Startups
The purpose of this slide is to showcase a comprehensive KPI metrics dashboard for early stage SaaS startups. The metrics covered in the slide are visitors and signups, paying customers, new monthly recurring revenue MRR, etc. Introducing our KPI Metrics Dashboard For SAAS Startups set of slides. The topics discussed in these slides are Visitors, Signups, Paying Customers. This is an immediately available PowerPoint presentation that can be conveniently customized. Download it and convince your audience.
-
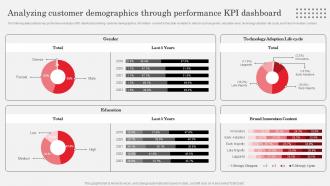 Analyzing Customer Demographics Through Performance KPI Dashboard
The following slide outlines key performance indicator KPI dashboard outlining customer demographics. Information covered in this slide is related to metrics such as gender, education level, technology adoption life cycle, and brand innovation consent. Deliver an outstanding presentation on the topic using this Analyzing Customer Demographics Through Performance KPI Dashboard. Dispense information and present a thorough explanation of Brand, Innovation, Technology using the slides given. This template can be altered and personalized to fit your needs. It is also available for immediate download. So grab it now.
-
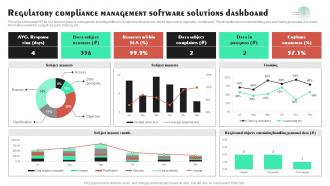 Regulatory Compliance Management Software Solutions Dashboard
This slide showcases KPI for risk and compliance management enabling shift from compliance driven to risk driven approach to regulatory compliance. This template aims on standardizing and automating processes. It includes information related to subject requests, training, etc. Presenting our well structured Regulatory Compliance Management Software Solutions Dashboard The topics discussed in this slide are Data Subject, Subject Request TrendsThis is an instantly available PowerPoint presentation that can be edited conveniently. Download it right away and captivate your audience.
-
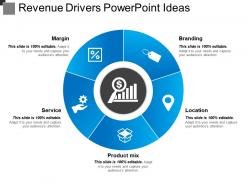 Revenue drivers powerpoint ideas
Presenting revenue drivers PowerPoint ideas PPT template. You can download the template and save into JPG & PDF format and can also display in the standard & widescreen view. You may alter the slide such as color, text, font type, font size and aspect ratio. The template gets synced with Google Slides and editable in PowerPoint. You may share this slide with large segment because it has tremendous pixel quality. You can insert the relevant content in text placeholder of this template.
-
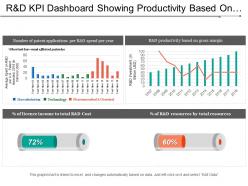 R and d kpi dashboard showing productivity based on gross margin
Presenting this set of slides with name - R And D Kpi Dashboard Showing Productivity Based On Gross Margin. This is a three stage process. The stages in this process are R And D, Research And Development, Research And Technological Development.
-
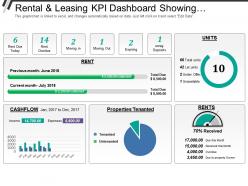 Rental and leasing kpi dashboard showing rent due today rent overdue properties tenanted
Presenting this set of slides with name - Rental And Leasing Kpi Dashboard Showing Rent Due Today Rent Overdue Properties Tenanted. This is a five stage process. The stages in this process are Rental And Leasing, Dealing And Leasing, Rental And Engage.
-
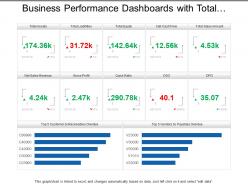 Business performance dashboards with total assets gross profit and cash flow
Presenting, business performance dashboards with total assets gross profit and cash flow PPT deck. Adjustable color, text, and font as per the need. Engaging and easy to comprehend infographic format. Even download and can be converted into JPG and PDF format. The advantage of the addition of logo and trademarks for personalization. Adaptable to widescreen view without the problem of pixelation. Exposition illustration well-matched with google slides. Related designs available with different nodes and stages. Possible in 4:3 and full-screen version 16:9
-
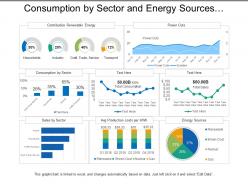 Consumption by sector and energy sources utilities dashboard
Presenting this set of slides with name - Consumption By Sector And Energy Sources Utilities Dashboard. This is a three stage process. The stages in this process are Utilities, Use, Advantage.
-
 Combo chart finance ppt powerpoint presentation infographic template structure
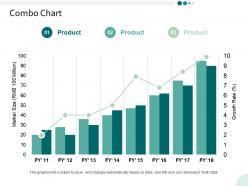
Presenting this set of slides with name - Combo Chart Finance Ppt Powerpoint Presentation Infographic Template Structure. This is a three stages process. The stages in this process are Finance, Marketing, Management, Investment, Analysis.
-
 Three column showing competitor analysis comparison
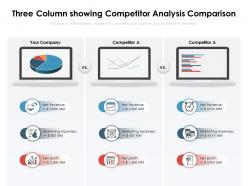
Presenting this set of slides with name Three Column Showing Competitor Analysis Comparison. This is a three stage process. The stages in this process are Net Revenue, Marketing Expenses, Net Profit. This is a completely editable PowerPoint presentation and is available for immediate download. Download now and impress your audience.
-
 Building An Inclusive And Diverse Organization And Inclusion Dashboard
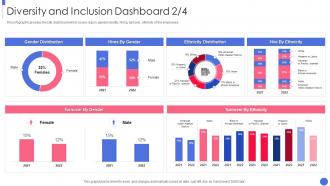
This infographic provides the D and I dashboard which covers region, gender identity, hiring, turnover, ethnicity of the employees. Deliver an outstanding presentation on the topic using this Building An Inclusive And Diverse Organization And Inclusion Dashboard. Dispense information and present a thorough explanation of Diversity And Inclusion Dashboard using the slides given. This template can be altered and personalized to fit your needs. It is also available for immediate download. So grab it now.
-
 Historical Revenue Insurance Company Profile Ppt Powerpoint Presentation Gallery Slides
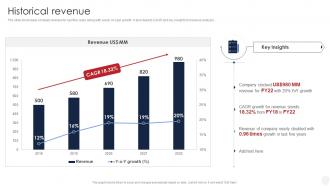
The slide showcases company revenue for last five years along with yearly on year growth. It also depicts CAGR and key insights for revenue analysis. Deliver an outstanding presentation on the topic using this Historical Revenue Insurance Company Profile Ppt Powerpoint Presentation Gallery Slides. Dispense information and present a thorough explanation of Revenue, Analysis, Growth using the slides given. This template can be altered and personalized to fit your needs. It is also available for immediate download. So grab it now.
-
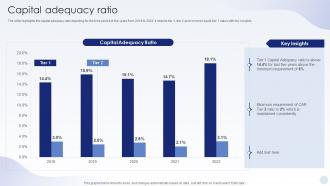 BFSI Company Profile Capital Adequacy Ratio Ppt Powerpoint Presentation Slides Master Slide
The slide highlights the capital adequacy ratio depicting for the time period of five years from 2018 to 2022. It depicts tier 1, tier 2 and common equity tier 1 ratios with key insights. Present the topic in a bit more detail with this BFSI Company Profile Capital Adequacy Ratio Ppt Powerpoint Presentation Slides Master Slide. Use it as a tool for discussion and navigation on Capital Adequacy Ratio. This template is free to edit as deemed fit for your organization. Therefore download it now.
-
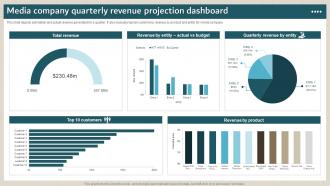 Media Company Quarterly Revenue Projection Dashboard
This slide depicts estimation and actual revenue generated for a quarter. It also includes top ten customers, revenue by product and entity for media company Presenting our well-structured Media Company Quarterly Revenue Projection Dashboard. The topics discussed in this slide are Media Company, Quarterly, Revenue Projection, Dashboard. This is an instantly available PowerPoint presentation that can be edited conveniently. Download it right away and captivate your audience.
-
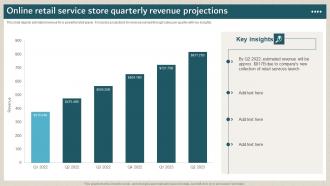 Online Retail Service Store Quarterly Revenue Projections
This slide depicts estimated revenue for a powerful retail player. It includes projections for revenue earned through sales per quarter with key insights. Introducing our Online Retail Service Store Quarterly Revenue Projections set of slides. The topics discussed in these slides are Online Retail Service, Store Quarterly, Revenue Projections. This is an immediately available PowerPoint presentation that can be conveniently customized. Download it and convince your audience.
-
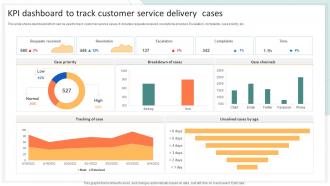 KPI Dashboard To Track Customer Service Delivery Cases
This slide shows dashboard which can be used to track customer service cases. It includes requests received, resolutions provided, Escalation, complaints, case priority, etc. Presenting our well structured KPI Dashboard To Track Customer Service Delivery Cases. The topics discussed in this slide are Case Priority, Breakdown Of Cases, Case Channels. This is an instantly available PowerPoint presentation that can be edited conveniently. Download it right away and captivate your audience.
-
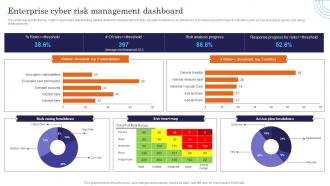 Enterprise Cyber Risk Management Dashboard Incident Response Strategies Deployment
This slide represents the key metrics dashboard representing details related to management of cyber security incidents by an enterprise. It includes key performance indicators such as risk analysis progress, risk rating breakdown etc. Present the topic in a bit more detail with this Enterprise Cyber Risk Management Dashboard Incident Response Strategies Deployment. Use it as a tool for discussion and navigation on Rating, Management, Enterprise. This template is free to edit as deemed fit for your organization. Therefore download it now.
-
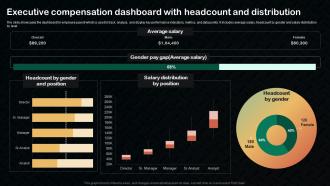 Executive Compensation Dashboard With Headcount And Distribution
The slide showcases the dashboard for employee payroll which is used to track, analyze, and display key performance indicators, metrics, and data points. It includes average salary, headcount by gender and salary distribution by level. Presenting our well structured Executive Compensation Dashboard With Headcount And Distribution. The topics discussed in this slide are Salary Distribution By Position, Gender And Position. This is an instantly available PowerPoint presentation that can be edited conveniently. Download it right away and captivate your audience.
-
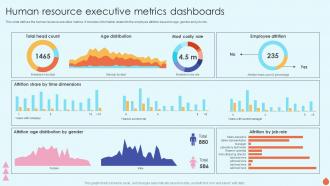 Human Resource Executive Metrics Dashboards
This slide defines the human resource executive metrics. It includes information related to the employee attrition based on age, gender and job role. Present the topic in a bit more detail with this Human Resource Executive Metrics Dashboards. Use it as a tool for discussion and navigation on Age Distribution, Most Costly Role, Employee Attrition. This template is free to edit as deemed fit for your organization. Therefore download it now.
-
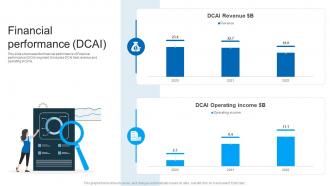 Financial Performance DCAI Intel Company Profile Ppt Structure CP SS
This slide showcases the financial performance of Financial performance DCAI segment. It includes DCAI total revenue and operating income. Present the topic in a bit more detail with this Financial Performance DCAI Intel Company Profile Ppt Structure CP SS. Use it as a tool for discussion and navigation on Financial Performance. This template is free to edit as deemed fit for your organization. Therefore download it now.
-
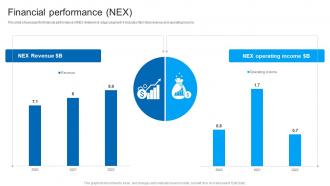 Financial Performance Nex Intel Company Profile Ppt Sample CP SS
This slide showcases the financial performance of NEX Network and edge segment. It includes NEX total revenue and operating income. Present the topic in a bit more detail with this Financial Performance Nex Intel Company Profile Ppt Sample CP SS. Use it as a tool for discussion and navigation on Financial Performance. This template is free to edit as deemed fit for your organization. Therefore download it now.
-
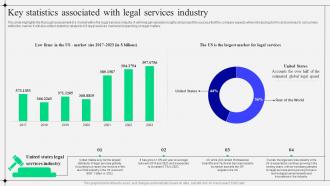 Sample Kirkland And Ellis Law Firm Key Statistics Associated With Legal Services Industry BP SS
This slide highlights the thorough assessment of a market within the legal services industry. It will help get valuable insights and project the success that the company expects while introducing its firm and services to consumers within the market. It will also reflect statistics related to US legal services market and spending on legal matters. Deliver an outstanding presentation on the topic using this Sample Kirkland And Ellis Law Firm Key Statistics Associated With Legal Services Industry BP SS. Dispense information and present a thorough explanation of Legal Services Industry, Firm And Services To Consumers, Technological Advancements, Innovations In The Industry using the slides given. This template can be altered and personalized to fit your needs. It is also available for immediate download. So grab it now.
-
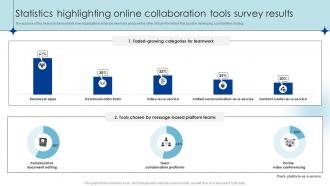 Statistics Highlighting Online Collaboration Tools Survey Results
The purpose of this slide is to demonstrate how organizations embrace new tools and provides other critical information that assist in developing a competitive strategy. Presenting our well structured Statistics Highlighting Online Collaboration Tools Survey Results. The topics discussed in this slide are Collaborative Document Editing, Team Collaboration Platforms, Online Video Conferencing. This is an instantly available PowerPoint presentation that can be edited conveniently. Download it right away and captivate your audience.
-
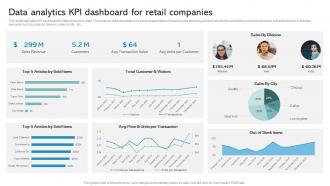 Data Analytics KPI Dashboard For Retail Companies
This slide highlights KPI dashboard for data analysis in retail. The purpose of this template is to assist organizations in tracking and analyzing product demand for predicting customer behaviour and preferences. It includes elements such as sales by division, sales by city, etc. Presenting our well structured Data Analytics KPI Dashboard For Retail Companies. The topics discussed in this slide are Total Customer And Visitors, Units Per Transaction, Articles By Sold Items. This is an instantly available PowerPoint presentation that can be edited conveniently. Download it right away and captivate your audience.
-
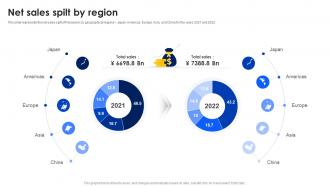 Net Sales Spilt By Region Panasonic Company Profile CP SS
This slide represents the net sales split of Panasonic by geographical regions Japan, Americas, Europe, Asia, and China for the years 2021 and 2022. Present the topic in a bit more detail with this Net Sales Spilt By Region Panasonic Company Profile CP SS. Use it as a tool for discussion and navigation on Geographical, Sales, Region. This template is free to edit as deemed fit for your organization. Therefore download it now.
-
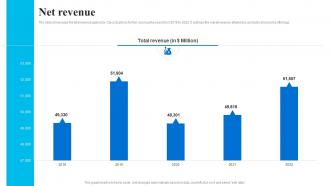 Net Revenue Cisco Company Profile CP SS
The slide showcases the total revenue gained by Cisco Systems for five consecutive years from 2018 to 2022. It outlines the overall revenue attained by products and service offerings. Present the topic in a bit more detail with this Net Revenue Cisco Company Profile CP SS. Use it as a tool for discussion and navigation on Revenue, Consecutive, Revenue. This template is free to edit as deemed fit for your organization. Therefore download it now.
-
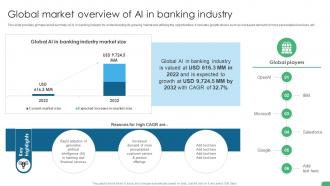 Global Market Overview Of Ai In Banking Industry Digital Transformation In Banking DT SS
This slide provides glimpse about summary of AI in banking industry for understanding its growing market and utilizing the opportunities. It includes growth drivers such as increased demand of more personalized services, etc. Present the topic in a bit more detail with this Global Market Overview Of Ai In Banking Industry Digital Transformation In Banking DT SS Use it as a tool for discussion and navigation on Global AI, Banking Industry Market Size, Microsoft This template is free to edit as deemed fit for your organization. Therefore download it now.
-
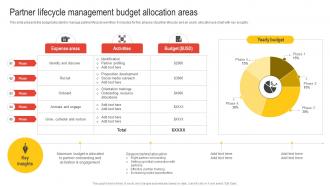 Partner Lifecycle Management Budget Allocation Areas Nurturing Relationships
This slide presents the budget allocated to manage partner lifecycle workflow. It includes for five phases of partner lifecycle and an yearly allocation pie chart with key insights. Present the topic in a bit more detail with this Partner Lifecycle Management Budget Allocation Areas Nurturing Relationships Use it as a tool for discussion and navigation on Expense Areas, Activities, Budget This template is free to edit as deemed fit for your organization. Therefore download it now.
-
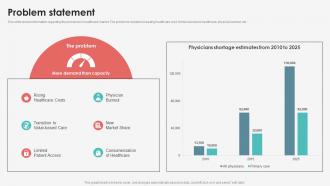 Problem Statement Digital Healthcare Company Fundraising
This slide shows information regarding the problems in healthcare market. The problems include increasing healthcare cost, limited access to healthcare, physical burnout, etc. Deliver an outstanding presentation on the topic using this Problem Statement Digital Healthcare Company Fundraising. Dispense information and present a thorough explanation of Healthcare, Physician, Market, Access, Consumerization using the slides given. This template can be altered and personalized to fit your needs. It is also available for immediate download. So grab it now.
-
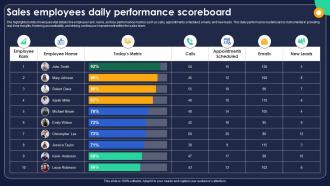 Sales Employees Daily Performance Scoreboard
The highlighted slide showcases vital details like employee rank, name, and key performance metrics such as calls, appointments scheduled, emails, and new leads. This daily performance leaderboard is instrumental in providing real time insights, fostering accountability, and driving continuous improvement within the sales team. Introducing our Sales Employees Daily Performance Scoreboard set of slides. The topics discussed in these slides are Employees, Performance, Scoreboard. This is an immediately available PowerPoint presentation that can be conveniently customized. Download it and convince your audience.
-
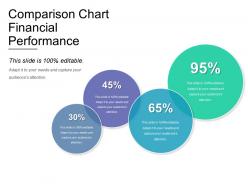 Comparison chart financial performance powerpoint slide
Presenting comparison chart financial performance powerpoint slide. This is a comparison chart financial performance powerpoint slide. This is a four stage process. The stages in this process are comparison chart, comparison table, comparison matrix.
-
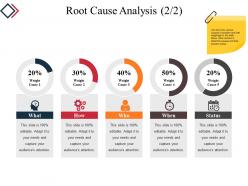 Root cause analysis powerpoint slide deck template
Presenting root cause analysis powerpoint slide deck template. This is a root cause analysis powerpoint slide deck template. This is a five stage process. The stages in this process are donut, business, marketing, strategy, planning.
-
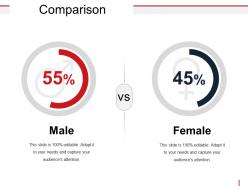 Comparison powerpoint guide
Presenting comparison powerpoint guide. This is a comparison powerpoint guide. This is a two stage process. The stages in this process are comparison, percentage, male, female, business.
-
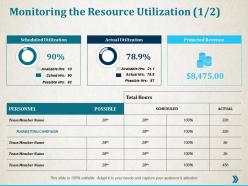 Monitoring the resource utilization ppt professional infographic template
Presenting this set of slides with name - Monitoring The Resource Utilization Ppt Professional Infographic Template. This is a three stage process. The stages in this process are Finance, Analysis, Business, Investment, Marketing.


