Charts, Graphs PowerPoint Designs, Presentation Charts Designs & PPT Graphics
- Sub Categories
-
- Arrows and Targets
- Bullet and Text Slides
- Charts and Graphs
- Circular Cycle Diagrams
- Concepts and Shapes
- Custom Flat Designs
- Dashboards and Measuring
- Flow Process
- Funnels
- Gears
- Growth
- Harvey Balls
- Idea Innovation and Light Bulbs
- Leadership
- Linear Process Diagrams
- Magnifying Glass
- Misc Other Graphics
- Opportunity and Handshake
- Organization Charts
- Puzzles
- Pyramids
- Roadmaps and Timelines
- Silhouettes
- Steps
- Strategic Planning Analysis
- SWOT Analysis
- Tables and Matrix
- Teamwork
- Technology and Communication
- Venn Diagrams
- Visuals and Illustrations
-
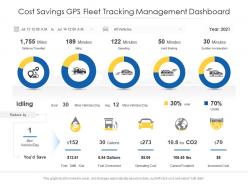 Cost savings gps fleet tracking management dashboard
Presenting our well-structured Cost Savings GPS Fleet Tracking Management Dashboard. The topics discussed in this slide are Distance Travelled, Idling, Speeding, Hard Braking, Sudden Acceleration. This is an instantly available PowerPoint presentation that can be edited conveniently. Download it right away and captivate your audience.
-
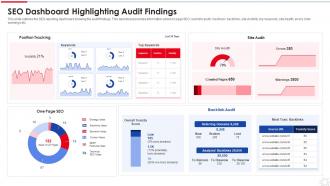 Seo Dashboard Snapshot Highlighting Audit Findings
This slide outlines the SEO reporting dashboard snapshot showing the audit findings. This dashboard provides information about on page SEO, backlink audit, most toxic backlinks, site visibility, top keywords, site health, errors, total warnings etc. Introducing our Seo Dashboard Highlighting Audit Findings set of slides. The topics discussed in these slides are Position Tracking, Backlink Audit, One Page SEO. This is an immediately available PowerPoint presentation that can be conveniently customized. Download it and convince your audience.
-
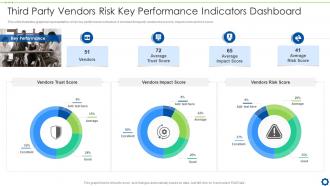 Third Party Vendors Risk Key Performance Indicators Dashboard Snapshot
This slide illustrates graphical representation of risk key performance indicators. It includes third party vendors trust score, impact score and risk score. Presenting our well structured Third Party Vendors Risk Key Performance Indicators Dashboard Snapshot. The topics discussed in this slide are Key Performance, Vendors Trust Score, Vendors Impact Score, Vendors Risk Score. This is an instantly available PowerPoint presentation that can be edited conveniently. Download it right away and captivate your audience.
-
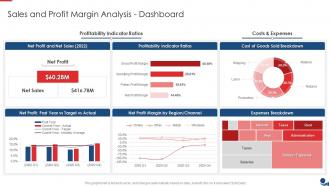 Finance And Accounting Sales And Profit Margin Analysis Dashboard
This graph or chart is linked to excel, and changes automatically based on data. Just left click on it and select Edit Data. Present the topic in a bit more detail with this Finance And Accounting Sales And Profit Margin Analysis Dashboard. Use it as a tool for discussion and navigation on Profitability Indicator Ratios, Costs And Expenses, Net Profit. This template is free to edit as deemed fit for your organization. Therefore download it now.
-
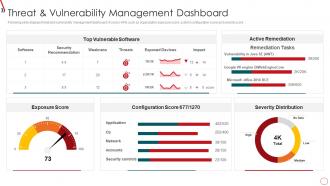 Risk Management Framework For Information Security Threat And Vulnerability
Following slide displays threat and vulnerability management dashboard. It covers KPIs such as organization exposure score, system configuration score and severity score. Present the topic in a bit more detail with this Risk Management Framework For Information Security Threat And Vulnerability. Use it as a tool for discussion and navigation on Exposure Score, Top Vulnerable Software, Severity Distribution, Active Remediation, Configuration Score. This template is free to edit as deemed fit for your organization. Therefore download it now.
-
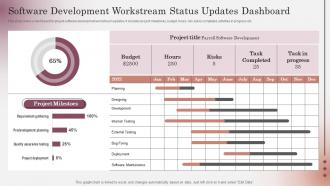 Software Development Workstream Status Updates Dashboard
This slide covers a dashboard for project software development workstream updates. It includes project milestones, budget, hours, risk, tasks completed, activities in progress etc. Introducing our Software Development Workstream Status Updates Dashboard set of slides. The topics discussed in these slides are Development, Designing, Planning, External Testing. This is an immediately available PowerPoint presentation that can be conveniently customized. Download it and convince your audience.
-
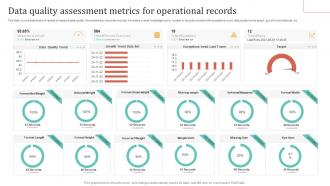 Data Quality Assessment Metrics For Operational Records
This slide covers dashboard of results to measure data quality from examining corporate records. It includes overall weightage score, number of records checked with exceptions count, data quality trends graph, growth trend data set, etc. Presenting our well structured Data Quality Assessment Metrics For Operational Records. The topics discussed in this slide are Assessment, Operational, Dashboard. This is an instantly available PowerPoint presentation that can be edited conveniently. Download it right away and captivate your audience.
-
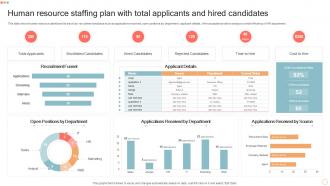 Human Resource Staffing Plan With Total Applicants And Hired Candidates
This slide shows human resource dashboard to track key recruitment analytics such as applications received, open positions by department, applicant details, offer acceptance ratio to analyze overall efficiency of HR department. Presenting our well structured Human Resource Staffing Plan With Total Applicants And Hired Candidates. The topics discussed in this slide are Total Applicants, Shortlisted Candidates, Hired Candidates. This is an instantly available PowerPoint presentation that can be edited conveniently. Download it right away and captivate your audience.
-
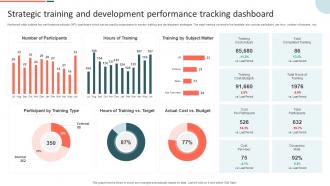 Strategic Training And Development Performance Tracking Dashboard
Mentioned slide outlines key performance indicator KPI dashboard which can be used by organization to monitor training and development strategies. The major metrics covered in the template are cost per participant, per hour, number of trainees , etc. Introducing our Strategic Training And Development Performance Tracking Dashboard set of slides. The topics discussed in these slides are Subject Matter, Cost, Budget. This is an immediately available PowerPoint presentation that can be conveniently customized. Download it and convince your audience.
-
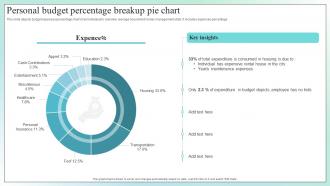 Personal Budget Percentage Breakup Pie Chart
This slide depicts budget expenses percentage chart of an individual to overview average household money management stats. It includes expenses percentage. Introducing our Personal Budget Percentage Breakup Pie Chart set of slides. The topics discussed in these slides are Expenditure In Budget Depicts, Maintenance Expenses, Expenditure Is Consumed This is an immediately available PowerPoint presentation that can be conveniently customized. Download it and convince your audience.
-
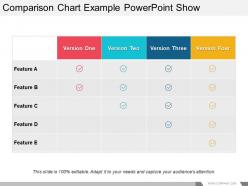 Comparison chart example powerpoint show
Presenting comparison chart example powerpoint show. This is a comparison chart example powerpoint show. This is a four stage process. The stages in this process are comparison chart, comparison table, comparison matrix.
-
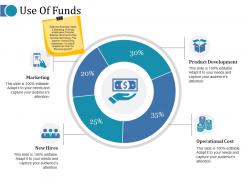 Use of funds ppt layouts slide download
Presenting this set of slides with name - Use Of Funds Ppt Layouts Slide Download. This is a four stage process. The stages in this process are Marketing, New Hires, Operational Cost, Product Development.
-
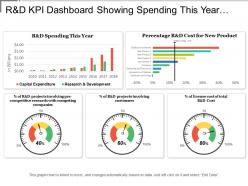 R and d kpi dashboard showing spending this year and cost for new product
Presenting this set of slides with name - R And D Kpi Dashboard Showing Spending This Year And Cost For New Product. This is a five stage process. The stages in this process are R And D, Research And Development, Research And Technological Development.
-
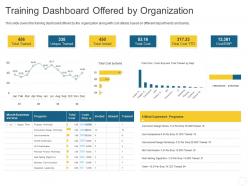 Training dashboard offered by organization personal journey organization ppt formats
This slide covers the training dashboard offered by the organization along with cost details based on different departments and bands. Deliver an outstanding presentation on the topic using this Training Dashboard Offered By Organization Personal Journey Organization Ppt Formats. Dispense information and present a thorough explanation of Training Dashboard Offered By Organization using the slides given. This template can be altered and personalized to fit your needs. It is also available for immediate download. So grab it now.
-
 Risk status assessment for production facility
Presenting our well structured Risk Status Assessment For Production Facility. The topics discussed in this slide are System parameters, risk score, issues. This is an instantly available PowerPoint presentation that can be edited conveniently. Download it right away and captivate your audience.
-
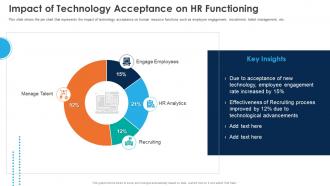 Impact Of Technology Acceptance On HR Functioning Automation Of HR Workflow
This slide shows the pie chart that represents the impact of technology acceptance on human resource functions such as employee engagement, recruitment, talent management, etc. Deliver an outstanding presentation on the topic using this Impact Of Technology Acceptance On HR Functioning Automation Of HR Workflow. Dispense information and present a thorough explanation of Engage Employees, HR Analytics, Recruiting, Manage Talent using the slides given. This template can be altered and personalized to fit your needs. It is also available for immediate download. So grab it now.
-
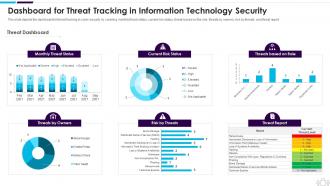 Information Technology Security Dashboard Snapshot Threat Tracking Information Technology Security
This slide depicts the dashboard for threat tracking in cyber security by covering monthly threat status, current risk status, threat-based on the role, threats by owners, risk by threats, and threat report. Present the topic in a bit more detail with this Information Technology Security Dashboard Threat Tracking Information Technology Security. Use it as a tool for discussion and navigation on Dashboard, Information, Technology. This template is free to edit as deemed fit for your organization. Therefore download it now.
-
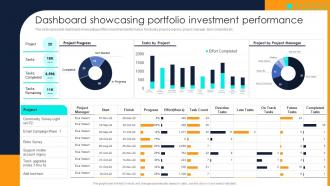 Financial Investment Portfolio Management Dashboard Showcasing Portfolio Investment Performance
This slide represents dashboard showcasing portfolio investment performance. It includes project progress, project manager, task completed etc. Present the topic in a bit more detail with this Financial Investment Portfolio Management Dashboard Showcasing Portfolio Investment Performance. Use it as a tool for discussion and navigation on Dashboard, Investment, Performance. This template is free to edit as deemed fit for your organization. Therefore download it now.
-
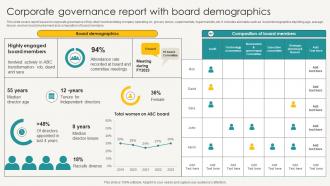 Corporate Governance Report With Board Demographics
This slide covers report based on corporate governance of top retail merchandising company operating on grocery stores, supermarkets, hypermarkets, etc. It includes elements such as board demographics depicting age, average tenure, women board involvement and composition of board members. Presenting our well structured Corporate Governance Report With Board Demographics. The topics discussed in this slide are Corporate Governance Report, Board Demographics. This is an instantly available PowerPoint presentation that can be edited conveniently. Download it right away and captivate your audience.
-
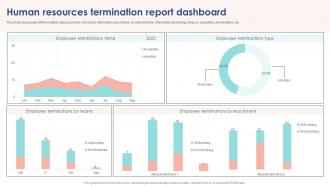 Human Resources Termination Report Dashboard
This slide showcases HR termination status summary. It provides information about trend, recruitment drive, information technology, finance, operations, terminations, etc. Presenting our well structured Human Resources Termination Report Dashboard. The topics discussed in this slide are Human Resources, Termination Report, Dashboard. This is an instantly available PowerPoint presentation that can be edited conveniently. Download it right away and captivate your audience.
-
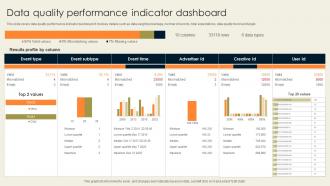 Data Quality Performance Indicator Dashboard
This slide covers data quality performance indicator dashboard. It involves details such as data weight percentage, number of records, total expectations, data quality trend and target. Presenting our well structured Data Quality Performance Indicator Dashboard. The topics discussed in this slide are Event Type, Event Subtype, Event Time, Advertiser Id. This is an instantly available PowerPoint presentation that can be edited conveniently. Download it right away and captivate your audience.
-
 Artificial Intelligence Dashboard Showing Hyperautomation Industry Report
The following dashboard shows key AI metrics such as Cloud infrastructure, application Health and User Experience. Deliver an outstanding presentation on the topic using this Artificial Intelligence Dashboard Showing Hyperautomation Industry Report. Dispense information and present a thorough explanation of Quick Overview, Cloud And Infrastructure, Application Health using the slides given. This template can be altered and personalized to fit your needs. It is also available for immediate download. So grab it now.
-
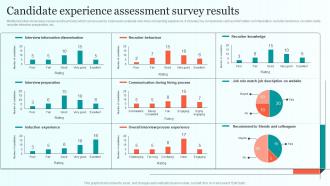 Candidate Experience Assessment Survey Results Comprehensive Guide For Talent Sourcing
Mentioned slide showcases survey result summary which can be used by business to evaluate new hires onboarding experience. It includes key components such as information communication, recruiter behaviour, recruiter clarify, recruiter interview preparation, etc. Deliver an outstanding presentation on the topic using this Candidate Experience Assessment Survey Results Comprehensive Guide For Talent Sourcing Dispense information and present a thorough explanation of Recruiter Behaviour, Recruiter Knowledge, Interview Preparation using the slides given. This template can be altered and personalized to fit your needs. It is also available for immediate download. So grab it now.
-
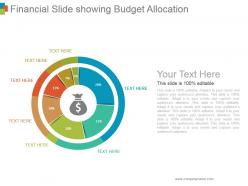 Financial slide showing budget allocation ppt background
Presenting financial slide showing budget allocation ppt background. This is a financial slide showing budget allocation ppt background. This is a seven stage process. The stages in this process are circular, process, percentage, financial, budget.
-
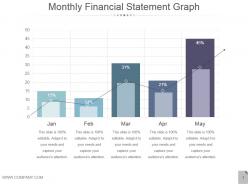 Monthly financial statement graph ppt examples slides
Presenting monthly financial statement graph ppt examples slides. This is a monthly financial statement graph ppt examples slides. This is a two stage process. The stages in this process are jan, feb, mar, apr, may.
-
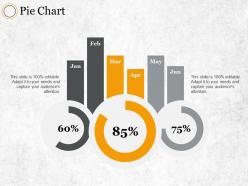 Pie chart ppt professional graphics download
Presenting this set of slides with name - Pie Chart Ppt Professional Graphics Download. This is a three stage process. The stages in this process are Product, Percentage, Business, Marketing, Management.
-
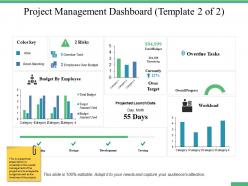 Project management dashboard snapshot ppt professional graphic images
Presenting this set of slides with name - Project Management Dashboard Snapshot Ppt Professional Graphic Images. This is a four stage process. The stages in this process are Percentage, Product, Management, Marketing, Business.
-
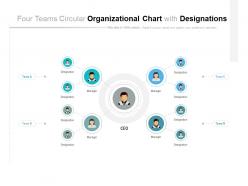 Four teams circular organizational chart with designations
Presenting this set of slides with name Four Teams Circular Organizational Chart With Designations. This is a four stage process. The stages in this process are Circular Organizational Chart, Hierarchy Organizational Chart, Interconnected Organizational Chart. This is a completely editable PowerPoint presentation and is available for immediate download. Download now and impress your audience.
-
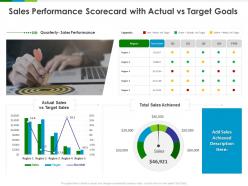 Sales performance scorecard with actual vs target goals ppt powerpoint presentation outline design inspiration
Presenting this set of slides with name Sales Performance Scorecard With Actual Vs Target Goals Ppt Powerpoint Presentation Outline Design Inspiration. The topics discussed in these slides are Target Sales, Sales Achieved, Sales Performance. This is a completely editable PowerPoint presentation and is available for immediate download. Download now and impress your audience.
-
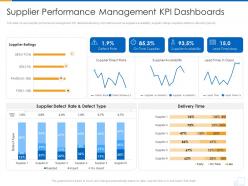 Supplier performance management kpi dashboards supplier strategy ppt styles
This slide covers supplier performance management KPI dashboards along with metrics such as suppliers availability, supplier ratings, suppliers defence rate and type etc. Present the topic in a bit more detail with this Supplier Performance Management Kpi Dashboards Supplier Strategy Ppt Styles. Use it as a tool for discussion and navigation on Rate, Supplier. This template is free to edit as deemed fit for your organization. Therefore download it now.
-
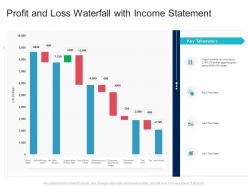 Profit and loss waterfall with income statement
Presenting our well structured Profit And Loss Waterfall With Income Statement. The topics discussed in this slide are Gross Sales, Organizations, Income. This is an instantly available PowerPoint presentation that can be edited conveniently. Download it right away and captivate your audience.
-
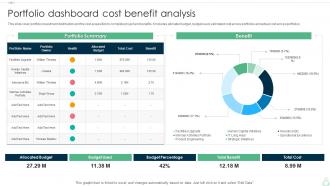 Portfolio Dashboard Cost Benefit Analysis
This slide cover portfolio investment distribution and the cost acquisition to complete project and benefits. It includes allocated budget, budget used, estimated cost across portfolios and actual cost across portfolios. Presenting our well structured Cost Benefit Analysis Of Software Licencing And Training. The topics discussed in this slide are Allocated Budget, Budget Used, Budget Percentage, Analysis. This is an instantly available PowerPoint presentation that can be edited conveniently. Download it right away and captivate your audience.
-
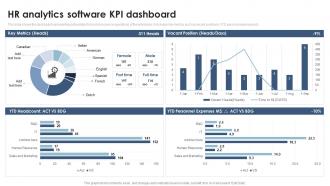 Hr Analytics Software KPI Dashboard Analyzing And Implementing HR Analytics In Enterprise
This slide shows the dashboard representing data related to human resource operations of the enterprise. It includes key metrics such as vacant positions, YTD personal expenses etc. Deliver an outstanding presentation on the topic using this Hr Analytics Software KPI Dashboard Analyzing And Implementing HR Analytics In Enterprise. Dispense information and present a thorough explanation of Analytics Software, KPI Dashboard using the slides given. This template can be altered and personalized to fit your needs. It is also available for immediate download. So grab it now.
-
 Business Suppliers Compliance KPI Dashboard
This slide shows compliance indicators for different categories of suppliers used for choosing suitable supplier. It include indicators like average procurement time, supplier classification and contract compliance for each category etc Presenting our well structured Business Suppliers Compliance KPI Dashboard. The topics discussed in this slide are Suppliers, Business, Compliance. This is an instantly available PowerPoint presentation that can be edited conveniently. Download it right away and captivate your audience.
-
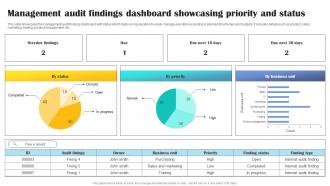 Management Audit Findings Dashboard Showcasing Priority And Status
This slide showcases the management audit findings dashboard with status which helps an organization to easily manage execution according to planned timeframes and budgets. It includes details such as product, sales, marketing, trading, product management, etc. Introducing our Management Audit Findings Dashboard Showcasing Priority And Status set of slides. The topics discussed in these slides are Status, Priority. This is an immediately available PowerPoint presentation that can be conveniently customized. Download it and convince your audience.
-
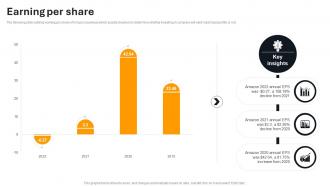 Earning Per Share Amazon Company Profile Ppt Infographic Template Styles CP SS
The following slide outlines earning per share of Amazon business which assists investors to determine whether investing in company will yield maximized profits or not. Present the topic in a bit more detail with this Earning Per Share Amazon Company Profile Ppt Infographic Template Styles CP SS Use it as a tool for discussion and navigation on Earning Per Share This template is free to edit as deemed fit for your organization. Therefore download it now.
-
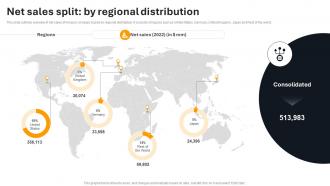 Net Sales Split By Regional Distribution Amazon Company Profile Ppt File Visual Aids CP SS
This slide outlines overview of net sales of Amazon company based on regional distribution. It consists of regions such as United States, Germany, United Kingdom, Japan and Rest of the world. Deliver an outstanding presentation on the topic using this Net Sales Split By Regional Distribution Amazon Company Profile Ppt File Visual Aids CP SS Dispense information and present a thorough explanation of Net Sales Split, Regional Distribution using the slides given. This template can be altered and personalized to fit your needs. It is also available for immediate download. So grab it now.
-
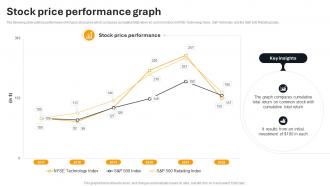 Stock Price Performance Graph Amazon Company Profile Ppt Show Gallery CP SS
The following slide outlines performance of Amazon stock price which compares cumulative total return on common stock in NYSE Technology Index, SandP 500 Index and the SandP 500 Retailing Index. Deliver an outstanding presentation on the topic using this Stock Price Performance Graph Amazon Company Profile Ppt Show Gallery CP SS Dispense information and present a thorough explanation of Stock Price Performance Graph using the slides given. This template can be altered and personalized to fit your needs. It is also available for immediate download. So grab it now.
-
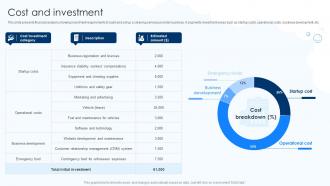 Cost And Investment Cleaning Business Startup Go To Market Strategy GTM SS
This slide presents financial analysis showing investment requirements to build and set up a cleaning services provider business. It segments investment areas such as startup costs, operational costs, business development, etc. Present the topic in a bit more detail with this Cost And Investment Cleaning Business Startup Go To Market Strategy GTM SS Use it as a tool for discussion and navigation on Operational Costs, Cost Breakdown This template is free to edit as deemed fit for your organization. Therefore download it now.
-
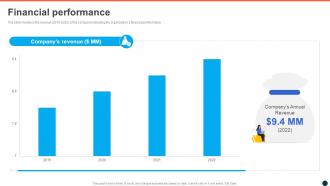 Financial Performance Parkbench Investor Funding Elevator Pitch Deck
The slide mentions the revenue 2019 2022 of the company indicating the organizations financial performance Deliver an outstanding presentation on the topic using this Financial Performance Parkbench Investor Funding Elevator Pitch Deck Dispense information and present a thorough explanation of Financial Performance using the slides given. This template can be altered and personalized to fit your needs. It is also available for immediate download. So grab it now.
-
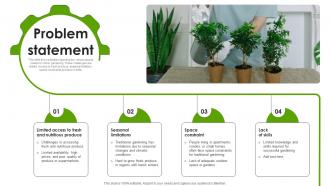 Problem Statement Indoor Gardening Systems Developing Company Fundraising Pitch Deck
This slide shows details regarding the various issues related to indoor gardening. These challenges are limited access to fresh produce, seasonal limitation, space constraints and lack of skills. Increase audience engagement and knowledge by dispensing information using Problem Statement Indoor Gardening Systems Developing Company Fundraising Pitch Deck. This template helps you present information on four stages. You can also present information on Space Constraint, Seasonal Limitations, Nutritious Produce using this PPT design. This layout is completely editable so personaize it now to meet your audiences expectations.
-
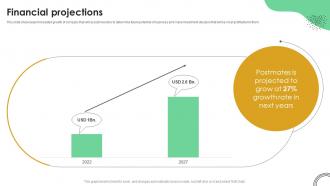 Financial Projections Online Food Ordering App Investor Funding Elevator Pitch Deck
This slide showcases forecasted growth of company that will assist investors to determine future potential of business and make investment decision that will be most profitable for them. Present the topic in a bit more detail with this Financial Projections Online Food Ordering App Investor Funding Elevator Pitch Deck. Use it as a tool for discussion and navigation on Financial Projections. This template is free to edit as deemed fit for your organization. Therefore download it now.
-
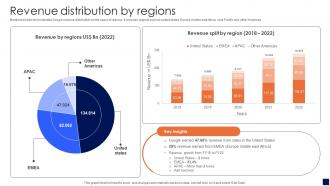 Revenue Distribution By Regions Smart Electronics Manufacturing Company Profile CP SS V
Mentioned slide demonstrates Google revenue distribution on the basis of regions. It includes regions such as united states, Europe middle east Africa, Asia Pacific and other Americas. Present the topic in a bit more detail with this Revenue Distribution By Regions Smart Electronics Manufacturing Company Profile CP SS V. Use it as a tool for discussion and navigation on Revenue Distribution, Regions. This template is free to edit as deemed fit for your organization. Therefore download it now.
-
 Performance overview ppt examples professional
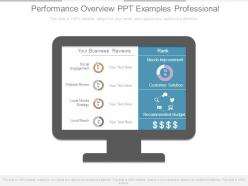
Presenting performance overview ppt examples professional. This is a performance overview ppt examples professional. This is a one stage process. The stages in this process are social engagement, website review, local mobile strategy, local reach, your business, reviews, rank, needs improvement, customer solution, recommended budget.
-
 Start stop infographics powerpoint guide
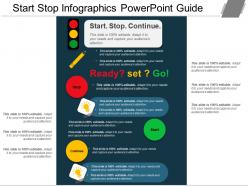
Presenting start-stop infographics PowerPoint guide PPT slide. Being vector based, the slides are completely editable. From choosing the background colors to modifying the entire layout, one has total freedom to customize the designing elements. Moreover, the slide is made up of high definition graphics, which does not restrain the slide to be depicted on screen of any size. The PPT is compatible with Google Slides, multiple software options, and format options too.
-
 Health and safety kpi dashboard showing patient satisfaction and lab test turnaround
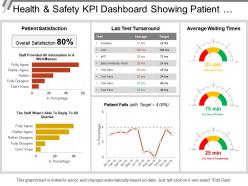
Presenting this set of slides with name - Health And Safety Kpi Dashboard Showing Patient Satisfaction And Lab Test Turnaround. This is a five stage process. The stages in this process are Health And Safety, Health And Security, Health And Protection.
-
 Change management process flow process modeling audit process cpb
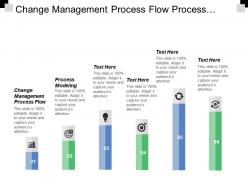
Presenting this set of slides with name - Change Management Process Flow Process Modeling Audit Process Cpb. This is an editable six stages graphic that deals with topics like Change Management Risks, Increasing Operational Efficiency, Expatriate Employee to help convey your message better graphically. This product is a premium product available for immediate download, and is 100 percent editable in Powerpoint. Download this now and use it in your presentations to impress your audience.
-
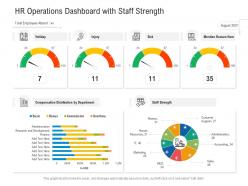 Hr operations dashboard with staff strength
Introducing our HR Operations Dashboard With Staff Strength set of slides. The topics discussed in these slides are Compensation Distribution By Department, Staff Strength. This is an immediately available PowerPoint presentation that can be conveniently customized. Download it and convince your audience.
-
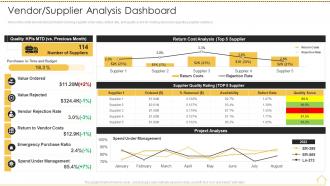 Risk analysis techniques vendor supplier analysis dashboard
Here in this slide we include Dashboard covering supplier order value, defect rate, and quality score for making decisions regarding supplier selection. Present the topic in a bit more detail with this Risk Analysis Techniques Vendor Supplier Analysis Dashboard. Use it as a tool for discussion and navigation on Value Ordered, Value Rejected, Vendor Rejection Rate, Return to Vendor Costs. This template is free to edit as deemed fit for your organization. Therefore download it now.
-
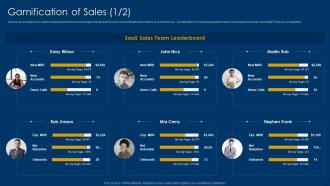 Gamification Of Sales Using Leaderboards And Rewards For Higher Conversions
Here is an example of a sales leaderboard which encourages the top performers and motivates the others to reach the top. Gamification in measuring performance via leaderboard can stimulate Friendly competition. Present the topic in a bit more detail with this Gamification Of Sales Using Leaderboards And Rewards For Higher Conversions. Use it as a tool for discussion and navigation on Gamification Of Sales. This template is free to edit as deemed fit for your organization. Therefore download it now.
-
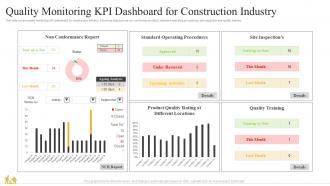 Quality Monitoring KPI Dashboard For Construction Industry
This slide covers quality monitoring KPI dashboard for construction industry. It involves data such as non conformance report, standard operating procedures, site inspection and quality training. Introducing our Quality Monitoring KPI Dashboard For Construction Industry set of slides. The topics discussed in these slides are Quality Monitoring, KPI Dashboard, Construction Industry. This is an immediately available PowerPoint presentation that can be conveniently customized. Download it and convince your audience.
-
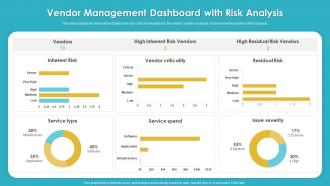 Vendor Management Dashboard With Risk Analysis
This slide contains the information related to the risks that are inherited but the vendors and the residuals of risk to know the position of the business. Introducing our Vendor Management Dashboard With Risk Analysis set of slides. The topics discussed in these slides are Inherent Risk, Service Type, Service Spend, Issue Severity. This is an immediately available PowerPoint presentation that can be conveniently customized. Download it and convince your audience.
-
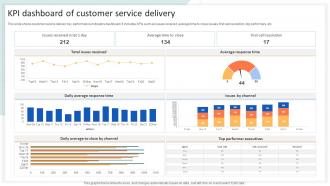 KPI Dashboard Snapshot Of Customer Service Delivery
This slide shows customer service delivery key performance indicators dashboard. It includes KPIs such as issues received, average time to close issues, first call resolution, top performers, etc. Introducing our KPI Dashboard Snapshot Of Customer Service Delivery set of slides. The topics discussed in these slides are Total Issues Received, Average Response Time, Issues By Channel. This is an immediately available PowerPoint presentation that can be conveniently customized. Download it and convince your audience.
-
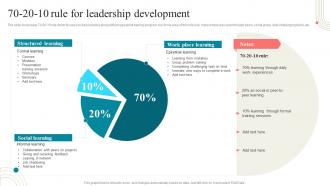 Business Development Training 70 20 10 Rule For Leadership Development Ppt Diagram Images
The slide showcases 70 20 10 rule which focuses on daily learning along with progessional training program. Key focus area of this rule is to make employees learn through peers, social group, daily challenging tasks, etc. Present the topic in a bit more detail with this Business Development Training 70 20 10 Rule For Leadership Development Ppt Diagram Images. Use it as a tool for discussion and navigation on Structured Learning, Work Place Learning, Social Learning. This template is free to edit as deemed fit for your organization. Therefore download it now.
-
 Evolution Guide Powerpoint Presentation Slides
This aptly crafted editable PPT deck contains twenty three slides. Our topic specific Evolution Guide Powerpoint Presentation Slides deck helps devise the topic with a clear approach. We offer a wide range of custom made slides with all sorts of relevant charts and graphs, overviews, topics subtopics templates, and analysis templates. Speculate, discuss, design or demonstrate all the underlying aspects with zero difficulty. This deck also consists creative and professional looking slides of all sorts to achieve the target of a presentation effectively. You can present it individually or as a team working in any company organization.
-
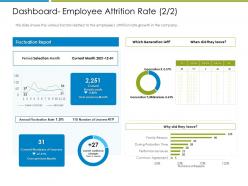 Dashboard employee attrition rate report increase employee churn rate it industry ppt ideas
This slide shows the various factors related to the employees attrition rate growth in the company. Present the topic in a bit more detail with this Dashboard Employee Attrition Rate Report Increase Employee Churn Rate It Industry Ppt Ideas. Use it as a tool for discussion and navigation on Fluctuation Report, Period Selection, Generation Left, Performance Issue. This template is free to edit as deemed fit for your organization. Therefore download it now.
-
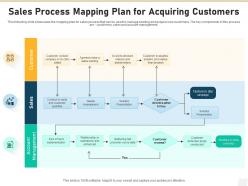 Sales process mapping plan for acquiring customers
This following slide showcases the mapping plan for sales process that can be used to manage existing and acquire new customers. The key components in this process are customers, sales and account management. Presenting our well structured Sales Process Mapping Plan For Acquiring Customers. The topics discussed in this slide are Account Management, Sales, Customer. This is an instantly available PowerPoint presentation that can be edited conveniently. Download it right away and captivate your audience.
-
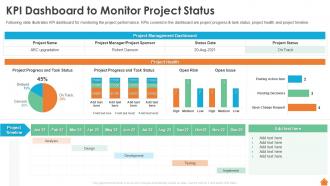 Kpi Dashboard To Monitor Project Status Financing Of Real Estate Project
Following slide illustrates KPI dashboard for monitoring the project performance. KPIs covered in the dashboard are project progress and task status, project health and project timeline. Present the topic in a bit more detail with this Kpi Dashboard To Monitor Project Status Financing Of Real Estate Project. Use it as a tool for discussion and navigation on KPI Dashboard To Monitor Project Status. This template is free to edit as deemed fit for your organization. Therefore download it now.
-
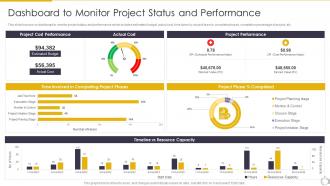 Dashboard To Monitor Project Status Performance Task Scheduling For Project Time Management
This slide focuses on dashboard to monitor project status and performance which includes estimated budget, actual cost, time taken by project team to complete phases, completion percentage of project, etc. Deliver an outstanding presentation on the topic using this Dashboard To Monitor Project Status Performance Task Scheduling For Project Time Management. Dispense information and present a thorough explanation of Dashboard, Performance, Completion using the slides given. This template can be altered and personalized to fit your needs. It is also available for immediate download. So grab it now.
-
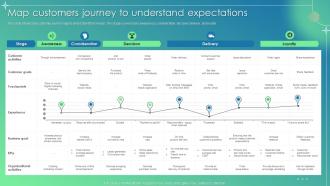 Customer Service Improvement Plan Map Customers Journey To Understand Expectations
This slide showcases customer journey map to understand their needs. The stages covered are awareness, consideration, decision, delivery, and loyalty. Present the topic in a bit more detail with this Customer Service Improvement Plan Map Customers Journey To Understand Expectations. Use it as a tool for discussion and navigation on Map Customers Journey, Understand Expectations, Customer Goals. This template is free to edit as deemed fit for your organization. Therefore download it now.


