Charts, Graphs PowerPoint Designs, Presentation Charts Designs & PPT Graphics
- Sub Categories
-
- Arrows and Targets
- Bullet and Text Slides
- Charts and Graphs
- Circular Cycle Diagrams
- Concepts and Shapes
- Custom Flat Designs
- Dashboards and Measuring
- Flow Process
- Funnels
- Gears
- Growth
- Harvey Balls
- Idea Innovation and Light Bulbs
- Leadership
- Linear Process Diagrams
- Magnifying Glass
- Misc Other Graphics
- Opportunity and Handshake
- Organization Charts
- Puzzles
- Pyramids
- Roadmaps and Timelines
- Silhouettes
- Steps
- Strategic Planning Analysis
- SWOT Analysis
- Tables and Matrix
- Teamwork
- Technology and Communication
- Venn Diagrams
- Visuals and Illustrations
-
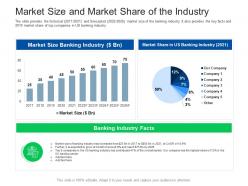 Market size and market share of the industry investor pitch presentation raise funds financial market
The slide provides the historical 2017 to 2021 and forecasted 2022 to 2026 market size of the banking industry. It also provides the key facts and 2019 market share of top companies in US banking industry. Present the topic in a bit more detail with this Market Size And Market Share Of The Industry Investor Pitch Presentation Raise Funds Financial Market. Use it as a tool for discussion and navigation on Market Size And Market Share Of The Industry. This template is free to edit as deemed fit for your organization. Therefore download it now.
-
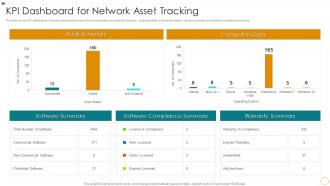 KPI Dashboard Snapshot For Network Asset Tracking
This slide covers KPI dashboard of network asset tracking report. It involves details such as audit summary, computers data, software summary, warranty summary and software compliance summary. Presenting our well structured KPI Dashboard Snapshot For Network Asset Tracking. The topics discussed in this slide are KPI Dashboard For Network Asset Tracking. This is an instantly available PowerPoint presentation that can be edited conveniently. Download it right away and captivate your audience.
-
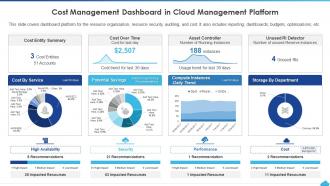 How To Manage Complexity In Multicloud Cost Management Dashboard In Cloud Management
This slide covers dashbord platform for the resources organization, resources security, auditing, and cost. It also includes reporting, dashbords, budgets, optimization, etc. Present the topic in a bit more detail with this how To Manage Complexity In Multicloud Cost Management Dashboard in Cloud Management. Use it as a tool for discussion and navigation On Cost Entity Summary, Cost Over Time, Asset Controller, Unused RI Detector. This Template is free to edit as demand fit for your organization. Therefore Dowmload it now.
-
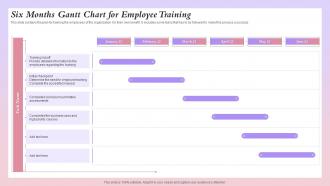 Six Months Gantt Chart For Employee Training
This slide contains the plan for training the employees of the organization for their own benefit. It includes some tasks that has to be followed to make this process a success. Introducing our Six Months Gantt Chart For Employee Training that is designed to showcase some of the vital components that will help you create timelines, roadmaps, and project plans. In addition, also communicate your project durations, milestones, tasks, subtasks, dependencies, and other attributes using this well-structured Six Months Gantt Chart For Employee Training template. You can also exhibit preeminence against time by deploying this easily adaptable slide to your business presentation. Our experts have designed this template in such a way that it is sure to impress your audience. Thus, download it and steer your project meetings, meetups, and conferences.
-
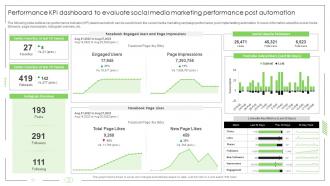 Performance KPI Dashboard To Evaluate Social Media Marketing Performance Post Automation
The following slide outlines key performance indicator KPI dashboard which can be used to track the social media marketing campaign performance, post implementing automation. It covers information about the social media followers, page impressions, instagram overview, etc.Deliver an outstanding presentation on the topic using this Performance KPI Dashboard To Evaluate Social Media Marketing Performance Post Automation. Dispense information and present a thorough explanation of Twitter Favorites, Instagram Overview, Media Followers using the slides given. This template can be altered and personalized to fit your needs. It is also available for immediate download. So grab it now.
-
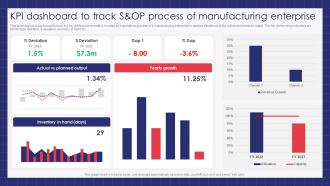 KPI Dashboard To Track S and OP Process Of Manufacturing Enterprise
This slide depicts a dashboard to track the key performance metrics in sales and operations process of a manufacturing enterprise to analyze deviations in the actual and planned output. The key performing indicators are percentage deviation, dollar deviation, inventory in hand etc. Presenting our well structured KPI Dashboard To Track S and OP Process Of Manufacturing Enterprise. The topics discussed in this slide are KPI Dashboard To Track, S and OP Process, Manufacturing Enterprise. This is an instantly available PowerPoint presentation that can be edited conveniently. Download it right away and captivate your audience.
-
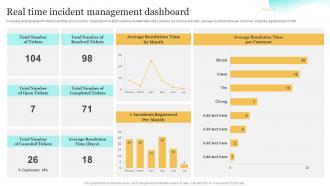 Real Time Incident Management Dashboard Upgrading Cybersecurity With Incident Response Playbook
Following slide illustrate KPI dashboard that can be used by organizations to track real time incident data. KPIs covered are number of tickets, average resolution time per customer, incidents registered per month. Deliver an outstanding presentation on the topic using this Real Time Incident Management Dashboard Upgrading Cybersecurity With Incident Response Playbook. Dispense information and present a thorough explanation of Management, Dashboard, Organizations using the slides given. This template can be altered and personalized to fit your needs. It is also available for immediate download. So grab it now.
-
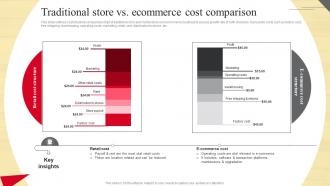 Traditional Store Vs Ecommerce Strategic Guide To Move Brick And Mortar Strategy SS V
This slide outlines cost structure comparison chart of traditional brick and mortar store and ecommerce business to assess growth rate of both channels. It presents costs such as factory cost, free shipping, warehousing, operating costs, marketing, retail, rent, distribution to stores, etc. Present the topic in a bit more detail with this Traditional Store Vs Ecommerce Strategic Guide To Move Brick And Mortar Strategy SS V. Use it as a tool for discussion and navigation on Traditional, Ecommerce, Cost. This template is free to edit as deemed fit for your organization. Therefore download it now.
-
 Emergent Strategy KPI Dashboard For Construction Industry
Following slide show casing the various construction business emergent strategy KPI which assist in increased capacity for change adaptation and the ability to act rapidly on new possibilities to gain an advantage. Introducing our Emergent Strategy KPI Dashboard For Construction Industry set of slides. The topics discussed in these slides are Emergent Strategy, KPI Dashboard, Construction Industry. This is an immediately available PowerPoint presentation that can be conveniently customized. Download it and convince your audience.
-
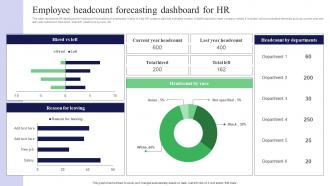 Employee Headcount Forecasting Dashboard For Hr
This slide represents HR dashboard for headcount forecasting of employees. It aims to help HR create a plan that indicates number of staff required to meet company needs. It includes various evaluated elements such as current year and last year headcount, total hired, total left, headcount by race, etc. Introducing our premium set of slides with Employee Headcount Forecasting Dashboard For Hr. Ellicudate the Two stages and present information using this PPT slide. This is a completely adaptable PowerPoint template design that can be used to interpret topics like Action Steps, Deliverables, Project Time. So download instantly and tailor it with your information.
-
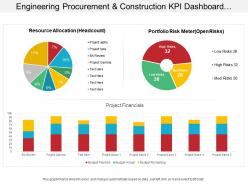 Engineering procurement and construction kpi dashboard having project financials and resource allocation
Presenting this set of slides with name - Engineering Procurement And Construction Kpi Dashboard Having Project Financials And Resource Allocation. This is a three stage process. The stages in this process are Engineering, Procurement And Construction, Construction Management, Engineering, Purchasing And Construction .
-
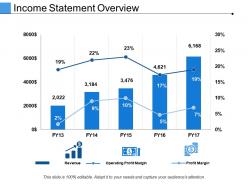 Income statement overview presentation portfolio
Presenting this set of slides with name - Income Statement Overview Presentation Portfolio. This is a five stage process. The stages in this process are Finance, Marketing, Bar, Planning, Growth.
-
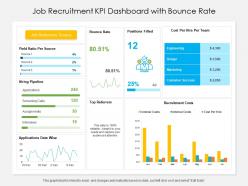 Job recruitment kpi dashboard with bounce rate
Presenting this set of slides with name Job Recruitment KPI Dashboard With Bounce Rate. The topics discussed in these slides are Bounce Rate, Job Reference Source, Positions Filled, Recruitment Costs, Top Referrers. This is a completely editable PowerPoint presentation and is available for immediate download. Download now and impress your audience.
-
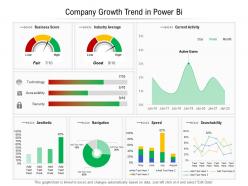 Company growth trend in power bi
Presenting this set of slides with name Company Growth Trend In Power Bi. The topics discussed in these slides are Aesthetic, Navigation, Searchability. This is a completely editable PowerPoint presentation and is available for immediate download. Download now and impress your audience.
-
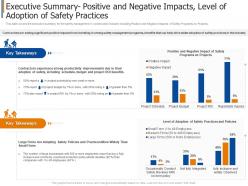 Executive summary positive and negative project safety management in the construction industry it
This slide covers the executive summary for the safety management in construction industry including Positive and Negative Impacts of Safety Programs on Projects. Deliver an outstanding presentation on the topic using this Executive Summary Positive And Negative Project Safety Management In The Construction Industry IT. Dispense information and present a thorough explanation of Budget, Project, Benefits, Improvements, Productivity using the slides given. This template can be altered and personalized to fit your needs. It is also available for immediate download. So grab it now.
-
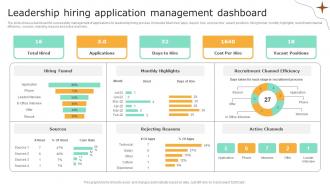 Leadership Hiring Application Management Dashboard
The slide shows a dashboard for successfully management of applications for leadership hiring process. It includes total hired, apps, days to hire, cost per hire, vacant positions, hiring funnel, monthly highlights, recruitment channel efficiency, sources, rejecting reasons and active channels. Introducing our Leadership Hiring Application Management Dashboard set of slides. The topics discussed in these slides are Applications, Cost Per Hire, Vacant Positions, Days To Hire. This is an immediately available PowerPoint presentation that can be conveniently customized. Download it and convince your audience.
-
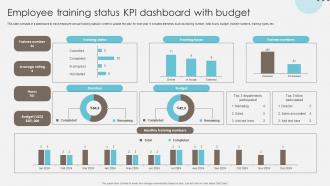 Employee Training Status KPI Dashboard With Budget
This slide consists of a dashboard to track employee annual training status in order to update the plan for next year. It includes elements such as training number, total hours, budget, trainee numbers, training types, etc. Presenting our well structured Employee Training Status KPI Dashboard With Budget. The topics discussed in this slide are Training Status, Budget, Employee Training. This is an instantly available PowerPoint presentation that can be edited conveniently. Download it right away and captivate your audience.
-
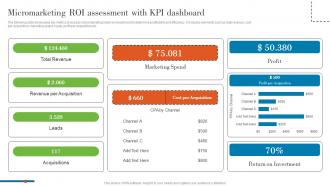 Micromarketing Roi Assessment With Kpi Dashboard Understanding Various Levels MKT SS V
The following slide showcases key metrics to assess micromarketing return on investment to determine profitability and efficiency. It includes elements such as total revenue, cost per acquisition, marketing spend, leads, profit per acquisition etc. Deliver an outstanding presentation on the topic using this Micromarketing Roi Assessment With Kpi Dashboard Understanding Various Levels MKT SS V. Dispense information and present a thorough explanation of Total Revenue, Revenue Per Acquisition using the slides given. This template can be altered and personalized to fit your needs. It is also available for immediate download. So grab it now.
-
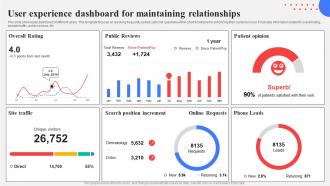 User Experience Dashboard For Maintaining Relationships Response Plan For Increasing Customer
This slide showcases dashboard of different users. This template focuses on resolving frequently asked customer questions within short timeframe for enhancing their customer bond. It includes information related to overall rating,website traffic,public reviews,etc.Present the topic in a bit more detail with this User Experience Dashboard For Maintaining Relationships Response Plan For Increasing Customer. Use it as a tool for discussion and navigation on Overall Rating,Public Reviews,Patient Opinion. This template is free to edit as deemed fit for your organization. Therefore download it now.
-
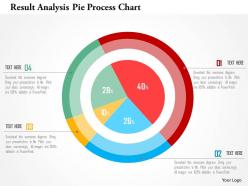 Result analysis pie process chart flat powerpoint design
Widescreen output without the problem of pixilation. 100 percent editable content. Easy inclusion and exclusion of PPT icons, colors, orientation, etc. Personalize the content with company name and logo. Ease of inclusion or exclusion of details in slide background. Ease of download and compatibility with varied software. Significantly useful PowerPoint slide icons by financial analysts, students, teachers and banking professionals.
-
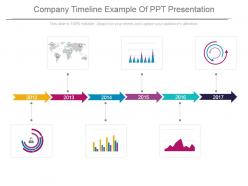 Company timeline example of ppt presentation
Presenting company timeline example of ppt presentation. This is a company timeline example of ppt presentation. This is a six stage process. The stages in this process are arrow, business, process, marketing, success, planning.
-
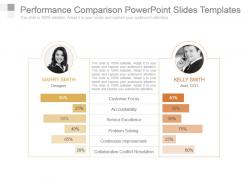 Performance comparison powerpoint slides templates
Presenting performance comparison powerpoint slides templates. This is a performance comparison powerpoint slides templates. This is a two stage process. The stages in this process are customer focus, accountability, service excellence, problem solving, continuous improvement, collaborative conflict resolution.
-
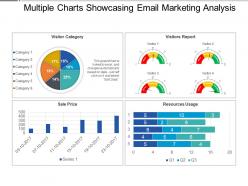 Multiple charts showcasing email marketing analysis presentation slides
Introducing multiple charts showcasing email marketing analysis PPT slide. This is exclusively codified PPT design scheme which is quite suitable for business managers, marketing experts etc. This PPT graphic can be acclimating with divergent softwares and Google Slides. This Presentation template can be customizable in to other file formats like PDF or JPG. Offers an alterable designs, forms, colors, contents etc. Also provides an option to add company name or emblem with this PPT template.
-
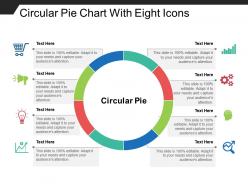 Circular pie chart with eight icons
Presenting circular pie chart with eight icons. This is a circular pie chart with eight icons. This is a eight stage process. The stages in this process are customer insight, consumer insight, customer experience.
-
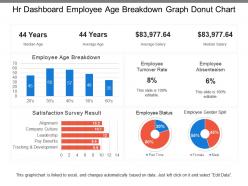 Hr dashboard employee age breakdown graph donut chart
Presenting this set of slides with name - Hr Dashboard Employee Age Breakdown Graph Donut Chart. This is a four stage process. The stages in this process are Hr Dashboard, Human Resource Dashboard, Hr Kpi.
-
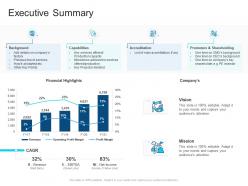 Corporate profiling executive summary ppt designs
Deliver an outstanding presentation on the topic using this Corporate Profiling Executive Summary Ppt Designs. Dispense information and present a thorough explanation of Background, Capabilities, Accreditation using the slides given. This template can be altered and personalized to fit your needs. It is also available for immediate download. So grab it now.
-
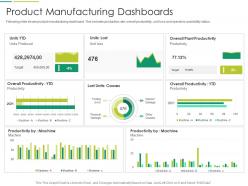 Product manufacturing dashboards it transformation at workplace ppt rules
Following slide shows product manufacturing dashboard. This includes production rate, overall productivity, unit loss and operators availability status. Present the topic in a bit more detail with this Product Manufacturing Dashboards IT Transformation At Workplace Ppt Rules. Use it as a tool for discussion and navigation on Product Manufacturing Dashboards. This template is free to edit as deemed fit for your organization. Therefore download it now.
-
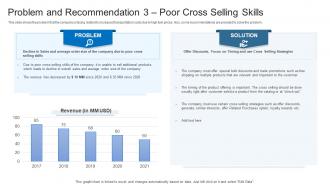 Latest Trends Boost Profitability Problem And Recommendation 3 Poor Cross Selling Skills
This slide shows the problem that the company is facing related to increased transportation costs due to high fuel prices. Also, some recommendations are provided to solve the problem. Deliver an outstanding presentation on the topic using this Latest Trends Boost Profitability Problem And Recommendation 3 Poor Cross Selling Skills. Dispense information and present a thorough explanation of Problem, Solution, Revenue using the slides given. This template can be altered and personalized to fit your needs. It is also available for immediate download. So grab it now.
-
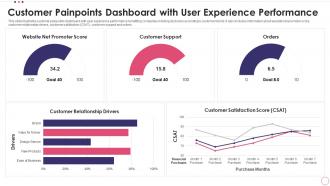 Customer Painpoints Dashboard Snapshot With User Experience Performance
This slide illustrates customer painpoints dashboard snapshot with user experience performance benefiting companies in taking decisions according to customer trends. It also includes information about website net promoter score, customer relationship drivers, customer satisfaction CSAT, customer support and orders. Presenting our well structured Customer Painpoints Dashboard With User Experience Performance. The topics discussed in this slide are Customer Painpoints Dashboard With User Experience Performance. This is an instantly available PowerPoint presentation that can be edited conveniently. Download it right away and captivate your audience.
-
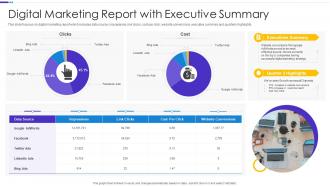 Digital Marketing Report With Executive Summary
This slide focuses on digital marketing report which includes data source, impressions, link clicks, cost per click, website conversions, executive summary and quarterly highlights. Introducing our Digital Marketing Report With Executive Summary set of slides. The topics discussed in these slides are Executives Summary, Impressions, Website Conversions. This is an immediately available PowerPoint presentation that can be conveniently customized. Download it and convince your audience.
-
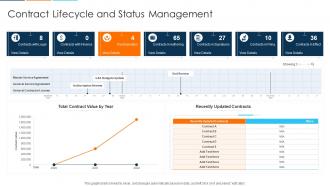 Contract Lifecycle And Status Management
Presenting our well structured Contract Lifecycle And Status Management. The topics discussed in this slide are Contract Lifecycle And Status Management. This is an instantly available PowerPoint presentation that can be edited conveniently. Download it right away and captivate your audience.
-
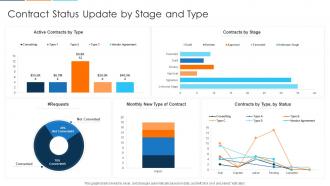 Contract Status Update By Stage And Type
Introducing our Contract Status Update By Stage And Type set of slides. The topics discussed in these slides are Contract Status Update By Stage And Type. This is an immediately available PowerPoint presentation that can be conveniently customized. Download it and convince your audience.
-
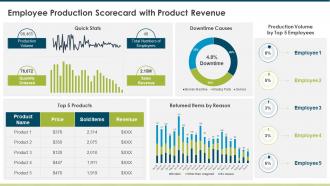 Employee Production Scorecard With Product Revenue
Present the topic in a bit more detail with this Employee Production Scorecard With Product Revenue. Use it as a tool for discussion and navigation on Employee, Production, Scorecard. This template is free to edit as deemed fit for your organization. Therefore download it now.
-
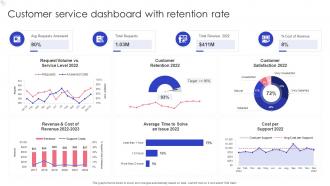 Customer Service Dashboard With Retention Rate
Presenting our well structured Customer Service Dashboard With Retention Rate. The topics discussed in this slide are Service Level, Customer Retention, Customer Satisfaction. This is an instantly available PowerPoint presentation that can be edited conveniently. Download it right away and captivate your audience.
-
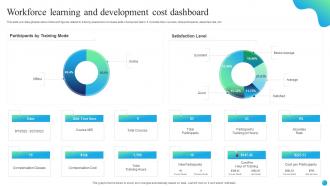 Workforce Learning And Development Cost Dashboard
This slide provides glimpse about facts and figures related to training sessions to increase skills of acquired talent. It includes total courses, total participants, absentee rate, etc.Presenting our well structured Workforce Learning And Development Cost Dashboard. The topics discussed in this slide are Training Mode, Satisfaction Level, Total Participants. This is an instantly available PowerPoint presentation that can be edited conveniently. Download it right away and captivate your audience.
-
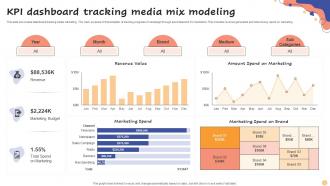 KPI Dashboard Tracking Media Mix Modeling
This slide showcase dashboard tracking media marketing. The main purpose of this template is tracking progress of campaign through advertisement for marketers. This includes revenue generated and total money spent on marketing.Introducing our KPI Dashboard Tracking Media Mix Modeling set of slides. The topics discussed in these slides are Revenue Value, Marketing Spend, Marketing Spend This is an immediately available PowerPoint presentation that can be conveniently customized. Download it and convince your audience.
-
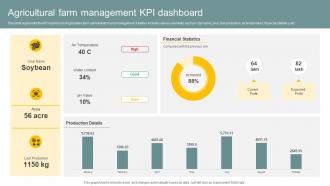 Agricultural Farm Management KPI Dashboard
This slide represents the KPI dashboard of agriculture farm administration and management. It further includes various elements such as crop name, area, last production, air temperature, financial statistics, etc.Presenting our well structured Agricultural Farm Management KPI Dashboard. The topics discussed in this slide are Agricultural, Management KPI Dashboard. This is an instantly available PowerPoint presentation that can be edited conveniently. Download it right away and captivate your audience.
-
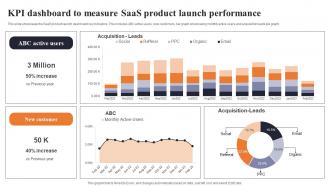 KPI Dashboard To Measure Saas Product Launch Performance
This slide showcases the SaaS product launch dashboard key indicators. This includes ABC active users, new customers, bar graph showcasing monthly active users and acquisition leads pie graph. Introducing our KPI Dashboard To Measure Saas Product Launch Performance set of slides. The topics discussed in these slides are Product Launch, Performance. This is an immediately available PowerPoint presentation that can be conveniently customized. Download it and convince your audience.
-
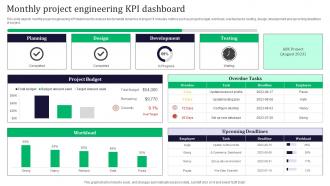 Monthly Project Engineering KPI Dashboard
This slide depicts monthly project engineering KPI dashboard to analyse fundamental dynamics of project. It includes metrics such as project budget, workload, overdue tasks, testing, design, development and upcoming deadlines of project. Introducing our Monthly Project Engineering KPI Dashboard set of slides. The topics discussed in these slides are Planning, Development. This is an immediately available PowerPoint presentation that can be conveniently customized. Download it and convince your audience.
-
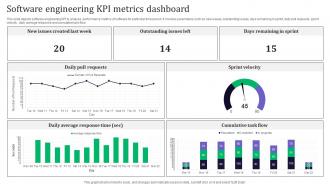 Software Engineering KPI Metrics Dashboard
This slide depicts software engineering KPI to analyse performance metrics of software for particular time period. It involves parameters such as new issues, outstanding issues, days remaining in sprint, daily pull requests, sprint velocity, daily average response and cumulative task flow. Presenting our well structured Software Engineering KPI Metrics Dashboard. The topics discussed in this slide are New Issues Created Last, Outstanding Issues Left.This is an instantly available PowerPoint presentation that can be edited conveniently. Download it right away and captivate your audience.
-
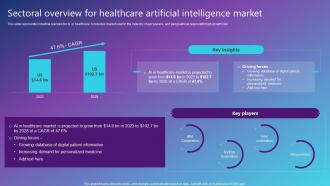 Sectoral Overview For Healthcare Artificial Intelligence Best AI Solutions Used By Industries AI SS V
This slide represents industrial overview for AI in healthcare. It includes market size for the industry, major players, and geographical region with high growth rate. Deliver an outstanding presentation on the topic using this Sectoral Overview For Healthcare Artificial Intelligence Best AI Solutions Used By Industries AI SS V. Dispense information and present a thorough explanation of Sectoral Overview, Healthcare Artificial Intelligence using the slides given. This template can be altered and personalized to fit your needs. It is also available for immediate download. So grab it now.
-
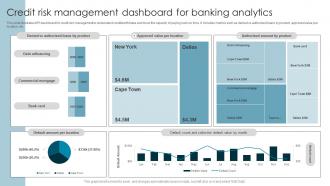 Credit Risk Management Dashboard For Banking Analytics
This slide illustrates KPI dashboard for credit risk management to understand creditworthiness and know the capacity of paying back on time. It includes metrics such as denied vs authorized loans by product, approved value per location, etc. Introducing our Credit Risk Management Dashboard For Banking Analytics set of slides. The topics discussed in these slides are Management, Dashboard, Analytics. This is an immediately available PowerPoint presentation that can be conveniently customized. Download it and convince your audience.
-
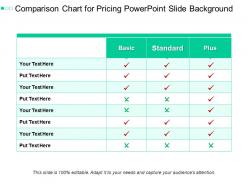 Comparison chart for pricing powerpoint slide background
Presenting comparison chart for pricing powerpoint slide background. This is a comparison chart for pricing powerpoint slide background. This is a three stage process. The stages in this process are comparison chart, comparison table, comparison matrix.
-
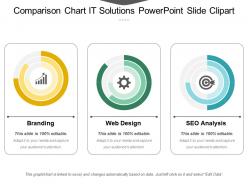 Comparison chart it solutions powerpoint slide clipart
Presenting our comparison chart it solutions PowerPoint slide clipart. This PPT display can be used to represent business it solutions in an approachable way. All the components used here are fully editable by means of color, shape, and orientation, font shape, font type, font size, and text. This PPT plan can be used with Google Slides and can be adjusted in any PowerPoint software. These high-quality graphics can be projected on widescreen forecasts and are available in both standard 4:3, widescreen format 16:9 after downloading.
-
 Upward trend icon ppt slide
Presenting this set of slides with name - Upward Trend Icon Ppt Slide. This is a one stage process. The stages in this process are Upward Trends, Uptrends, Upward Arrow, Growth.
-
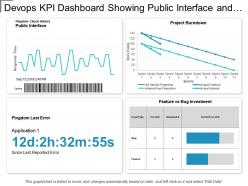 Devops kpi dashboard showing public interface and project burndown
Presenting this set of slides with name - Devops Kpi Dashboard Showing Public Interface And Project Burndown. This is a four stage process. The stages in this process are Development And Operations, Devops.
-
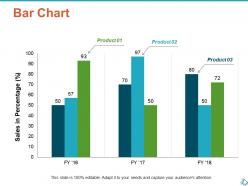 Bar chart finance ppt show infographic template
Presenting this set of slides with name - Bar Chart Finance Ppt Show Infographic Template. This is a three stage process. The stages in this process are Finance, Analysis, Business, Investment, Marketing.
-
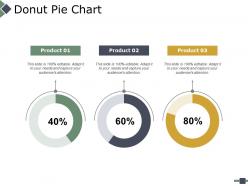 Donut pie chart ppt powerpoint presentation file infographics
Presenting this set of slides with name - Donut Pie Chart Ppt Powerpoint Presentation File Infographics. This is a three stage process. The stages in this process are Percentage, Product, Business, Management, Marketing.
-
 Survey results of customer satisfaction
Presenting this set of slides with name Survey Results Of Customer Satisfaction. The topics discussed in these slides are Very Satisfied, Satisfied, Unsatisfied, Neutral. This is a completely editable PowerPoint presentation and is available for immediate download. Download now and impress your audience.
-
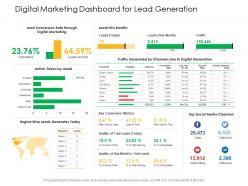 Digital marketing dashboard for lead generation
Presenting this set of slides with name Digital Marketing Dashboard For Lead Generation. The topics discussed in these slides are Digital Marketing, Digital Generation, Corporate. This is a completely editable PowerPoint presentation and is available for immediate download. Download now and impress your audience.
-
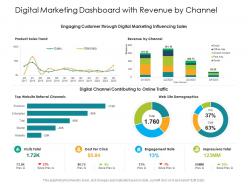 Digital marketing dashboard with revenue by channel
Presenting this set of slides with name Digital Marketing Dashboard With Revenue By Channel. The topics discussed in these slides are Engagement Rate, Revenue, Impressions Total. This is a completely editable PowerPoint presentation and is available for immediate download. Download now and impress your audience.
-
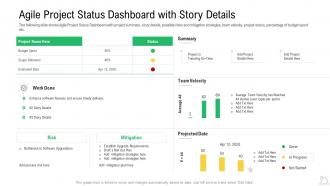 Agile project status agile maintenance reforming tasks ppt infographics show
The following slide shows Agile Project Status Dashboard with project summary, story details, possible risks and mitigation strategies, team velocity, project status, percentage of budget spent etc. Present the topic in a bit more detail with this Agile Project Status Agile Maintenance Reforming Tasks Ppt Infographics Show. Use it as a tool for discussion and navigation on Budget, Estimated, Team. This template is free to edit as deemed fit for your organization. Therefore download it now.
-
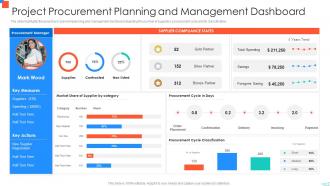 Project Procurement Planning And Management Dashboard
The slide highlights the project procurement planning and management dashboard depicting the number of suppliers, procurement cycle and its classification. Presenting our well structured Project Procurement Planning And Management Dashboard. The topics discussed in this slide are Procurement Cycle Classification, Procurement Cycle In Days, Market Share. This is an instantly available PowerPoint presentation that can be edited conveniently. Download it right away and captivate your audience.
-
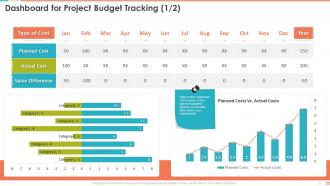 Dashboard For Project Budget Tracking Project Management Bundle
Deliver an outstanding presentation on the topic using this Dashboard For Project Budget Tracking Project Management Bundle. Dispense information and present a thorough explanation of Type Of Cost, Planned Cost, Actual Cost, Value Difference using the slides given. This template can be altered and personalized to fit your needs. It is also available for immediate download. So grab it now.
-
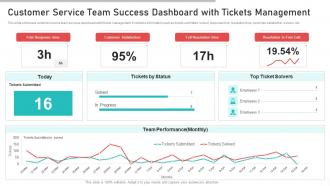 Customer Service Team Success Dashboard With Tickets Management
This slide showcase customer service team success dashboard with tickets management. It contains information such as tickets submitted, solved, response time, resolution time, customer satisfaction, solvers, etc. Introducing our Customer Service Team Success Dashboard With Tickets Management set of slides. The topics discussed in these slides are Customer Satisfaction, Full Resolution Time, Resolution In First Call. This is an immediately available PowerPoint presentation that can be conveniently customized. Download it and convince your audience.
-
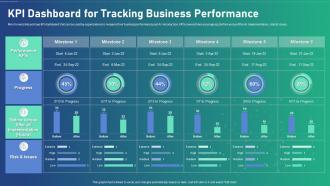 Ai Transformation Playbook Kpi Dashboard For Tracking Business Performance
Mentioned slide portrays KPI dashboard that can be used by organizations to measure their business performance post AI introduction. KPIS covered here are progress, Before versus After AI Implementation, risks and issues.Present the topic in a bit more detail with this Ai Transformation Playbook Kpi Dashboard For Tracking Business Performance Use it as a tool for discussion and navigation on KPI Dashboard For Tracking Business Performance This template is free to edit as deemed fit for your organization. Therefore download it now.
-
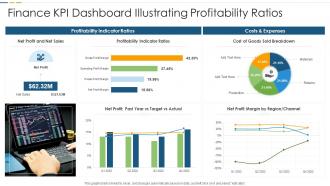 Finance KPI Dashboard Illustrating Profitability Ratios
Presenting our well structured Finance KPI Dashboard Illustrating Profitability Ratios. The topics discussed in this slide are Profitability Indicator Ratios, Costs And Expenses, Profitability Indicator Ratios. This is an instantly available PowerPoint presentation that can be edited conveniently. Download it right away and captivate your audience.
-
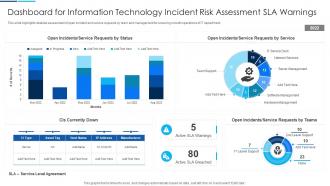 Dashboard For Information Technology Incident Risk Assessment SLA Warnings
This slide highlights detailed assessment of open incident and service requests by team and management for ensuring smooth operations of IT department. Presenting our well structured Dashboard For Information Technology Incident Risk Assessment SLA Warnings. The topics discussed in this slide are Dashboard For Information Technology Incident Risk Assessment SLA Warnings. This is an instantly available PowerPoint presentation that can be edited conveniently. Download it right away and captivate your audience.
-
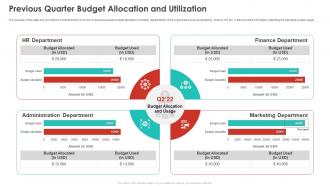 Quarterly Budget Analysis Of Business Organization Previous Quarter Budget Allocation And Utilization
The purpose of this slide is to provide the comprehensive overview of pervious quarter budget allocation to multiple departments of the organization such as marketing, finance, HR etc. It also provides information regarding the allocated budget usage. Deliver an outstanding presentation on the topic using this Quarterly Budget Analysis Of Business Organization Previous Quarter Budget Allocation And Utilization. Dispense information and present a thorough explanation of Marketing Department, Administration Department, Finance Department using the slides given. This template can be altered and personalized to fit your needs. It is also available for immediate download. So grab it now.
-
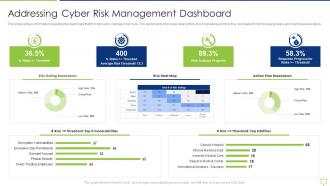 Addressing Cyber Risk Management Dashboard Enabling It Intelligence Framework
This slide portrays information regarding the dashboard that firm will use to manage cyber risks. The dashboard will provide clear picture of risk prevailing and how they are treated to technical engineers and board level executives.Present the topic in a bit more detail with this Addressing Cyber Risk Management Dashboard Enabling It Intelligence Framework Use it as a tool for discussion and navigation on Addressing Cyber Risk Management Dashboard This template is free to edit as deemed fit for your organization. Therefore download it now.


