Charts, Graphs PowerPoint Designs, Presentation Charts Designs & PPT Graphics
- Sub Categories
-
- Arrows and Targets
- Bullet and Text Slides
- Charts and Graphs
- Circular Cycle Diagrams
- Concepts and Shapes
- Custom Flat Designs
- Dashboards and Measuring
- Flow Process
- Funnels
- Gears
- Growth
- Harvey Balls
- Idea Innovation and Light Bulbs
- Leadership
- Linear Process Diagrams
- Magnifying Glass
- Misc Other Graphics
- Opportunity and Handshake
- Organization Charts
- Puzzles
- Pyramids
- Roadmaps and Timelines
- Silhouettes
- Steps
- Strategic Planning Analysis
- SWOT Analysis
- Tables and Matrix
- Teamwork
- Technology and Communication
- Venn Diagrams
- Visuals and Illustrations
-
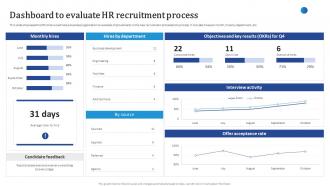 Dashboard To Evaluate HR Recruitment Process Streamlining HR Recruitment Process
This slide showcases the KPIs that would help a business organization to evaluate improvements in the new recruitment and selection process. It includes hires per month, hires by department, etc. Deliver an outstanding presentation on the topic using this Dashboard To Evaluate HR Recruitment Process Streamlining HR Recruitment Process. Dispense information and present a thorough explanation of Objectives, Interview Activity, Offer Acceptance using the slides given. This template can be altered and personalized to fit your needs. It is also available for immediate download. So grab it now.
-
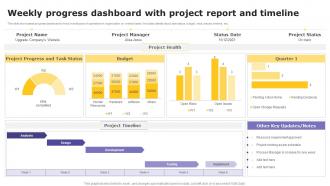 Weekly Progress Dashboard With Project Report And Timeline
This slide showcases progress dashboard to track overall pace of operations in organization on weekly basis. It includes details about task status, budget, risks, issues, timeline, etc. Introducing our Weekly Progress Dashboard With Project Report And Timeline set of slides. The topics discussed in these slides are Progress, Report, Timeline. This is an immediately available PowerPoint presentation that can be conveniently customized. Download it and convince your audience.
-
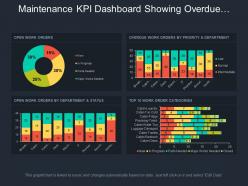 Maintenance kpi dashboard showing overdue work orders by priority and department
Presenting this set of slides with name - Maintenance Kpi Dashboard Showing Overdue Work Orders By Priority And Department. This is a four stage process. The stages in this process are Maintenance, Preservation, Conservation.
-
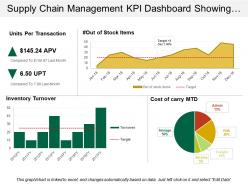 Supply chain management kpi dashboard showing units per transaction
Presenting predesigned Supply Chain Management KPI Dashboard Showing Warehouse Operating Costs PPT slide. Download of the template design is simple. You can modify the layout font type, font size, colors and the background as per needs. Template slide is fully flexible with Google Slides and other online software’s. You can alter the design using the instructional slides provided with the template. You can remove the watermark with your brand name, trademark, signature or logo. You can save the template into PNG or JPEG formats. Supreme quality layouts are used to create this template which is editable in PowerPoint. Sample content can be replaced with your presentation content.
-
 Transportation kpi dashboard snapshot showing fleet delivery status loading time and weight
Presenting transportation KPI dashboard snapshot showing fleet delivery status loading time and weight PPT slide. Simple data input with linked Excel chart, just right click to input values. This PowerPoint theme is fully supported by Google slides. Picture quality of these slides does not change even when project on large screen. Fast downloading speed and formats can be easily changed to JPEG and PDF applications. This template is suitable for marketing, sales persons, business managers and entrepreneurs.
-
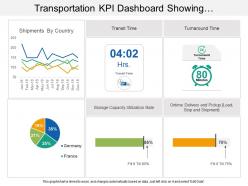 Transportation kpi dashboard showing shipments by country and transit time
Presenting transportation KPI Dashboard showing shipments by country and transit time PPT slide. This deck offers you plenty of space to put in titles and subtitles. This template is Excel linked just right click to input your information. High resolution based layout, does not change the image even after resizing. This presentation icon is fully compatible with Google slides. Quick downloading speed and simple editing options in color text and fonts.PPT icons can easily be changed into JPEG and PDF applications
-
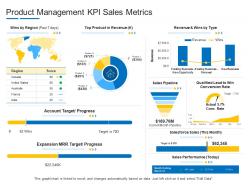 Product management kpi sales metrics product channel segmentation ppt summary
Deliver an outstanding presentation on the topic using this Product Management KPI Sales Metrics Product Channel Segmentation Ppt Summary. Dispense information and present a thorough explanation of Revenue, Sales Performance, Account Target, Progress, Sales Pipeline using the slides given. This template can be altered and personalized to fit your needs. It is also available for immediate download. So grab it now.
-
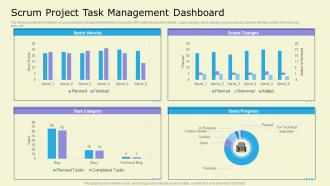 Scrum Project Task Management Dashboard
The following slide demonstrates scrum project task management dashboard. It includes information about sprint velocity, scope changes, tasks category, tasks progress, planned, finished, added, removed, bug, story, etc. Presenting our well structured Scrum Project Task Management Dashboard. The topics discussed in this slide are Scrum Project, Task Management, Dashboard. This is an instantly available PowerPoint presentation that can be edited conveniently. Download it right away and captivate your audience.
-
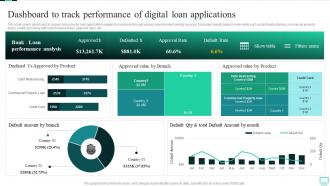 Dashboard To Track Performance Of Digital Loan Applications Omnichannel Banking Services
This slide covers dashboard to assess outcomes for loan applications applied by customer through various omnichannel banking services. It includes results based on elements such as debt restructuring, commercial property loans, credit card along with branch based loans, approval rates, etc. Deliver an outstanding presentation on the topic using this Dashboard To Track Performance Of Digital Loan Applications Omnichannel Banking Services. Dispense information and present a thorough explanation of Performance Analysis, Product, Dashboard using the slides given. This template can be altered and personalized to fit your needs. It is also available for immediate download. So grab it now.
-
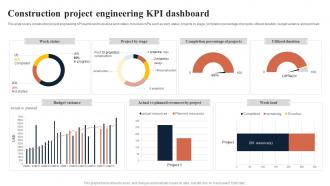 Construction Project Engineering KPI Dashboard
This slide covers construction project engineering KPI dashboard to analyse work status. It involves KPIs such as work status, projects by stage, completion percentage of projects, utilized duration, budget variance and workload. Introducing our Construction Project Engineering KPI Dashboard set of slides. The topics discussed in these slides are Work Status, Project By Stage, Utilized Duration. This is an immediately available PowerPoint presentation that can be conveniently customized. Download it and convince your audience.
-
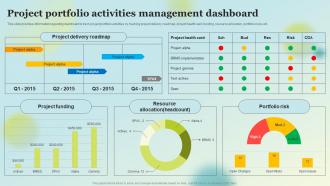 Project Portfolio Activities Management Dashboard Stakeholders Involved In Project Coordination
This slide provides information regarding dashboard to track project portfolio activities by tracking project delivery roadmap, project health card, funding, resource allocation, portfolio risks, etc. Deliver an outstanding presentation on the topic using this Project Portfolio Activities Management Dashboard Stakeholders Involved In Project Coordination. Dispense information and present a thorough explanation of Project, Activities, Management using the slides given. This template can be altered and personalized to fit your needs. It is also available for immediate download. So grab it now.
-
 Learning And Development Cost Analysis Dashboard
This slide showcases a dashboard for cost analysis of learning and development. It also includes key indicators such as total and unique trained, total invited, training cost, cost YTD, cost per employee, expensive programs, etc. Presenting our well structured Learning And Development Cost Analysis Dashboard. The topics discussed in this slide are Business, Vertical, Location. This is an instantly available PowerPoint presentation that can be edited conveniently. Download it right away and captivate your audience.
-
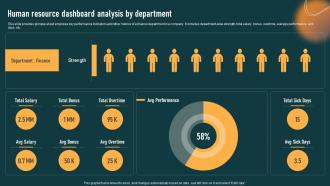 Human Resource Dashboard Analysis HR Recruitment Planning Stages
This slide provides glimpse about employee key performance indicators and other metrics of a finance department in a company. It includes department wise strength, total salary, bonus, overtime, average performance, sick days, etc.Deliver an outstanding presentation on the topic using this Human Resource Dashboard Analysis HR Recruitment Planning Stages. Dispense information and present a thorough explanation of Human Resource, Dashboard Analysis Department using the slides given. This template can be altered and personalized to fit your needs. It is also available for immediate download. So grab it now.
-
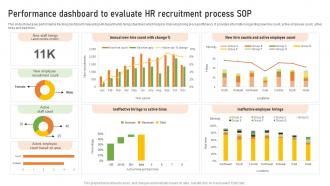 Performance Dashboard To Evaluate HR Recruitment Process Sop
This slide showcases performance tracking dashboard measuring HR departments hiring objectives which helps in improving hiring process efficiency. It provides information regarding new hire count, active employee count, active hires and bad hires. Introducing our Performance Dashboard To Evaluate HR Recruitment Process Sop set of slides. The topics discussed in these slides are Ineffective Employee Hirings, Active Employee Count, Recruitment Process. This is an immediately available PowerPoint presentation that can be conveniently customized. Download it and convince your audience.
-
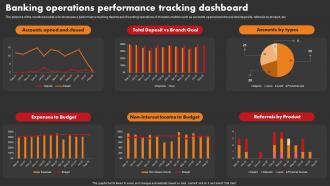 Banking Operations Performance Tracking Dashboard Strategic Improvement In Banking Operations
The purpose of the mentioned slide is to showcase a performance tracking dashboard of banking operations. It includes metrics such as accounts opened and closed, total deposits, referrals by product, etc. Present the topic in a bit more detail with this Banking Operations Performance Tracking Dashboard Strategic Improvement In Banking Operations. Use it as a tool for discussion and navigation on Operations, Performance, Dashboard. This template is free to edit as deemed fit for your organization. Therefore download it now.
-
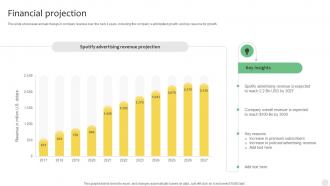 Financial Projection Digital Music Platform Business Model
This slide showcases annual change in company revenue over the next 4 years, including the companys anticipated growth, and key reasons for growth. Present the topic in a bit more detail with this Financial Projection Digital Music Platform Business Model Use it as a tool for discussion and navigation on Spotify Advertising, Revenue Projection This template is free to edit as deemed fit for your organization. Therefore download it now.
-
 Guide Of Industrial Digital Transformation KPI Dashboard To Assess Sales Performance
This slide covers KPI dashboard to analyze sales performance of retail store. It involves details such as total sales revenue, number of customers, average transaction price and average unit per customer. Present the topic in a bit more detail with this Guide Of Industrial Digital Transformation KPI Dashboard To Assess Sales Performance. Use it as a tool for discussion and navigation on KPI Dashboard, Assess Sales Performance, Transaction Price, Sales Revenue. This template is free to edit as deemed fit for your organization. Therefore download it now.
-
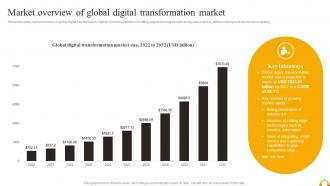 Guide Of Industrial Digital Transformation Market Overview Of Global Digital Transformation Market
This slide covers market overview of global digital transformation market. It involves evolution of cutting edge technologies such as big data analytics, artificial intelligence and cloud computing. Deliver an outstanding presentation on the topic using this Guide Of Industrial Digital Transformation Market Overview Of Global Digital Transformation Market. Dispense information and present a thorough explanation of Market Overview, Global Digital Transformation Market, Artificial Intelligence, Cloud Computing using the slides given. This template can be altered and personalized to fit your needs. It is also available for immediate download. So grab it now.
-
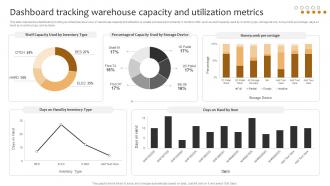 Dashboard Tracking Warehouse Capacity And Utilization Implementing Cost Effective Warehouse Stock
This slide represents a dashboard providing an enterprise-level view of warehouse capacity and utilization to enable process improvements. It monitors KPIs such as shelf capacity used by inventory type, storage device, honeycomb percentage, days on hand by inventory type, and by items. Present the topic in a bit more detail with this Dashboard Tracking Warehouse Capacity And Utilization Implementing Cost Effective Warehouse Stock. Use it as a tool for discussion and navigation on Dashboard Tracking Warehouse, Capacity And Utilization. This template is free to edit as deemed fit for your organization. Therefore download it now.
-
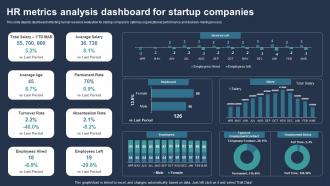 HR Metrics Analysis Dashboard For Startup Companies
This slide depicts dashboard reflecting human resource evaluation for startup company to optimize organizational performance and decision making process. Presenting our well structured HR Metrics Analysis Dashboard For Startup Companies. The topics discussed in this slide are Average Age, Permanent Rate, Absenteeism Rate, Turnover Rate. This is an instantly available PowerPoint presentation that can be edited conveniently. Download it right away and captivate your audience.
-
 Inventory Audit Dashboard For Analyzing Supplier Performance
This slide illustrates KPI or dashboard of inventory audit and includes metrics preceding month until stock outage, inventory check, in stock, returns, etc. Presenting our well structured Inventory Audit Dashboard For Analyzing Supplier Performance. The topics discussed in this slide are Inventory Check, In Stock, Monthly Return Rate. This is an instantly available PowerPoint presentation that can be edited conveniently. Download it right away and captivate your audience.
-
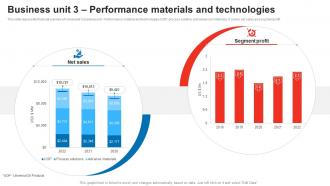 Business Unit 3 Performance Materials And Technologies Honeywell Company Profile CP SS
This slide represents financial overview of Honeywells business unit Performance material and technologies UOP, process solution, and advanced materials. It covers net sales and segment profit. Deliver an outstanding presentation on the topic using this Business Unit 3 Performance Materials And Technologies Honeywell Company Profile CP SS Dispense information and present a thorough explanation of Net Sales, Segment Profit using the slides given. This template can be altered and personalized to fit your needs. It is also available for immediate download. So grab it now.
-
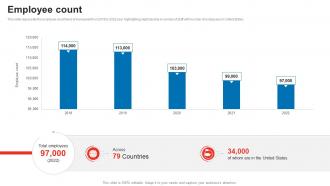 Employee Count Honeywell Company Profile CP SS
This slide represents the employee count trend of Honeywell from 2018 to 2022 year highlighting slight decline in number of staff with number of employees in United States. Present the topic in a bit more detail with this Employee Count Honeywell Company Profile CP SS. Use it as a tool for discussion and navigation on Social, Environment, Governance. This template is free to edit as deemed fit for your organization. Therefore download it now.
-
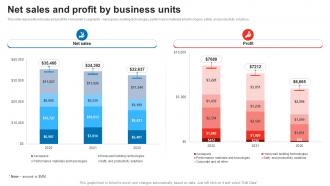 Net Sales And Profit By Business Units Honeywell Company Profile CP SS
This slide represents net sales and profit for Honeywells segments Aerospace, building technologies, performance materials And technologies, safety, and productivity solutions. Present the topic in a bit more detail with this Net Sales And Profit By Business Units Honeywell Company Profile CP SS Use it as a tool for discussion and navigation on Net Sales, Profit This template is free to edit as deemed fit for your organization. Therefore download it now.
-
 Start journey parallel tracks image
Presenting this set of slides with name - Start Journey Parallel Tracks Image. This is a three stage process. The stages in this process are Start, On, Begin.
-
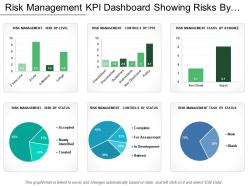 Risk Management Kpi Dashboard Showing Risks By Level Assignee And Status
Presenting this set of slides with name - Risk Management Kpi Dashboard Showing Risks By Level Assignee And Status. This is a six stage process. The stages in this process are Risk Management, Risk Assessment, Project Risk.
-
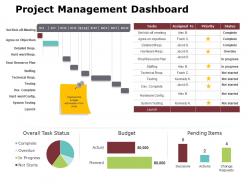 Project management dashboard ppt powerpoint presentation gallery display
Presenting this set of slides with name - Project Management Dashboard Ppt Powerpoint Presentation Gallery Display. This is a two stage process. The stages in this process are Business, Management, Strategy, Analysis, Marketing.
-
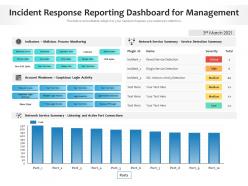 Incident response reporting dashboard for management
Presenting our well-structured Incident Response Reporting Dashboard For Management. The topics discussed in this slide are Indicators, Malicious, Process Monitoring, Account Weakness, Suspicious Login Activity. This is an instantly available PowerPoint presentation that can be edited conveniently. Download it right away and captivate your audience.
-
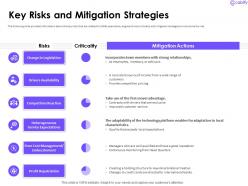 Key risks and mitigation strategies cabify investor funding elevator
The following slide provides information about the key risks that are related to Cabify operations, degree of risks criticality and mitigation strategies to overcome the risk. Present the topic in a bit more detail with this Key Risks And Mitigation Strategies Cabify Investor Funding Elevator. Use it as a tool for discussion and navigation on Drivers Availability, Competitors Reaction, Service Expectations, Cost Management. This template is free to edit as deemed fit for your organization. Therefore download it now.
-
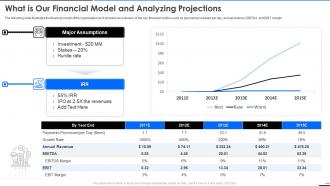 Square what is our financial model and analyzing projections ppt slides pictures
The following slide illustrates the financial model of the organization as it provides an overview of the key financial metrics such as payment processed per day, annual revenue, EBITDA and EBIT margin. Present the topic in a bit more detail with this Square What Is Our Financial Model And Analyzing Projections Ppt Slides Pictures. Use it as a tool for discussion and navigation on Major Assumptions, IRR, Growth Rate, Annual Revenue, EBITDA Margin, 2021. This template is free to edit as deemed fit for your organization. Therefore download it now.
-
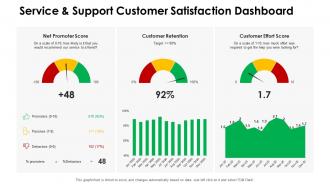 Dashboards by function service and support customer satisfaction dashboard
Deliver an outstanding presentation on the topic using this Dashboards By Function Service And Support Customer Satisfaction Dashboard. Dispense information and present a thorough explanation of Service And Support Customer Satisfaction Dashboard using the slides given. This template can be altered and personalized to fit your needs. It is also available for immediate download. So grab it now.
-
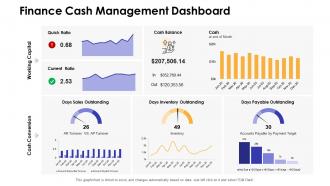 Finance cash management dashboard dashboards snapshot by function
Present the topic in a bit more detail with this Finance Cash Management Dashboard Dashboards Snapshot By Function. Use it as a tool for discussion and navigation on Finance Cash Management Dashboard . This template is free to edit as deemed fit for your organization. Therefore download it now.
-
 Portfolio management system scorecard with budgeted and total cost
Present the topic in a bit more detail with this Portfolio Management System Scorecard With Budgeted And Total Cost. Use it as a tool for discussion and navigation on Portfolio, Management, Scorecard. This template is free to edit as deemed fit for your organization. Therefore download it now.
-
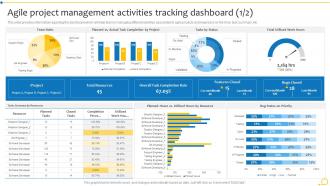 Agile Project Management Activities Tracking Dashboard Agile Initiation Playbook
This slide provides information regarding the dashboard which will help team in managing different activities associated to agile projects and keep track on the time, task summary, etc. Present the topic in a bit more detail with this Agile Project Management Activities Tracking Dashboard Agile Initiation Playbook. Use it as a tool for discussion and navigation on Team Roles, Project, Total Resources. This template is free to edit as deemed fit for your organization. Therefore download it now.
-
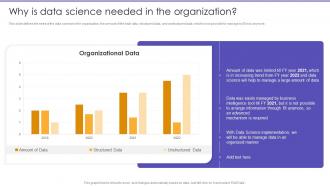 Why Is Data Science Needed In The Organization Information Science Ppt Infographics
This slide defines the need of the data science in the organization, the amount of the total data, structured data, and unstructured data, which is not possible to manage by BI tool anymore. Present the topic in a bit more detail with this Why Is Data Science Needed In The Organization Information Science Ppt Infographics. Use it as a tool for discussion and navigation on Science Needed, Organization. This template is free to edit as deemed fit for your organization. Therefore download it now.
-
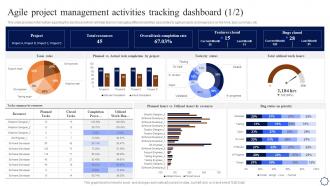 Agile Project Management Activities Tracking Dashboard Playbook For Agile Development
This slide provides information regarding the dashboard which will help team in managing different activities associated to agile projects and keep track on the time, task summary, etc. Deliver an outstanding presentation on the topic using this Agile Project Management Activities Tracking Dashboard Playbook For Agile Development. Dispense information and present a thorough explanation of Project, Total Resources, Team Cost Breakdown using the slides given. This template can be altered and personalized to fit your needs. It is also available for immediate download. So grab it now.
-
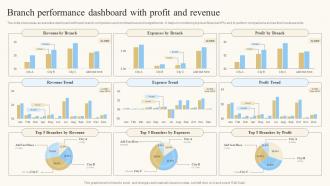 Branch Performance Dashboard With Profit And Revenue
The slide showcases an executive dashboard with bank branch comparison and combined real and budget trends . It helps in monitoring top level financial KPIs and to perform comparisons across their business units. Introducing our Branch Performance Dashboard With Profit And Revenue set of slides. The topics discussed in these slides are Profit Trend, Expense Trend, Revenue Trend. This is an immediately available PowerPoint presentation that can be conveniently customized. Download it and convince your audience.
-
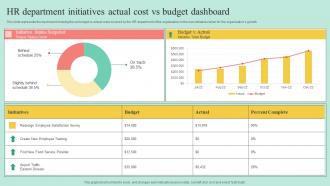 HR Department Initiatives Actual Cost Vs Budget Dashboard
This slide represents the dashboard showing the set budget vs actual costs incurred by the HR department of the organization in the new initiatives taken for the organizations growth. Presenting our well structured HR Department Initiatives Actual Cost Vs Budget Dashboard. The topics discussed in this slide are Initiative Status Snapshot, Project Status Count, Initiative Total Budget. This is an instantly available PowerPoint presentation that can be edited conveniently. Download it right away and captivate your audience.
-
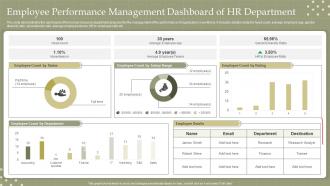 Employee Performance Management Dashboard Of HR Department
This slide demonstrates the dashboard of the human resource department prepared for the management of the performance of organizations workforce. It includes details related to head count, average employee age, gender diversity ratio, absenteeism rate, average employee tenure, HR to employee ratio etc. Introducing our Employee Performance Management Dashboard Of HR Department set of slides. The topics discussed in these slides are Employee Performance, Management Dashboard, Hr Department. This is an immediately available PowerPoint presentation that can be conveniently customized. Download it and convince your audience.
-
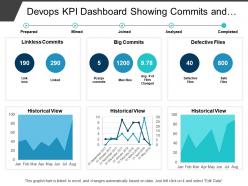 Devops kpi dashboard showing commits and defective files
Presenting this set of slides with name - Devops Kpi Dashboard Showing Commits And Defective Files. This is a six stage process. The stages in this process are Development And Operations, Devops.
-
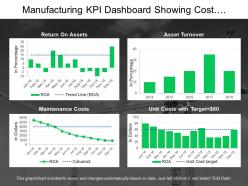 Manufacturing kpi dashboard showing cost management and asset turnover
Presenting this set of slides with name - Manufacturing Kpi Dashboard Showing Cost Management And Asset Turnover. This is a four stage process. The stages in this process are Manufacturing, Production, Manufacture.
-
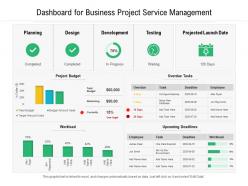 Dashboard for business project service management
Presenting this set of slides with name Dashboard For Business Project Service Management. The topics discussed in these slides are Planning, Design, Development. This is a completely editable PowerPoint presentation and is available for immediate download. Download now and impress your audience.
-
 Business reporting operation expenditure dashboard slide for interest rate risk powerpoint template
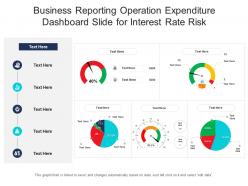
This is a Business Reporting Operation Expenditure Dashboard Slide For Interest Rate Risk Powerpoint Template that you can use to present real-time information about your business. With a variety of graphical representations that are in-line with the current trends, this is a great way to display quantified data and stats. This is also a great PowerPoint slide to make informed decisions based on the data and results depicted. Since this template can accommodate a lot of statistical information in one-go it can be put to use by different department heads of the organization. This PPT slide can also be used to present a thorough discussion on various KPIs, all excel-linked and susceptible to innumerable changes. Thus helping in the portrayal of calculative data in a highly professional format. Not only this, but it can also be reproduced in JPG, PNG, and PDF formats. Therefore, reinvent the wheel by downloading this PPT slide now.
-
 Pharmaceutical sales project quarterly performance dashboard
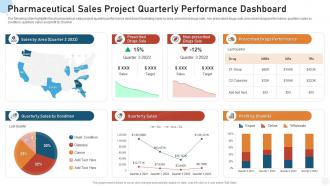
Presenting our well structured Pharmaceutical Sales Project Quarterly Performance Dashboard. The topics discussed in this slide are Sales By Area, Quarterly Sales By Condition, Quarterly Sales. This is an instantly available PowerPoint presentation that can be edited conveniently. Download it right away and captivate your audience.
-
 ABC Company Sales Trends Analysis Statistical Report
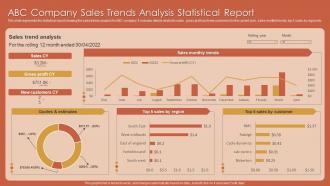
Introducing our ABC Company Sales Trends Analysis Statistical Report set of slides. The topics discussed in these slides are ABC Company Sales, Trends Analysis, Statistical Report. This is an immediately available PowerPoint presentation that can be conveniently customized. Download it and convince your audience.
-
 KPI Dashboard For Supplier Monitoring Strategic Approach For Supplier Upskilling
The slide depicts the KPI dashboard for the supplier monitoring. It provides information regarding the monthly purchase value, number of contracted suppliers, scheduled and completed audits along with vendors quality performance. Deliver an outstanding presentation on the topic using this KPI Dashboard For Supplier Monitoring Strategic Approach For Supplier Upskilling. Dispense information and present a thorough explanation of KPI Dashboard, Supplier Monitoring, Suppliers Categories using the slides given. This template can be altered and personalized to fit your needs. It is also available for immediate download. So grab it now.
-
 Digital Marketing Campaign Performance Monitoring Dashboard
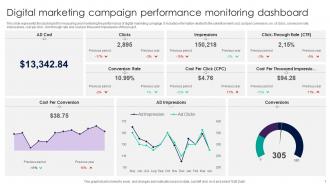
This slide represents the dashboard for measuring and monitoring the performance of digital marketing campaign. It includes information related to the advertisement cost, cost per conversion, no. of clicks, conversion rate, impressions, cost per click, click through rate and cost per thousand impressions of the project. Presenting our well structured Digital Marketing Campaign Performance Monitoring Dashboard. The topics discussed in this slide are Impressions, Conversion Rate, Cost Per Conversion. This is an instantly available PowerPoint presentation that can be edited conveniently. Download it right away and captivate your audience.
-
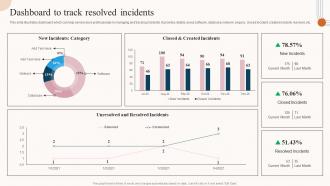 Dashboard To Track Resolved Incidents Service Desk Incident Management
This slide illustrates dashboard which can help service desk professionals in managing and tracking incidents. It provides details about software, database, network, enquiry, closed incident, created incident, resolved, etc. Present the topic in a bit more detail with this Dashboard To Track Resolved Incidents Service Desk Incident Management. Use it as a tool for discussion and navigation on Dashboard, Professionals, Software. This template is free to edit as deemed fit for your organization. Therefore download it now.
-
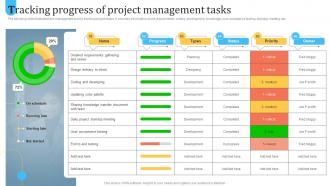 Tracking Progress Of Project Utilizing Cloud For Task And Team Management
The following slide illustrates task management tool for tracking project status. It provides information about requirements, coding, development, knowledge, user acceptance testing, standup meeting, etc.Deliver an outstanding presentation on the topic using this Tracking Progress Of Project Utilizing Cloud For Task And Team Management. Dispense information and present a thorough explanation of Detailed Requirements, Acceptance Testing, Coding Developing using the slides given. This template can be altered and personalized to fit your needs. It is also available for immediate download. So grab it now.
-
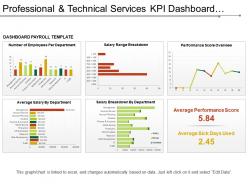 Professional and technical services kpi dashboard showing payroll services
Presenting this set of slides with name - Professional And Technical Services Kpi Dashboard Showing Payroll Services. This is a six stage process. The stages in this process are Professional And Technical Services, Services Management, Technical Management.
-
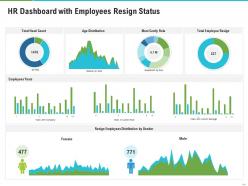 Hr dashboard with employees resign status
Introducing our HR Dashboard With Employees Resign Status set of slides. The topics discussed in these slides are Female, Male, Gender. This is an immediately available PowerPoint presentation that can be conveniently customized. Download it and convince your audience.
-
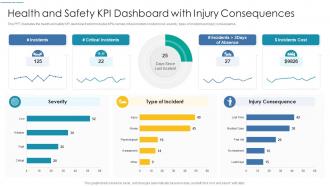 Health and safety kpi dashboard with injury consequences
Presenting our well structured Health And Safety KPI Dashboard With Injury Consequences. The topics discussed in this slide are Health And Safety KPI Dashboard With Injury Consequences. This is an instantly available PowerPoint presentation that can be edited conveniently. Download it right away and captivate your audience.
-
 Information Security Compliance Dashboard Snapshot Of Information Security
This slide depicts the cyber security compliance report on how data and hardware are monitored in different categories such as standard, regulation, and asset type control. Deliver an outstanding presentation on the topic using this Information Security Compliance Dashboard snapshot Of Information Security. Dispense information and present a thorough explanation of Compliance, Dashboard, Information using the slides given. This template can be altered and personalized to fit your needs. It is also available for immediate download. So grab it now.
-
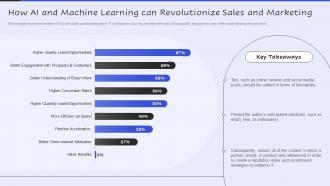 How Ai And Machine Learning Can Revolutionize Servicenow Performance Analytics
This template covers the benefits of AI for the Sales and Marketing team. AI and Machine Learning benefits in the area of lead quality, engagement, and better understanding of buyer intent. Deliver an outstanding presentation on the topic using this How Ai And Machine Learning Can Revolutionize Servicenow Performance Analytics. Dispense information and present a thorough explanation of AI And Machine Learning, Revolutionize Sales And Marketing using the slides given. This template can be altered and personalized to fit your needs. It is also available for immediate download. So grab it now.
-
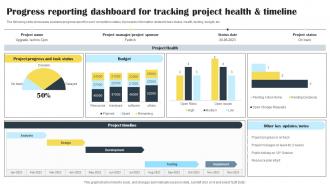 Progress Reporting Dashboard For Tracking Project Health And Timeline
The following slide showcases business progress report for work completion status. It presents information related to task status, health, testing, budget, etc. Introducing our Progress Reporting Dashboard For Tracking Project Health And Timeline set of slides. The topics discussed in these slides are Project Manager, Budget, Project Progress. This is an immediately available PowerPoint presentation that can be conveniently customized. Download it and convince your audience.
-
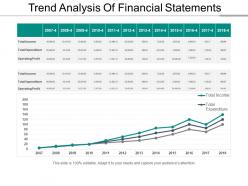 Trend analysis of financial statements powerpoint layout
Presenting a PowerPoint slide named Trend Analysis of Financial Statements PowerPoint Layout. This template with high-quality graphics is completely editable and professionally designed. With an option to change the size, style, and color of the font, this slide is ready to use. You can customize the text and color of the diagram as well as the background as per your discretion. The PPT slide is compatible with Google Slides, which makes it easily accessible. You can customize and save the file as JPG or PDF formats. Once the graph is linked to excel, it automatically changes based on the data.
-
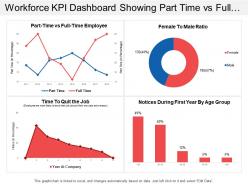 Workforce kpi dashboard showing part time vs full time employee
Presenting this set of slides with name - Workforce Kpi Dashboard Showing Part Time Vs Full Time Employee. This is a four stage process. The stages in this process are Staff, Personnel, Workforce.
-
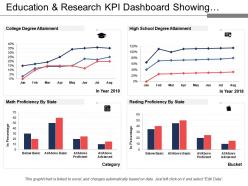 Education and research kpi dashboard showing degree attainment and proficiency
Presenting education and research KPI dashboard showing degree attainment and proficiency PPT slide. The educational degree attainment KPI report presentation slide designed by the professional team of SlideTeam. The education population analysis PPT template is fully editable in PowerPoint. The research status KPI report presentation template is compatible with Google Slide so a user can share this degree attainment metric dashboard slide with others. A user can make changes in the font size, font type, color as well as dimensions of the proficiency KPI dashboard PPT slide as per the requirement. You may edit the value in the education proficiency report slide as the slide gets linked with the Excel sheet.
-
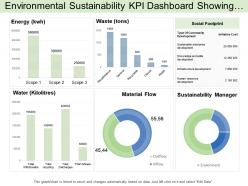 Environmental sustainability kpi dashboard showing social footprint and supply chain category
Presenting this set of slides with name - Environmental Sustainability Kpi Dashboard Showing Social Footprint And Supply Chain Category. This is a six stage process. The stages in this process are Environment Sustainability, Environment Continual, Environment Feasibility.
-
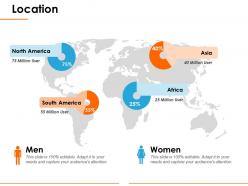 Location ppt rules
Presenting location PPT template. This world map template for PowerPoint is fully editable and is designed by professionals. You can easily customize the objects in the slide like font size and font color. This presentation slide is fully compatible with Google Slide and can be saved in JPG or PDF file format easily. Download this fast at the click of a button.


