Charts, Graphs PowerPoint Designs, Presentation Charts Designs & PPT Graphics
- Sub Categories
-
- Arrows and Targets
- Bullet and Text Slides
- Charts and Graphs
- Circular Cycle Diagrams
- Concepts and Shapes
- Custom Flat Designs
- Dashboards and Measuring
- Flow Process
- Funnels
- Gears
- Growth
- Harvey Balls
- Idea Innovation and Light Bulbs
- Leadership
- Linear Process Diagrams
- Magnifying Glass
- Misc Other Graphics
- Opportunity and Handshake
- Organization Charts
- Puzzles
- Pyramids
- Roadmaps and Timelines
- Silhouettes
- Steps
- Strategic Planning Analysis
- SWOT Analysis
- Tables and Matrix
- Teamwork
- Technology and Communication
- Venn Diagrams
- Visuals and Illustrations
-
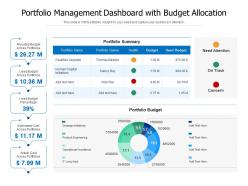 Portfolio management dashboard with budget allocation
Introducing our Portfolio Management Dashboard With Budget Allocation set of slides. The topics discussed in these slides are Portfolio Summary, Portfolio Budget. This is an immediately available PowerPoint presentation that can be conveniently customized. Download it and convince your audience.
-
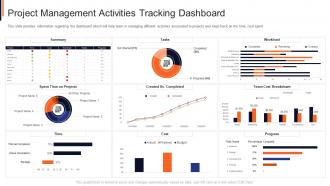 Project management activities tracking dashboard project safety management it
This slide provides information regarding the dashboard which will help team in managing different activities associated to projects and keep track on the time, cost spent. Deliver an outstanding presentation on the topic using this Project Management Activities Tracking Dashboard Project Safety Management It. Dispense information and present a thorough explanation of Progress, Cost, Team, Information using the slides given. This template can be altered and personalized to fit your needs. It is also available for immediate download. So grab it now.
-
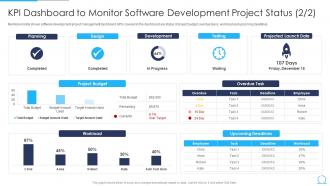 Agile Qa Model It Kpi Dashboard To Monitor Software Development Project Status
Mentioned slide shows software development project management dashboard. KPIs covered in the dashboard are status of project budget, overdue tasks, workload and upcoming deadlines. Deliver an outstanding presentation on the topic using this Agile Qa Model It Kpi Dashboard To Monitor Software Development Project Status. Dispense information and present a thorough explanation of Software, Development, Dashboard using the slides given. This template can be altered and personalized to fit your needs. It is also available for immediate download. So grab it now.
-
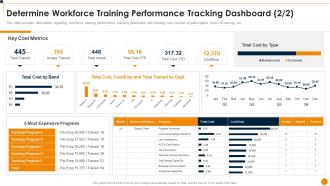 Determine Workforce Training Performance Tracking Dashboard Metrics
This slide provides information regarding workforce training performance tracking dashboard with training cost, number of participants, hours of training, etc. Present the topic in a bit more detail with this Determine Workforce Training Performance Tracking Dashboard Metrics. Use it as a tool for discussion and navigation on Determine Workforce Training Performance Tracking Dashboard. This template is free to edit as deemed fit for your organization. Therefore download it now.
-
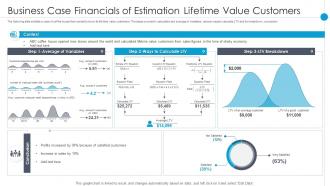 Business Case Financials Of Estimation Lifetime Value Customers
The following slide exhibits a case of coffee house that wanted to know its life time value customers. The steps covered in calculation are average of variables, various ways to calculate LTV and its breakdown, conclusion. Introducing our Business Case Financials Of Estimation Lifetime Value Customers set of slides. The topics discussed in these slides are Satisfied Customers, Average Of Variables, Profits Increased. This is an immediately available PowerPoint presentation that can be conveniently customized. Download it and convince your audience.
-
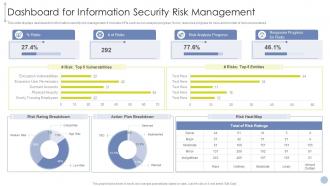 Obtaining ISO 27001 Certificate Dashboard For Information Security Risk Management
This slide displays dashboard for information security risk management. It includes KPIs such as risk analysis progress, percent risk, response progress for risks and number of risks encountered. Deliver an outstanding presentation on the topic using this Obtaining ISO 27001 Certificate Dashboard For Information Security Risk Management. Dispense information and present a thorough explanation of Risk Analysis Progress, Response Progress Risks, Risk Rating Breakdown using the slides given. This template can be altered and personalized to fit your needs. It is also available for immediate download. So grab it now.
-
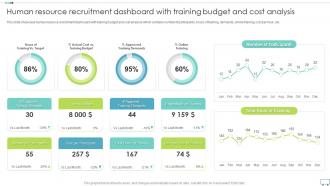 Human Resource Recruitment Dashboard With Training Budget And Cost Analysis
This slide showcase human resource recruitment dashboard with training budget and cost analysis which contains number of participants, hours of training, demands, online training, cost per hour, etc. Introducing our Human Resource Recruitment Dashboard With Training Budget And Cost Analysis set of slides. The topics discussed in these slides are Human Resource Recruitment, Dashboard, Training Budget, Cost Analysis. This is an immediately available PowerPoint presentation that can be conveniently customized. Download it and convince your audience.
-
 Product Sale Report Analysis Icon
Introducing our Product Sale Report Analysis Icon set of slides. The topics discussed in these slides are Product Sale Report, Analysis Icon. This is an immediately available PowerPoint presentation that can be conveniently customized. Download it and convince your audience.
-
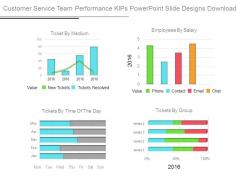 Customer service team performance kips powerpoint slide designs download
Presenting customer service team performance kips powerpoint slide designs download. This is a customer service team performance kips powerpoint slide designs download. This is a four stage process. The stages in this process are tickets by time of the day, ticket by medium, employees by salary, tickets by group, value, new tickets, tickets resolved, phone, contact, email, chat.
-
 Road start image
Presenting this set of slides with name - Road Start Image. This is a four stage process. The stages in this process are Start, On, Begin.
-
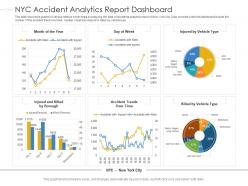 Nyc accident analytics report dashboard snapshot powerpoint template
This slide shows the graphs of various metrics which helps in analyzing the data of accidents analytics report of New York City. Data covered under this dashboard snapshot include the number of the accident trend over time, number of persons injured or killed by vehicle type. This is a NYC Accident Analytics Report Dashboard Snapshot Powerpoint Template drafted with a diverse set of graphics, that can be reformulated and edited as per your needs and requirements. Just download it in your system and make use of it in PowerPoint or Google Slides, depending upon your presentation preferences.
-
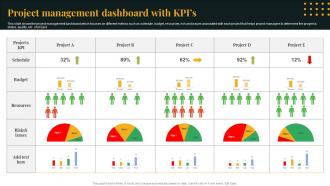 Project Management Dashboard With KPIs
This slide shows the project management dashboard which focuses on different metrics such as schedule, budget, resources, risk and issues associated with each project that helps project managers to determine the progress, status, quality, etc. of project. Introducing our Project Management Dashboard With KPIs set of slides. The topics discussed in these slides are Project Management, Dashboard With KPIs. This is an immediately available PowerPoint presentation that can be conveniently customized. Download it and convince your audience.
-
 Customer Satisfaction Survey Feedback Report
This slide showcases feedback report for customer satisfaction survey that can help organization to identify the number of satisfied consumers and detect areas of improvement for future. Its key elements are Satisfaction survey and percentage of satisfied consumers. Presenting our well-structured Customer Satisfaction Survey Feedback Report. The topics discussed in this slide are Customer Satisfaction Survey, Feedback Report. This is an instantly available PowerPoint presentation that can be edited conveniently. Download it right away and captivate your audience.
-
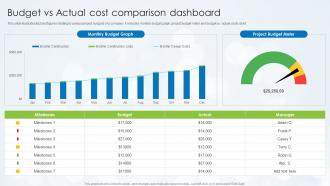 Budget Vs Actual Cost Comparison Dashboard
This slide illustrates fact and figures relating to various project budgets of a company. It includes monthly budget graph, project budget meter and budget vs. actual costs chart. Introducing our Budget Vs Actual Cost Comparison Dashboard set of slides. The topics discussed in these slides are Budget Vs Actual, Cost Comparison, Dashboard. This is an immediately available PowerPoint presentation that can be conveniently customized. Download it and convince your audience.
-
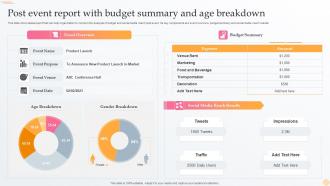 Post Event Report With Budget Summary And Age Breakdown
This slide showcases report that can help organization to conduct the analysis of budget and social media reach post event. Its key components are event overview, budget summary and social media reach results Introducing our Post Event Report With Budget Summary And Age Breakdown set of slides. The topics discussed in these slides are Post Event Report, Budget Summary, Age Breakdown. This is an immediately available PowerPoint presentation that can be conveniently customized. Download it and convince your audience.
-
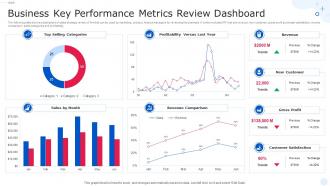 Business Key Performance Metrics Review Dashboard Snapshot
The following slide shows a dashboard of sales strategy review of firm that can be used by marketing, product, finance managers for reviewing the business. It further includes KPI that are revenue, new customer, gross profit purchaser satisfaction, income comparison, sales categories and profitability. Presenting our well structured Business Key Performance Metrics Review Dashboard Snapshot. The topics discussed in this slide are Selling Categories, Profitability, Revenue Comparison. This is an instantly available PowerPoint presentation that can be edited conveniently. Download it right away and captivate your audience.
-
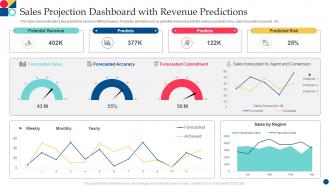 Sales Projection Dashboard With Revenue Predictions
Presenting our well structured Sales Projection Dashboard With Revenue Predictions. The topics discussed in this slide are Forecasted Value, Forecasted Accuracy, Forecasted Commitment. This is an instantly available PowerPoint presentation that can be edited conveniently. Download it right away and captivate your audience.
-
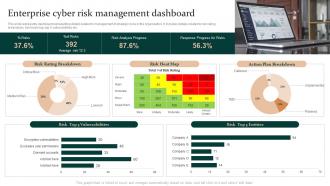 Enterprise Cyber Risk Management Dashboard Enterprise Risk Mitigation Strategies
This slide represents dashboard representing details related to management of strategic risks in the organization. It includes details related to risk rating breakdown, risk heat map, top 5 vulnerabilities etc. Present the topic in a bit more detail with this Enterprise Cyber Risk Management Dashboard Enterprise Risk Mitigation Strategies. Use it as a tool for discussion and navigation on Management, Dashboard, Enterprise. This template is free to edit as deemed fit for your organization. Therefore download it now.
-
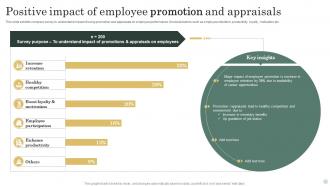 Positive Impact Of Employee Promotion And Appraisals
This slide exhibits company survey to understand impact of using promotion and appraisals on employee performance. It include factors such as employee retention, productivity, loyalty, motivation etc. Introducing our Positive Impact Of Employee Promotion And Appraisals set of slides. The topics discussed in these slides are Increase Retention, Healthy Competition, Employee Participation. This is an immediately available PowerPoint presentation that can be conveniently customized. Download it and convince your audience.
-
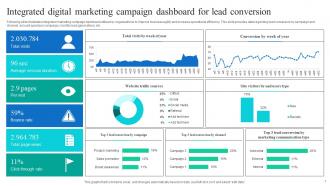 Integrated Digital Marketing Campaign Dashboard For Lead Conversion
Following slide illustrates integrated marketing campaign dashboard utilized by organizations to improve business agility and increase operational efficiency. This slide provides data regarding lead conversion by campaign and channel, amount spent per campaign, monthly lead generations, etc. Presenting our well structured Integrated Digital Marketing Campaign Dashboard For Lead Conversion. The topics discussed in this slide are Digital Marketing, Campaign Dashboard, Lead Conversion. This is an instantly available PowerPoint presentation that can be edited conveniently. Download it right away and captivate your audience.
-
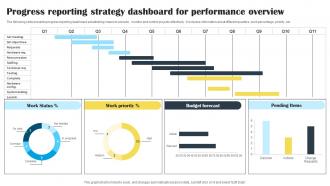 Progress Reporting Strategy Dashboard For Performance Overview
The following slide presents progress reporting dashboard establishing means to execute , monitor and control projects effectively. It includes information about different quarters, work percentage, priority, etc. Presenting our well structured Progress Reporting Strategy Dashboard For Performance Overview. The topics discussed in this slide are Progress Reporting, Strategy Dashboard, Performance Overview. This is an instantly available PowerPoint presentation that can be edited conveniently. Download it right away and captivate your audience.
-
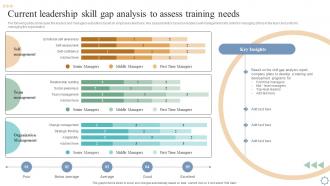 Current Leadership Skill Gap Analysis To Assess Leadership And Management
The following slide showcases the leaders and managers evaluation based on employees feedback. Key assessment is based on leaders self management skill, skills for managing others in the team and skills for managing the organization.Deliver an outstanding presentation on the topic using this Current Leadership Skill Gap Analysis To Assess Leadership And Management. Dispense information and present a thorough explanation of Self managemen, Organization Management, Team management using the slides given. This template can be altered and personalized to fit your needs. It is also available for immediate download. So grab it now.
-
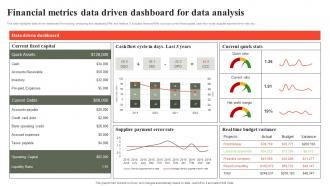 Financial Metrics Data Driven Dashboard For Data Analysis
This slide highlights data driven dashboard for tracking, analyzing and displaying KPIs and metrics. It includes financial KPIs such as current fixed capital, cash flow cycle, supplier payment error rate, etc. Introducing our Financial Metrics Data Driven Dashboard For Data Analysis set of slides. The topics discussed in these slides are Quick Assets, Current Fixed Capital. This is an immediately available PowerPoint presentation that can be conveniently customized. Download it and convince your audience.
-
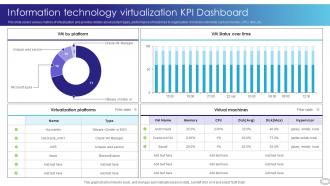 Information Technology Virtualization KPI Dashboard
This slide covers various metrics of virtualization and provides details about system types, performance of machines in organization. It includes elements such as memory, CPU, disk, etc. Introducing our Information Technology Virtualization KPI Dashboard set of slides. The topics discussed in these slides are Virtualization Platforms, VM Status Over Time, VM Platform. This is an immediately available PowerPoint presentation that can be conveniently customized. Download it and convince your audience.
-
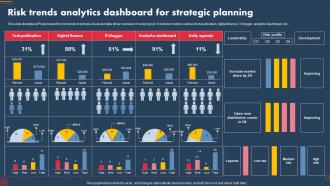 Risk Trends Analytics Dashboard For Strategic Planning
This slide illustrates KPI dashboard for risk trends to provide visual and data driven overview of evolving risk. It includes metrics such as tech publication, digital finance, IT blogger, analytics dashboard, etc. Presenting our well structured Risk Trends Analytics Dashboard For Strategic Planning. The topics discussed in this slide are Leadership, Improving, Development. This is an instantly available PowerPoint presentation that can be edited conveniently. Download it right away and captivate your audience.
-
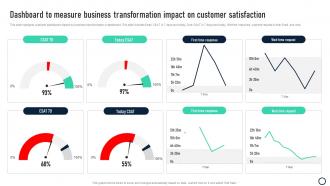 Dashboard To Measure Business Transformation Impact On Customer Satisfaction
This slide highlights customer satisfaction impact by business transformation in dashboard. This slide includes Email CSAT in 7 days and today, Chat CSAT in 7 days and today, first time response, wait time request in both Email and chat. Introducing our Dashboard To Measure Business Transformation Impact On Customer Satisfaction set of slides. The topics discussed in these slides are Dashboard Measure Business Transformation Impact, Customer Satisfaction This is an immediately available PowerPoint presentation that can be conveniently customized. Download it and convince your audience.
-
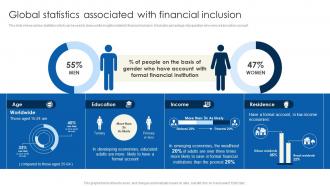 Global Statistics Associated Financial Inclusion To Promote Economic Fin SS
This slide shows various statistics which can be used to draw useful insights related to financial inclusion. It includes percentage of population who owns a transaction account. Present the topic in a bit more detail with this Global Statistics Associated Financial Inclusion To Promote Economic Fin SS. Use it as a tool for discussion and navigation on Education, Income, Residence. This template is free to edit as deemed fit for your organization. Therefore download it now.
-
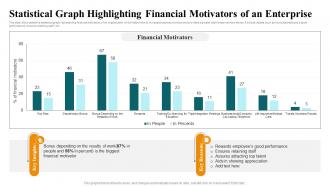 Statistical Graph Highlighting Financial Motivators Of An Enterprise
This slide showcases the statistical graph representing financial motivators of an organization which helps them to increase business revenue and provides a greater staff empowerment sense. It include details such as rewards employees good performance, ensures retaining staff, etc. Introducing our Statistical Graph Highlighting Financial Motivators Of An Enterprise set of slides. The topics discussed in these slides are Financial Motivators, Key Insights, Key Reasons.This is an immediately available PowerPoint presentation that can be conveniently customized. Download it and convince your audience.
-
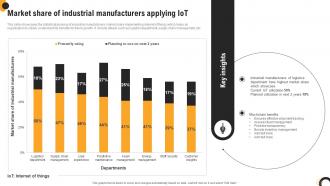 Market Share Of Industrial Manufacturers Applying Iot
This slide showcases the statistical analysis of industrial manufacturers market share implementing internet of things which helps an organization to clearly understand its benefits for future growth. It include details such as logistics department, supply chain management, etc. Presenting our well structured Market Share Of Industrial Manufacturers Applying IoT. The topics discussed in this slide are Industrial Manufacturers, Blockchain Benefits, Internet Of Things. This is an instantly available PowerPoint presentation that can be edited conveniently. Download it right away and captivate your audience.
-
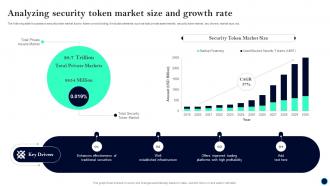 Analyzing Security Token Beginners Guide To Successfully Launch Security Token BCT SS V
The following slide focusses on security token market size to foster crowd funding. It includes elements such as total private asset market, security token market, key drivers, market size, etc. Deliver an outstanding presentation on the topic using this Analyzing Security Token Beginners Guide To Successfully Launch Security Token BCT SS V. Dispense information and present a thorough explanation of Security Token, Market Size, Key Drivers using the slides given. This template can be altered and personalized to fit your needs. It is also available for immediate download. So grab it now.
-
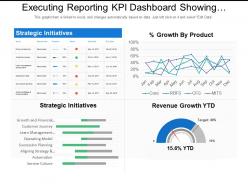 Executing reporting kpi dashboard showing strategic initiatives and percentage growth by product
Presenting this set of slides with name - Executing Reporting Kpi Dashboard Showing Strategic Initiatives And Percentage Growth By Product. This is a four stage process. The stages in this process are Executive Reporting, Executive Analysis, Executive Performance.
-
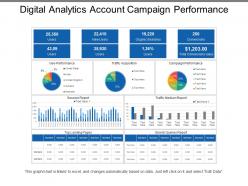 Digital analytics account campaign performance
Presenting this set of slides with name - Digital Analytics Account Campaign Performance. This is a five stage process. The stages in this process are Digital Analytics, Digital Dashboard, Digital Kpis.
-
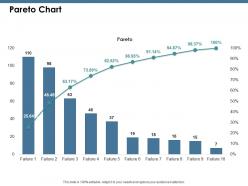 Pareto chart ppt show infographic template
This is a ten stage process. The stages in this process are Management, Marketing, Business, Percentage, Product.
-
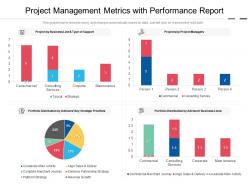 Project management metrics with performance report
Presenting this set of slides with name Project Management Metrics With Performance Report. The topics discussed in these slides are Strategic, Priorities, Business. This is a completely editable PowerPoint presentation and is available for immediate download. Download now and impress your audience.
-
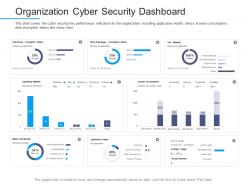 Information security awareness organization cyber security dashboard ppt templates
This slide covers the cyber security key performance indicators for the organization including application health, device license consumption, data encryption status and many more. Deliver an outstanding presentation on the topic using this Information Security Awareness Organization Cyber Security Dashboard Ppt Templates. Dispense information and present a thorough explanation of Executives, License Consumption, Operating Systems using the slides given. This template can be altered and personalized to fit your needs. It is also available for immediate download. So grab it now.
-
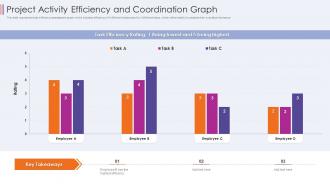 Project activity efficiency and coordination graph
Presenting our well structured Project Activity Efficiency And Coordination Graph. The topics discussed in this slide are Project Activity Efficiency And Coordination Graph. This is an instantly available PowerPoint presentation that can be edited conveniently. Download it right away and captivate your audience.
-
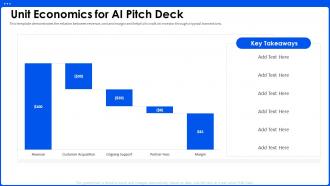 Unit Economics For AI Pitch Deck Ppt Powerpoint Presentation Portfolio Guidelines
This template demonstrates the relation between revenue, cost and margin and helpful to walk an investor through a typical transections. Deliver an outstanding presentation on the topic using this Unit Economics For AI Pitch Deck Ppt Powerpoint Presentation Portfolio Guidelines. Dispense information and present a thorough explanation of Unit Economics For Ai Pitch Deck using the slides given. This template can be altered and personalized to fit your needs. It is also available for immediate download. So grab it now.
-
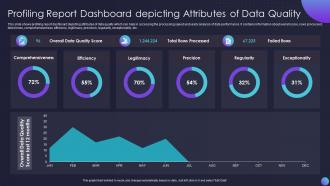 Profiling Report Dashboard Snapshot Depicting Attributes Of Data Quality
This slide shows profiling report dashboard snapshot depicting attributes of data quality which can help in accessing the processing speed and yearly analysis of data performance. It contains information about overall score, rows processed, failed rows, comprehensiveness, efficiency, legitimacy, precision, regularity, exceptionality, etc.Introducing our Profiling Report Dashboard Depicting Attributes Of Data Quality set of slides. The topics discussed in these slides are Comprehensiveness, Legitimacy, Efficiency This is an immediately available PowerPoint presentation that can be conveniently customized. Download it and convince your audience.
-
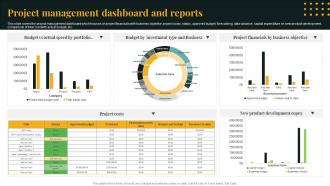 Project Management Dashboard Snapshot And Reports
This slide covers the project management dashboard which focuses on project financials with business objective, project costs, status, approved budget, forecasting, data variance, capital expenditure on new product development, comparison of total cost with actual budget, etc. Presenting our well structured Project Management Dashboard Snapshot And Reports. The topics discussed in this slide are Budget Vs Actual Speed By Portfolio, Project Financials By Business Objective, Budget By Investment Type And Business . This is an instantly available PowerPoint presentation that can be edited conveniently. Download it right away and captivate your audience.
-
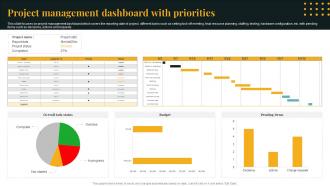 Project Management Dashboard With Priorities
This slide focuses on project management dashboard which covers the reporting date of project, different tasks such as setting kick off meeting, final resource planning, staffing, testing, hardware configuration, etc. with pending items such as decisions, actions and requests. Presenting our well structured Project Management Dashboard With Priorities. The topics discussed in this slide are Project Management, Dashboard With Priorities. This is an instantly available PowerPoint presentation that can be edited conveniently. Download it right away and captivate your audience.
-
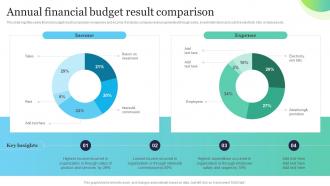 Annual Financial Budget Result Comparison
This slide signifies yearly financial budget result comparison on expense and income. It includes company revenue generated through sales, investment return and cost like electricity bills, employees etc. Introducing our Annual Financial Budget Result Comparison set of slides. The topics discussed in these slides are Annual Financial, Budget, Result Comparison. This is an immediately available PowerPoint presentation that can be conveniently customized. Download it and convince your audience.
-
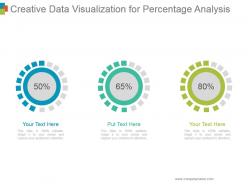 Creative data visualization for percentage analysis powerpoint slide themes
Presenting creative data visualization for percentage analysis powerpoint slide themes. This is a creative data visualization for percentage analysis powerpoint slide themes. This is a three stage process. The stages in this process are business, marketing, strategy, success, process.
-
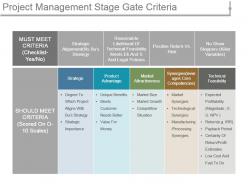 Project management stage gate criteria ppt icon
Presenting project management stage gate criteria ppt icon. This is a project management stage gate criteria ppt icon. This is a five stage process. The stages in this process are strategic, product advantage, market attractiveness, synergies leverages core competencies, technical feasibility.
-
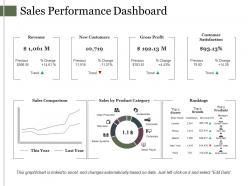 Sales performance dashboard presentation diagrams
Presenting this set of slides with name - Sales Performance Dashboard Presentation Diagrams. This is a seven stage process. The stages in this process are Slide Bar, Marketing, Finance, Growth, Strategy.
-
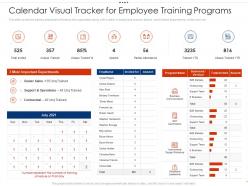 Calendar visual tracker for employee training programs employee intellectual growth ppt rules
This slide covers the training dashboard offered by the organization along with number of employees present, absent, most trained departments, invites sent, etc. Present the topic in a bit more detail with this Calendar Visual Tracker For Employee Training Programs Employee Intellectual Growth Ppt Rules. Use it as a tool for discussion and navigation on Calendar Visual Tracker For Employee Training Programs. This template is free to edit as deemed fit for your organization. Therefore download it now.
-
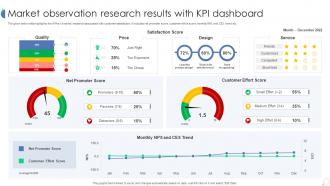 Market Observation Research Results With KPI Dashboard Snapshot
The given below slide highlights the KPAs of market research associated with customer satisfaction. It includes net promoter score, customer effort score, monthly NPS and CES trend etc. Introducing our Market Observation Research Results With KPI Dashboard set of slides. The topics discussed in these slides are Satisfaction Score, Net Promoter Score, Customer Effort Score. This is an immediately available PowerPoint presentation that can be conveniently customized. Download it and convince your audience.
-
 Service Desk Management Dashboard Of IT Company
This slide shows the dashboard representing the service desk management of an IT company. It includes details related to requests by technician, open requests by priority, requests last week etc. Introducing our Service Desk Management Dashboard Of IT Company set of slides. The topics discussed in these slides are Service Desk Management, Dashboard Of IT Company. This is an immediately available PowerPoint presentation that can be conveniently customized. Download it and convince your audience.
-
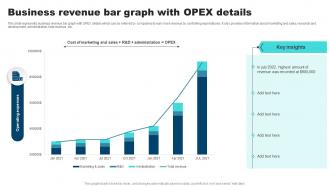 Business Revenue Bar Graph With OPEX Details
This slide represents business revenue bar graph with OPEX details which can be referred by companies to earn more revenue by controlling expenditures. It also provides information about marketing and sales, research and development, administration, total revenue, etc. Presenting our well-structured Business Revenue Bar Graph With OPEX Details. The topics discussed in this slide are Business Revenue, Bar Graph, OPEX Details. This is an instantly available PowerPoint presentation that can be edited conveniently. Download it right away and captivate your audience.
-
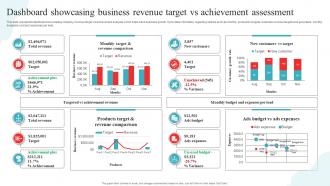 Dashboard Showcasing Business Revenue Target Vs Achievement Assessment
This slide represents dashboard showcasing company revenue target vs achievement analysis which helps track business growth. It provides information regarding metrics such as monthly production targets, business revenue targets and generated, monthly budgeted cost and expenses per lead. Introducing our Dashboard Showcasing Business Revenue Target Vs Achievement Assessment set of slides. The topics discussed in these slides are Business, Revenue, Assessment. This is an immediately available PowerPoint presentation that can be conveniently customized. Download it and convince your audience.
-
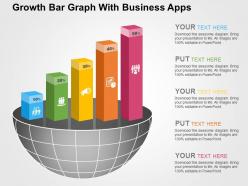 Growth bar graph with business apps flat powerpoint design
We are proud to present our growth bar graph with business apps flat powerpoint design. Graphic of bar graph and business apps has been used to craft this power point template diagram. This PPT diagram contains the concept of growth analysis. Use this PPT diagram for business and marketing related presentations.
-
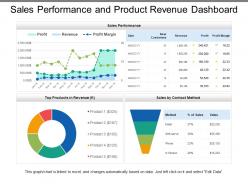 Sales performance and product revenue dashboard
Presenting this set of slides with name - Sales Performance And Product Revenue Dashboard. Amazing representation of content used in the PowerPoint slide. Good quality pixels used in the designing. High resolution presentation design does not affect the quality even when projected on wide screen. Easy convert into different formats such as JPG and PDF. Compatible with maximum number of software and Google slides. Easy to add and remove content as per business need. Totally modifiable PPT template as text, icons and graphics are editable. Insert Company’s personalized content and logo.
-
 Inventory and logistics dashboard ppt powerpoint presentation summary background image
Presenting this set of slides with name - Inventory And Logistics Dashboard Ppt Powerpoint Presentation Summary Background Image. This is a six stages process. The stages in this process are Finance, Marketing, Management, Investment, Analysis.
-
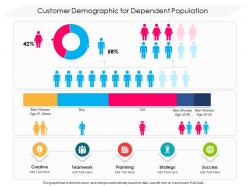 Customer demographic for dependent population
Presenting this set of slides with name Customer Demographic For Dependent Population. The topics discussed in these slides are Teamwork, Planning, Strategy. This is a completely editable PowerPoint presentation and is available for immediate download. Download now and impress your audience.
-
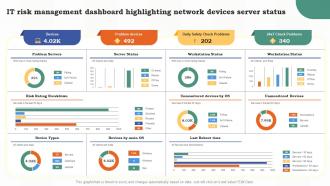 F630 It Risk Management Dashboard Highlighting Network Devices Server Status Risk Assessment Of It Systems
Present the topic in a bit more detail with this F630 It Risk Management Dashboard Highlighting Network Devices Server Status Risk Assessment Of It Systems. Use it as a tool for discussion and navigation on Management, Dashboard, Highlighting. This template is free to edit as deemed fit for your organization. Therefore download it now.
-
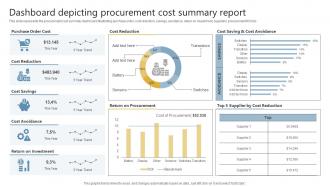 Dashboard Snapshot Depicting Procurement Cost Summary Report
This slide represents the procurement cost summary dashboard illustrating purchase order, cost reduction, savings, avoidance, return on investment, suppliers, procurement ROI etc. Presenting our well structured Dashboard Snapshot Depicting Procurement Cost Summary Report. The topics discussed in this slide are Purchase Order Cost, Cost Reduction, Cost Savings. This is an instantly available PowerPoint presentation that can be edited conveniently. Download it right away and captivate your audience.
-
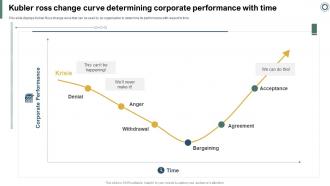 Effectively Handling Crisis To Restore Kubler Ross Change Curve Determining Corporate
This slide displays Kubler Ross change curve that can be used by an organization to determine its performance with respect to time. Present the topic in a bit more detail with this Effectively Handling Crisis To Restore Kubler Ross Change Curve Determining Corporate. Use it as a tool for discussion and navigation on Bargaining, Acceptance, Withdrawal, Corporate Performance. This template is free to edit as deemed fit for your organization. Therefore download it now.
-
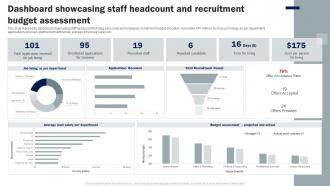 Dashboard Showcasing Staff Headcount And Recruitment Budget Assessment
This slide represents dashboard showcasing staff headcount for hiring personnel and employee recruitment budget allocation. It provides KPI metrics such as job hirings as per department, applications received, staff recruitment funnel, average employee salary etc. Introducing our Dashboard Showcasing Staff Headcount And Recruitment Budget Assessment set of slides. The topics discussed in these slides are Department, Applications Received, Staff Recruitment Funnel. This is an immediately available PowerPoint presentation that can be conveniently customized. Download it and convince your audience.
-
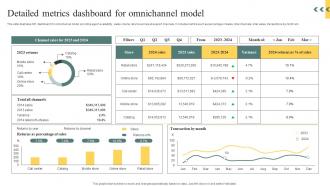 Detailed Metrics Dashboard For Omnichannel Model
This slide illustrates KPI dashboard for omnichannel model providing agent availability, sales volume returns across all support channels. It includes metrics such as percentage of sales, total channels, total sales, transactions by month etc. Presenting our well structured Detailed Metrics Dashboard For Omnichannel Model. The topics discussed in this slide are Dashboard, Omnichannel, Transactions. This is an instantly available PowerPoint presentation that can be edited conveniently. Download it right away and captivate your audience.
-
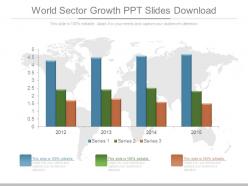 World sector growth ppt slides download
Presenting world sector growth ppt slides download. This is a world sector growth ppt slides download. This is a four stage process. The stages in this process are graph, management, strategy, business, success.
-
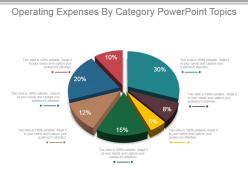 Operating expenses by category powerpoint topics
Presenting operating expenses by category powerpoint topics. This is a operating expenses by category powerpoint topics. This is a seven stage process. The stages in this process are business, management, marketing, finance, pie.


