Charts, Graphs PowerPoint Designs, Presentation Charts Designs & PPT Graphics
- Sub Categories
-
- Arrows and Targets
- Bullet and Text Slides
- Charts and Graphs
- Circular Cycle Diagrams
- Concepts and Shapes
- Custom Flat Designs
- Dashboards and Measuring
- Flow Process
- Funnels
- Gears
- Growth
- Harvey Balls
- Idea Innovation and Light Bulbs
- Leadership
- Linear Process Diagrams
- Magnifying Glass
- Misc Other Graphics
- Opportunity and Handshake
- Organization Charts
- Puzzles
- Pyramids
- Roadmaps and Timelines
- Silhouettes
- Steps
- Strategic Planning Analysis
- SWOT Analysis
- Tables and Matrix
- Teamwork
- Technology and Communication
- Venn Diagrams
- Visuals and Illustrations
-
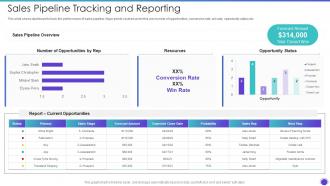 Sales Pipeline Tracking And Reporting Sales Pipeline Management Strategies
This slide shows dashboard to track the performance of sales pipeline. Major points covered under this are number of opportunities, conversion rate, win rate, opportunity status etc. Deliver an outstanding presentation on the topic using this Sales Pipeline Tracking And Reporting Sales Pipeline Management Strategies. Dispense information and present a thorough explanation of Sales Pipeline Overview, Resources, Opportunity using the slides given. This template can be altered and personalized to fit your needs. It is also available for immediate download. So grab it now.
-
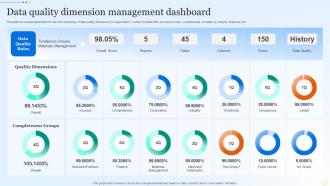 Data Quality Dimension Management Dashboard
This slide showcases dashboard for real time monitoring of data quality dimensions for organization. It further includes KPIs such as accuracy, completeness, consistency, integrity, timeliness, etc. Introducing our Data Quality Dimension Management Dashboard set of slides. The topics discussed in these slides are Data Quality Rules,Timeliness Groups,Materials Management,Quality Dimensions. This is an immediately available PowerPoint presentation that can be conveniently customized. Download it and convince your audience.
-
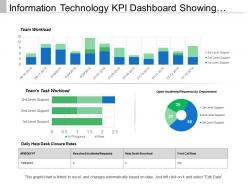 Information technology kpi dashboard showing team task workload
Presenting this set of slides with name - Information Technology Kpi Dashboard Showing Team Task Workload. This is a three stage process. The stages in this process are Information Technology, It, Iot.
-
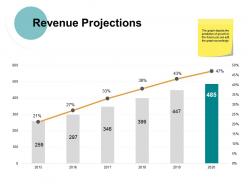 Revenue projections ppt powerpoint presentation file designs download
Presenting this set of slides with name - Revenue Projections Ppt Powerpoint Presentation File Designs Download. This is a two stage process. The stages in this process are Finance, Management, Strategy, Business, Marketing.
-
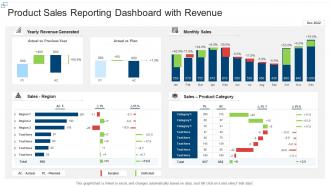 Product sales reporting dashboard snapshot with revenue
Presenting our well structured Product Sales Reporting Dashboard Snapshot With Revenue. The topics discussed in this slide are Revenue, Plan, Sales. This is an instantly available PowerPoint presentation that can be edited conveniently. Download it right away and captivate your audience.
-
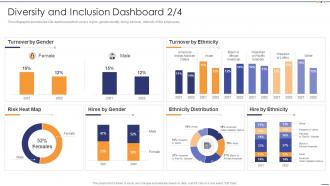 Diversity And Inclusion Dashboard Turnover Setting Diversity And Inclusivity Goals
This infographic provides the D and I dashboard which covers region, gender identity, hiring, turnover, ethnicity of the employees. Deliver an outstanding presentation on the topic using this Diversity And Inclusion Dashboard Turnover Setting Diversity And Inclusivity Goals. Dispense information and present a thorough explanation of Turnover By Gender, Turnover By Ethnicity, Ethnicity Distribution using the slides given. This template can be altered and personalized to fit your needs. It is also available for immediate download. So grab it now.
-
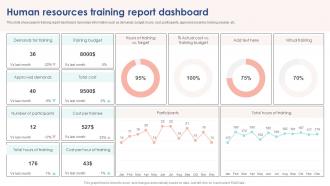 Human Resources Training Report Dashboard
This slide showcases hr training report dashboard. It provides information such as demands, budget, hours, cost, participants, approved sessions, training session, etc. Introducing our Human Resources Training Report Dashboard set of slides. The topics discussed in these slides are Demands For Training, Training Budget, Approved Demands. This is an immediately available PowerPoint presentation that can be conveniently customized. Download it and convince your audience.
-
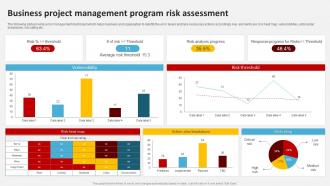 Business Project Management Program Risk Assessment
The following slide provide a risk management dashboard which helps business and organisation to identify the error levels and take necessary actions accordingly. Key elements are risk heat map, vulnerabilities, action plan breakdown, risk rating etc.Presenting our well structured Business Project Management Program Risk Assessment. The topics discussed in this slide are Response Progress, Average Risk Threshold, Management Program. This is an instantly available PowerPoint presentation that can be edited conveniently. Download it right away and captivate your audience.
-
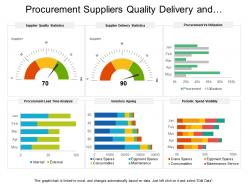 Procurement suppliers quality delivery and utilization dashboard
Presenting this set of slides with name - Procurement Suppliers Quality Delivery And Utilization Dashboard. This is a six stage process. The stages in this process are Purchase, Procurement, Buy.
-
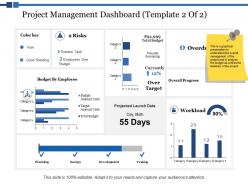 Project management dashboard risks ppt powerpoint presentation styles outfit
This is a threee stages process. The stages in this process are Finance, Marketing, Management, Investment, Analysis.
-
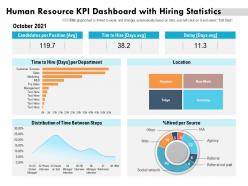 Human resource kpi dashboard with hiring statistics
Introducing our Human Resource KPI Dashboard With Hiring Statistics set of slides. The topics discussed in these slides are Human Resource KPI Dashboard With Hiring Statistics. This is an immediately available PowerPoint presentation that can be conveniently customized. Download it and convince your audience.
-
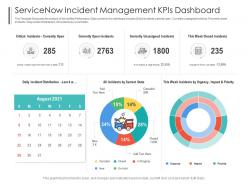 Servicenow incident management kpis dashboard snapshot powerpoint template
This Template Showcases the analysis of ServiceNow Performance. Data covered in this dashboard includes-Critical incidents-currently open , Currently unassigned incidents, This week closed incidents. Daily incident Distribution, All incidents by current state. This is a Servicenow Incident Management Kpis Dashboard Snapshot Powerpoint Template featuring in built editable components to add your personal touches. Tailor this template as per your liking and display it on a widescreen or standard screen, the choice is yours.
-
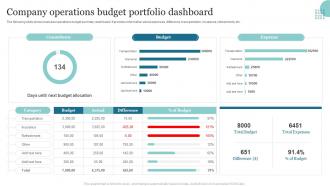 Company Operations Budget Portfolio Dashboard
The following slide shows business operations budget summary dashboard. It provides information about expenses, difference, transportation, insurance, refreshment, etc. Presenting our well structured Company Operations Budget Portfolio Dashboard. The topics discussed in this slide are Transportation, Refreshment, Insurance. This is an instantly available PowerPoint presentation that can be edited conveniently. Download it right away and captivate your audience.
-
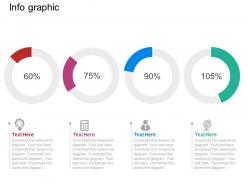 Use pie charts with percentage and icons flat powerpoint design
Modifiable PPT Slide with pie charts with percentage and icons. Compatible with numerous format options like JPEG, JPG or PDF. Provides a professional outlook to your PowerPoint presentation. Icons are also be added. Customization of each PowerPoint graphic and text according to your desire and want. Available in Widescreen slide size also. Freedom to customize it with company name and logo. Beneficial for business professionals, students, teachers, business analysts and strategists. Compatible with Google slides as well.
-
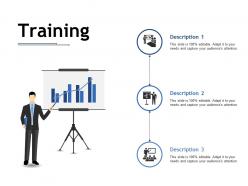 Training ppt infographics example file
Presenting this set of slides with name - Training Ppt Infographics Example File. This is a three stage process. The stages in this process are Description, Training, Task.
-
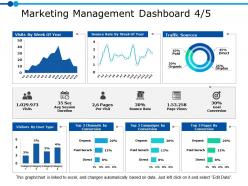 Marketing management dashboard 4 5 ppt powerpoint presentation gallery example
Presenting this set of slides with name - Marketing Management Dashboard 4 5 Ppt Powerpoint Presentation Gallery Example. This is a three stage process. The stages in this process are Business, Management, Strategy, Analysis, Marketing.
-
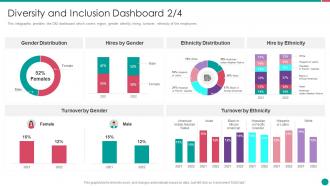 Diversity and inclusion management diversity and inclusion dashboard
This infographic provides the D and I dashboard which covers region, gender identity, hiring, turnover, ethnicity of the employees. Present the topic in a bit more detail with this Diversity And Inclusion Management Diversity And Inclusion Dashboard. Use it as a tool for discussion and navigation on Diversity And Inclusion Dashboard. This template is free to edit as deemed fit for your organization. Therefore download it now.
-
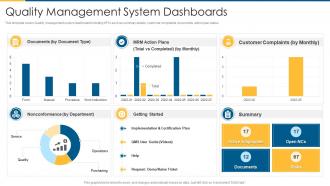 Iso 9001 quality management system dashboards
This template covers Quality management system dashboard including KPIs such as summary details, customer complaints, documents, action plan status. Deliver an outstanding presentation on the topic using this Iso 9001 Quality Management System Dashboards. Dispense information and present a thorough explanation of Quality Management System Dashboards using the slides given. This template can be altered and personalized to fit your needs. It is also available for immediate download. So grab it now.
-
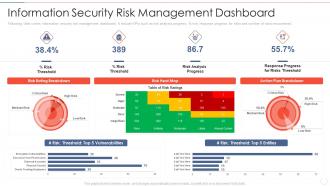 Information security dashboard effective information security risk management process
Following slide covers information security risk management dashboard. It include KPIs such as risk analysis progress, persent risk, response progress for risks and number of risks encountered.Present the topic in a bit more detail with this Information Security Dashboard Effective Information Security Risk Management Process. Use it as a tool for discussion and navigation on Risk Rating Breakdown, Risk Analysis Progress Action Plan Breakdown. This template is free to edit as deemed fit for your organization. Therefore download it now.
-
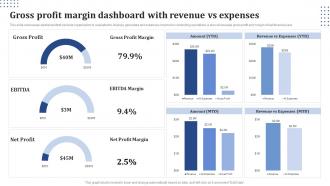 Gross Profit Margin Dashboard With Revenue Vs Expenses
This slide showcases dashboard that can help organization to evaluate the revenue generated and expenses incurred in conducting operations. It also showcases gross profit and margin of last financial year. Presenting our well-structured Gross Profit Margin Dashboard With Revenue Vs Expenses. The topics discussed in this slide are Gross Profit Margin, Dashboard, Revenue Vs Expenses. This is an instantly available PowerPoint presentation that can be edited conveniently. Download it right away and captivate your audience.
-
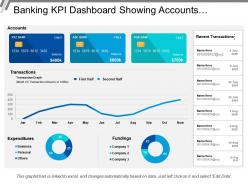 Banking kpi dashboard showing accounts expenditures fundings
Presenting this set of slides with name - Banking Kpi Dashboard Showing Accounts Expenditures Fundings. This is a three stage process. The stages in this process are Banking, Finance, Money.
-
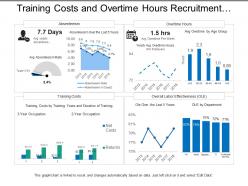 Training costs and overtime hours recruitment dashboard
Presenting this set of slides with name - Training Costs And Overtime Hours Recruitment Dashboard. This is a four stage process. The stages in this process are Staffing Plan, Recruitment, Staff Management.
-
 Attrition chart with different types of employees
Presenting this set of slides with name Attrition Chart With Different Types Of Employees. The topics discussed in these slides are Total Salary, Average Salary, Turnover Rate, Absenteeism Rate, Average Age. This is a completely editable PowerPoint presentation and is available for immediate download. Download now and impress your audience.
-
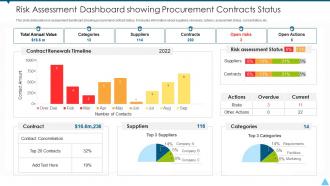 Risk assessment dashboard showing procurement contracts status
Presenting our well structured Risk Assessment Dashboard Showing Procurement Contracts Status. The topics discussed in this slide are Suppliers, Risks, Value. This is an instantly available PowerPoint presentation that can be edited conveniently. Download it right away and captivate your audience.
-
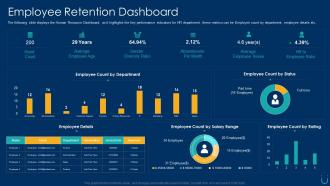 Employee retention plan retention dashboard
The following slide displays the Human Resource Dashboard, as it highlights the key performance indicators for HR department, these metrics can be Employee count by department, employee details etc.. Present the topic in a bit more detail with this Employee Retention Plan Retention Dashboard. Use it as a tool for discussion and navigation on Employee, Retention, Dashboard. This template is free to edit as deemed fit for your organization. Therefore download it now.
-
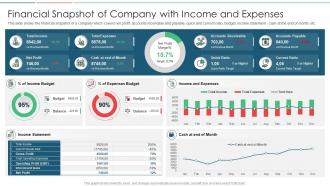 Financial snapshot of company with income and expenses
Presenting our well structured Financial Snapshot Of Company With Income And Expenses. The topics discussed in this slide are Income Budget, Expenses Budget, Income And Expenses. This is an instantly available PowerPoint presentation that can be edited conveniently. Download it right away and captivate your audience.
-
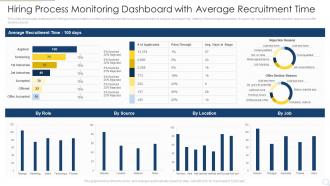 Hiring Process Monitoring Dashboard With Average Recruitment Time
This slide showcases dashboard for hiring process monthly monitoring that can assist human resource team to analyze and report key metrics of recruitment procedure. It covers key elements that are rejection reason and offer decline reason Presenting our well structured Hiring Process Monitoring Dashboard With Average Recruitment Time. The topics discussed in this slide are Process, Monitoring, Dashboard. This is an instantly available PowerPoint presentation that can be edited conveniently. Download it right away and captivate your audience.
-
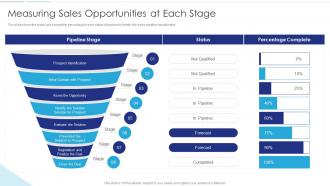 Sales Funnel Management Measuring Sales Opportunities At Each Stage
This slide shows the status and completion percentage to each stage of pipeline to identify the sales pipeline opportunities. Present the topic in a bit more detail with this Sales Funnel Management Measuring Sales Opportunities At Each Stage. Use it as a tool for discussion and navigation on Pipeline Stage, Prospect Identification, Forecast, Percentage Complete. This template is free to edit as deemed fit for your organization. Therefore download it now.
-
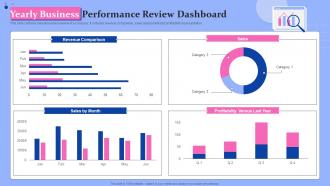 Yearly Business Performance Review Dashboard
This slide contains annual business review of a company. It includes revenue comparison, sales assessment and profitability representation. Introducing our Yearly Business Performance Review Dashboard set of slides. The topics discussed in these slides are Revenue Comparison, Sales, Sales By Month, Profitability, Last Year. This is an immediately available PowerPoint presentation that can be conveniently customized. Download it and convince your audience.
-
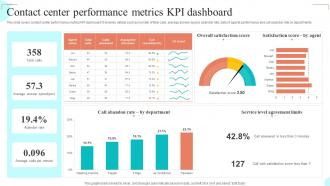 Contact Center Performance Metrics KPI Dashboard
This slide covers contact center performance metrics KPI dashboard. It involves details such as number of total calls, average answer speed, abandon rate, data of agents performance and call abandon rate by departments. Presenting our well structured Contact Center Performance Metrics KPI Dashboard The topics discussed in this slide are Call Abandon Rate, Overall Satisfaction Score, Satisfaction Score This is an instantly available PowerPoint presentation that can be edited conveniently. Download it right away and captivate your audience.
-
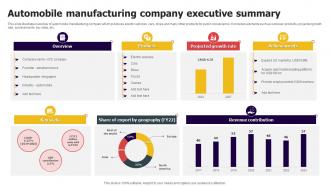 Automobile Manufacturing Company Executive Summary
This slide illustrates overview of automobile manufacturing company which produces electric vehicles, cars, bikes and many other products for public convenience. It includes elements such as overview, products, projected growth rate, achievements, key stats, etc. Introducing our Automobile Manufacturing Company Executive Summary set of slides. The topics discussed in these slides are Overview, Products, Achievements. This is an immediately available PowerPoint presentation that can be conveniently customized. Download it and convince your audience.
-
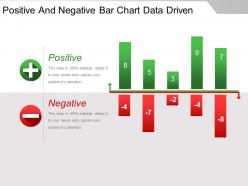 Positive and negative bar chart data driven powerpoint guide
Presenting positive and negative bar chart data driven powerpoint guide. This is a positive and negative bar chart data driven powerpoint guide. This is a two stage process. The stages in this process are positive, negative.
-
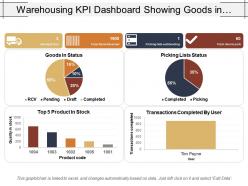 Warehousing kpi dashboard showing goods in status
The presentation design is easy to edit by anyone even having without any specific knowledge. Design elements are editable including font, type, color, size, style, shape, background, images etc. Slides are completely compatible with Google Slides and MS PowerPoint software. Both standard and full screen view available; no change on design quality will happen when opened on full screen view.
-
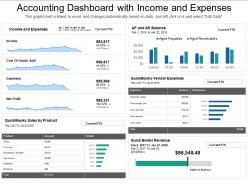 Accounting dashboard with income and expenses
Presenting accounting dashboard with income and expenses PPT slideshow. Loaded with incomparable benefits. Readymade PPT graphic helps in saving time and effort. Can be personalized by adding company trademark, logo, brand and symbols. Can be utilized for displaying both simple and complex information. Include or exclude slide content as per your individual need. Colors and text can be easily changed as the PPT slide is completely editable. Useful for every business leader and professional, project management team, business analysts, etc.
-
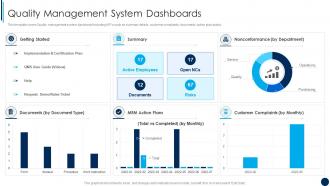 Quality Management System Dashboards ISO 9001 Quality Management Ppt Themes
This template covers Quality management system dashboard including KPIs such as summary details, customer complaints, documents, action plan status. Deliver an outstanding presentation on the topic using this Quality Management System Dashboards ISO 9001 Quality Management Ppt Themes. Dispense information and present a thorough explanation of Quality Management System Dashboards using the slides given. This template can be altered and personalized to fit your needs. It is also available for immediate download. So grab it now.
-
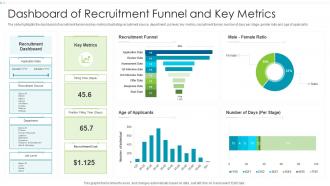 Dashboard Snapshot Of Recruitment Funnel And Key Metrics
The slide highlights the dashboard snapshot of recruitment funnel and key metrics illustrating recruitment source, department, job level, key metrics, recruitment funnel, number of days per stage, gender ratio and age of applicants. Presenting our well structured Dashboard Of Recruitment Funnel And Key Metrics. The topics discussed in this slide are Recruitment Funnel, Male Female Ratio, Recruitment Dashboard. This is an instantly available PowerPoint presentation that can be edited conveniently. Download it right away and captivate your audience.
-
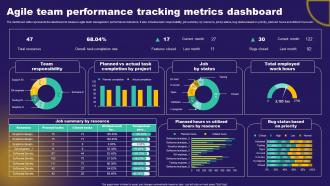 Agile Team Performance Tracking Metrics Dashboard
The mentioned slide represents the dashboard to measure agile team management performance indicators. It also includes team responsibility, job summary by resource, job by status, bug status based on priority, planned hours and utilized hours etc. Introducing our Agile Team Performance Tracking Metrics Dashboard set of slides. The topics discussed in these slides are Team Responsibility, Job By Status. This is an immediately available PowerPoint presentation that can be conveniently customized. Download it and convince your audience.
-
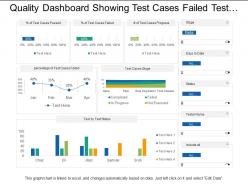 Quality dashboard showing test cases failed test status and in progress
SlideTeam feels immense pleasure in presenting to you its quality dashboard showing test cases failed test status and in progress. Following simple instructions given in the sample template you can easily alter the given set of predesigned slides. You can view the PPT template in standard size display ratio of 4:3 or widescreen display ratio of 16:9. The business slides are very easy to use and operate as they are compatible with Google Slides and can be similarly saved in format of PDF or JPG.
-
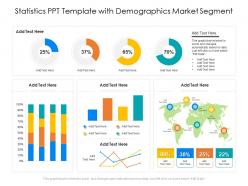 Statistics ppt template with demographics market segment
Presenting this set of slides with name Statistics PPT Template With Demographics Market Segment. The topics discussed in these slide is Statistics PPT Template With Demographics Market Segment. This is a completely editable PowerPoint presentation and is available for immediate download. Download now and impress your audience.
-
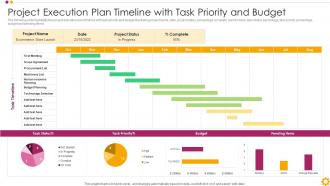 Project Execution Plan Timeline With Task Priority And Budget
The following slide highlights the project execution plan timeline with task priority and budget illustrating project name, date, project status, percentage complete, task timeline, task status percentage, task priority percentage, budget and pending items. Introducing our Project Execution Plan Timeline With Task Priority And Budget set of slides. The topics discussed in these slides are Human Resource Planning, Technology Selection, Machinery List. This is an immediately available PowerPoint presentation that can be conveniently customized. Download it and convince your audience.
-
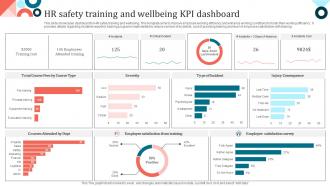 HR Safety Training And Wellbeing KPI Dashboard
This slide showcases dashboard for HR safety training and wellbeing. This template aims to improve employee working efficiency and enhance working conditions to foster their working efficiency. It provides details regarding incidents reported, training programs implemented to reduce number of incidents, cost of providing training and level of employee satisfaction with training. Introducing our HR Safety Training And Wellbeing KPI Dashboard set of slides. The topics discussed in these slides are Course Type, Severity, Type Of Incident, Injury Consequence. This is an immediately available PowerPoint presentation that can be conveniently customized. Download it and convince your audience.
-
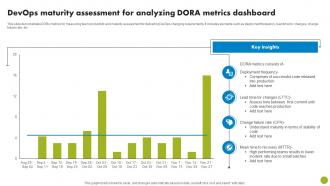 DevOps Maturity Assessment For Analyzing Dora Metrics Dashboard
This slide demonstrates DORA metrics for measuring team productivity and maturity assessment for delivering DevOps changing requirements. It includes elements such as deployment frequency, lead time for changes, change failure rate, etc. Presenting our well structured DevOps Maturity Assessment For Analyzing Dora Metrics Dashboard. The topics discussed in this slide are Deployment Frequency, Change Failure Rate, High Performing Teams. This is an instantly available PowerPoint presentation that can be edited conveniently. Download it right away and captivate your audience.
-
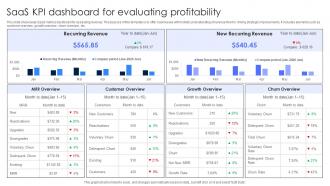 SaaS KPI Dashboard For Evaluating Profitability
This slide showcases SaaS metrics dashboard for assessing revenue. The purpose of this template is to offer businesses with holistic understanding of revenue flow for driving strategic improvements. It includes elements such as customer overview, growth overview, churn overview, etc. Presenting our well structured SaaS KPI Dashboard For Evaluating Profitability. The topics discussed in this slide are Recurring Revenue, New Recurring Revenue, Evaluating Profitability. This is an instantly available PowerPoint presentation that can be edited conveniently. Download it right away and captivate your audience.
-
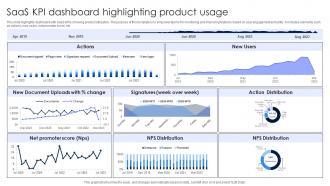 SaaS KPI Dashboard Highlighting Product Usage
This slide highlights dashboard with SaaS KPIs showing product utilization. The purpose of this template is to empower teams for monitoring and improving features based on user engagement and utility. It includes elements such as actions, new users, net promoter score, etc. Introducing our SaaS KPI Dashboard Highlighting Product Usage set of slides. The topics discussed in these slides are New Document Uploads, Net Promoter Score, Product Usage. This is an immediately available PowerPoint presentation that can be conveniently customized. Download it and convince your audience.
-
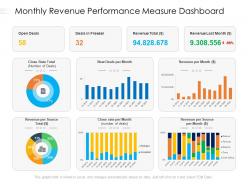 Monthly revenue performance measure dashboard
Presenting this set of slides with name Monthly Revenue Performance Measure Dashboard. The topics discussed in these slides are Revenue, Source, Deals. This is a completely editable PowerPoint presentation and is available for immediate download. Download now and impress your audience.
-
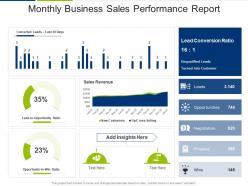 Monthly Business Sales Performance Report
Presenting our well structured Monthly Business Sales Performance Report. The topics discussed in this slide are lead opportunity ratio, sales revenue, lead conversion ratio. This is an instantly available PowerPoint presentation that can be edited conveniently. Download it right away and captivate your audience.
-
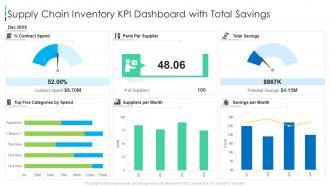 Supply chain inventory kpi dashboard with total savings
Presenting our well-structured Supply Chain Inventory KPI Dashboard With Total Savings. The topics discussed in this slide are Supply Chain Inventory KPI Dashboard With Total Savings. This is an instantly available PowerPoint presentation that can be edited conveniently. Download it right away and captivate your audience.
-
 Current ESG And Future Strategy Ayurvedic Products Company Profile Cp Ss V
This slide highlights the Daburs current ESG and future strategy for non financial factors which includes CSR expenditure and beneficiaries with CSR focus areas.Deliver an outstanding presentation on the topic using this Current ESG And Future Strategy Ayurvedic Products Company Profile Cp Ss V. Dispense information and present a thorough explanation of Improvement Environment, Increase Employee, Compliance Transparency using the slides given. This template can be altered and personalized to fit your needs. It is also available for immediate download. So grab it now.
-
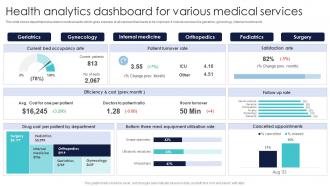 Health Analytics Dashboard For Various Medical Services
This slide shows department wise data in medical sector which gives overview of all services that needs to be improved. It include services like geriatrics, gynecology, internal medicine etc. Presenting our well structured Health Analytics Dashboard For Various Medical Services. The topics discussed in this slide are Geriatrics, Gynecology, Internal Medicine, Orthopedics. This is an instantly available PowerPoint presentation that can be edited conveniently. Download it right away and captivate your audience.
-
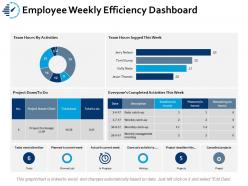 Employee weekly efficiency dashboard snapshot ppt portfolio brochure
Presenting this set of slides with name - Employee Weekly Efficiency Dashboard Snapshot Ppt Portfolio Brochure. This is a two stage process. The stages in this process are Business, Management, Strategy, Sales, Marketing.
-
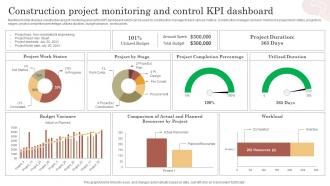 Construction Project Monitoring And Control Kpi Dashboard
Mentioned slide displays construction project monitoring and control KPI dashboard which can be used by construction manager to track various metrics. Construction manager can track metrics like project work status, projects by stages, project completion percentage, utilized duration, budget variance , workload etc. Introducing our Construction Project Monitoring And Control Kpi Dashboard set of slides. The topics discussed in these slides are Project Completion Percentage, Budget Variance, Project Work Status. This is an immediately available PowerPoint presentation that can be conveniently customized. Download it and convince your audience.
-
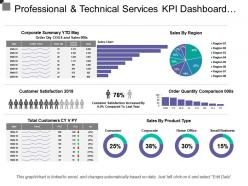 Professional and technical services kpi dashboard showing sales by region
Presenting this set of slides with name - Professional And Technical Services Kpi Dashboard Showing Sales By Region. This is a three stage process. The stages in this process are Professional And Technical Services, Services Management, Technical Management.
-
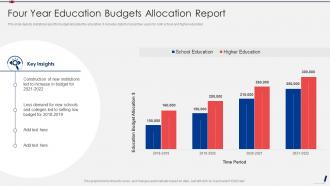 Four Year Education Budgets Allocation Report
This slide depicts statistical report for budget allocated for education. It includes data from past four years for both school and higher education. Introducing our Four Year Education Budgets Allocation Report set of slides. The topics discussed in these slides are Education Budget Allocation. This is an immediately available PowerPoint presentation that can be conveniently customized. Download it and convince your audience.
-
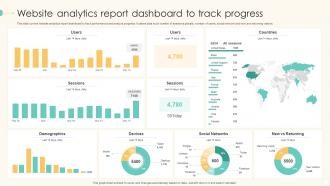 Website Analytics Report Dashboard Snapshot To Track Progress
This slide covers website analytics report dashboard snapshot to track performance and analyze progress. It caters data such number of sessions globally, number of users, social network and new and returning visitors. Presenting our well-structured Website Analytics Report Dashboard To Track Progress. The topics discussed in this slide are Website Analytics Report, Dashboard, Track Progress. This is an instantly available PowerPoint presentation that can be edited conveniently. Download it right away and captivate your audience.
-
 Project Tracker Dashboard With Multiple Metrics
The following slide highlights the KPI of project management to avoid deviations. It includes elements such as schedule, tasks, issue assessment, budget and risk analysis etc. Introducing our Project Tracker Dashboard With Multiple Metrics set of slides. The topics discussed in these slides areProjected Budget Analysis, Risk Analysis, Issue Assessment. This is an immediately available PowerPoint presentation that can be conveniently customized. Download it and convince your audience.
-
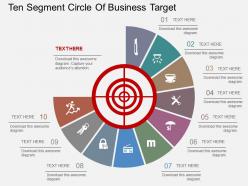 Hz ten segment circle of business target flat powerpoint design
Presenting hz ten segment circle of business target flat powerpoint design. This Power Point template diagram has been crafted with graphic of ten segment circle diagram. This PPT diagram contains the concept of business target achievement. Use this PPT diagram for business and marketing related presentations.
-
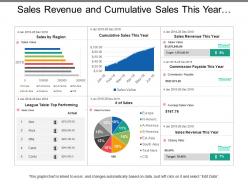 Sales revenue and cumulative sales this year dashboards
Presenting this set of slides with name - Sales Revenue And Cumulative Sales This Year Dashboards. Completely amendable presentation design as some elements are editable. Ease to personalize the slide with your company name, logo and even tag line. PowerPoint slide can be downloaded easily and transform into JPG and PDF format. More designs can be accessed with different nodes and stages. PPT diagram can be projected in standard and widescreen view. Great use of colors and innovatively designed. PPT template is compatible with Google slides.
-
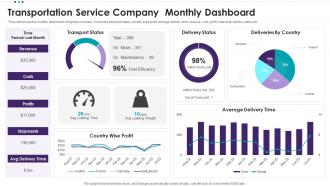 Transportation Service Company Monthly Dashboard
This slide shows the monthly dashboard of logistics company. It includes transport status, country wise profit, average delivery time, revenue, cost, profit, shipment, delivery status etc. Presenting our well structured Transportation Service Company Monthly Dashboard. The topics discussed in this slide are Transport Status, Delivery Status, Deliveries By Country, Average Delivery Time, Country Wise Profit. This is an instantly available PowerPoint presentation that can be edited conveniently. Download it right away and captivate your audience.
-
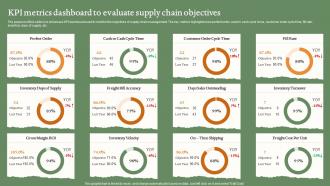 KPI Metrics Dashboard To Evaluate Supply Chain Objectives
The purpose of this slide is to showcase KPI dashboard used to monitor the objectives of supply chain management. The key metrics highlighted are perfect order, cash to cash cycle tome, customer order cycle time, fill rate, inventory days of supply, etc. Introducing our KPI Metrics Dashboard To Evaluate Supply Chain Objectives set of slides. The topics discussed in these slides are KPI Metrics Dashboard, Evaluate, Supply Chain Objectives. This is an immediately available PowerPoint presentation that can be conveniently customized. Download it and convince your audience.
-
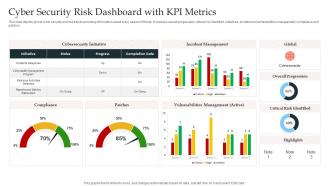 Cyber Security Risk Dashboard Snapshot With KPI Metrics
This slide depicts global cyber security and risk trends providing information about every aspect of threat. It includes overall progression, critical risk identified, initiatives, incident and vulnerabilities management, compliance and patches. Introducing our Cyber Security Risk Dashboard Snapshot With KPI Metrics set of slides. The topics discussed in these slides are Incident Management, Global, Cybersecurity, Vulnerabilities Management. This is an immediately available PowerPoint presentation that can be conveniently customized. Download it and convince your audience.


