Charts, Graphs PowerPoint Designs, Presentation Charts Designs & PPT Graphics
- Sub Categories
-
- Arrows and Targets
- Bullet and Text Slides
- Charts and Graphs
- Circular Cycle Diagrams
- Concepts and Shapes
- Custom Flat Designs
- Dashboards and Measuring
- Flow Process
- Funnels
- Gears
- Growth
- Harvey Balls
- Idea Innovation and Light Bulbs
- Leadership
- Linear Process Diagrams
- Magnifying Glass
- Misc Other Graphics
- Opportunity and Handshake
- Organization Charts
- Puzzles
- Pyramids
- Roadmaps and Timelines
- Silhouettes
- Steps
- Strategic Planning Analysis
- SWOT Analysis
- Tables and Matrix
- Teamwork
- Technology and Communication
- Venn Diagrams
- Visuals and Illustrations
-
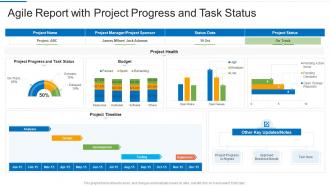 Agile report with project progress and task status
Introducing our Agile Report With Project Progress And Task Status set of slides. The topics discussed in these slides are Budget, Project Timeline, Implement, Development, Analysis. This is an immediately available PowerPoint presentation that can be conveniently customized. Download it and convince your audience.
-
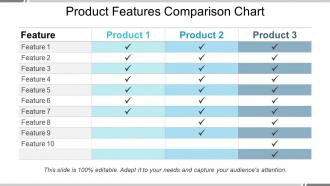 Product features comparison chart powerpoint slide designs
Presenting product features comparison chart PowerPoint design template. The slideshow allows full editing. Modify and customize the design by changing font type, color and other design elements. Quick and instant downloading on a single click available. High-resolution icons are used to explain the concept of product feature comparison matrix. Design template can be opened and edited with Google Slides and MS PowerPoint software.
-
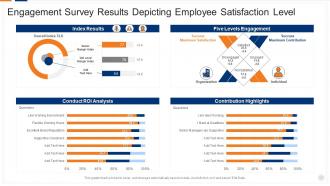 Engagement Survey Results Depicting Employee Satisfaction Level
Introducing our Engagement Survey Results Depicting Employee Satisfaction Level set of slides. The topics discussed in these slides are Engagement Survey Results Depicting Employee Satisfaction Level. This is an immediately available PowerPoint presentation that can be conveniently customized. Download it and convince your audience.
-
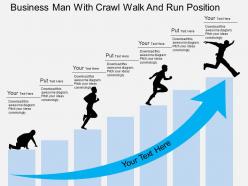 Pd business man with crawl walk and run position flat powerpoint design
Visually stunning PPT presentation illustrations. Offers thousands of icons and numerous colours to alter the appearance. Beneficial for the organisations, investors, clients and customers. Capable of enhancing the image and profits of the enterprise. Completely professional look and feel. 100% modifiable as per the needs of the user.
-
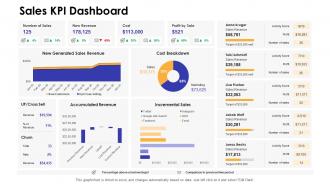 Sales kpi dashboard dashboards by function
Present the topic in a bit more detail with this Sales Kpi Dashboard Dashboards By Function. Use it as a tool for discussion and navigation on Sales Kpi Dashboard. This template is free to edit as deemed fit for your organization. Therefore download it now.
-
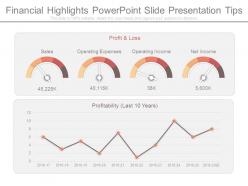 Financial highlights powerpoint slide presentation tips
Presenting financial highlights powerpoint slide presentation tips. This is a financial highlights powerpoint slide presentation tips. This is a four stage process. The stages in this process are sales, operating expenses, operating income, net income, profitability.
-
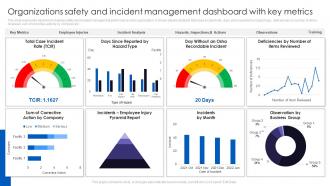 Organizations Safety And Incident Management Dashboard With Key Metrics
This slide represents dashboard showing safety and incident management performance of an organization. It shows details related to total case incident rate, days since reported by hazard type, deficiencies by number of items reviewed, sum of corrective actions by company etc. Introducing our Organizations Safety And Incident Management Dashboard With Key Metrics set of slides. The topics discussed in these slides are Employee Injuries, Incident Analysis, Observations. This is an immediately available PowerPoint presentation that can be conveniently customized. Download it and convince your audience.
-
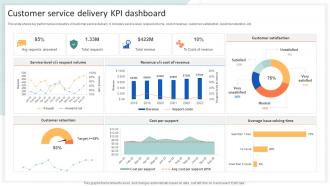 Customer Service Delivery KPI Dashboard
This slide shows key performance indicators of customer service delivery. It includes service level, request volume, cost of revenue, customer satisfaction, customer retention, etc. Presenting our well structured Customer Service Delivery KPI Dashboard. The topics discussed in this slide are Customer Retention, Cost Per Support, Average Issue Solving Time. This is an instantly available PowerPoint presentation that can be edited conveniently. Download it right away and captivate your audience.
-
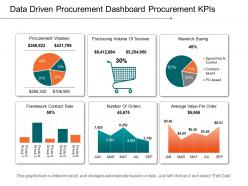 Data driven procurement dashboard snapshot procurement kpis example of ppt
Pre-designed data driven procurement dashboard for Kpis presentation template. Can be used for statistical data analysis. High-resolution PowerPoint presentation backgrounds for better clarity of the information displayed. Offers wide variety of options and colors to alter the appearance. Allows adding of enterprise personal details such as brand name, logo and much more. Enough space available to enter text and its related points in the PPT table. This PPT Slide is available in both Standard and Widescreen slide size. Compatible with multiple formats like JPEG, PDF and Google slides.
-
 Data Review Planning And Preparing Gathering Evidence
This PPT deck displays sixteen slides with in depth research. Our topic oriented Data Review Planning And Preparing Gathering Evidence presentation deck is a helpful tool to plan, prepare, document and analyse the topic with a clear approach. We provide a ready to use deck with all sorts of relevant topics subtopics templates, charts and graphs, overviews, analysis templates. Outline all the important aspects without any hassle. It showcases of all kind of editable templates infographs for an inclusive and comprehensive Data Review Planning And Preparing Gathering Evidence presentation. Professionals, managers, individual and team involved in any company organization from any field can use them as per requirement.
-
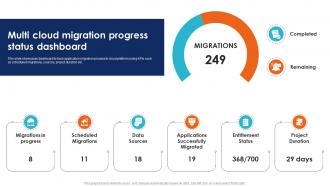 Multi Cloud Migration Progress Status Seamless Data Transition Through Cloud CRP DK SS
This slide showcases dashboard to track application migration process to cloud platform using KPIs such as scheduled migrations, sources, project duration etc. Present the topic in a bit more detail with this Multi Cloud Migration Progress Status Seamless Data Transition Through Cloud CRP DK SS. Use it as a tool for discussion and navigation on Migrations In Progress, Scheduled Migrations, Data Sources, Entitlement Status. This template is free to edit as deemed fit for your organization. Therefore download it now.
-
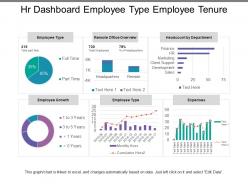 Hr dashboard employee type employee tenure
Presenting this set of slides with name - Hr Dashboard Employee Type Employee Tenure. This is a six stage process. The stages in this process are Hr Dashboard, Human Resource Dashboard, Hr Kpi.
-
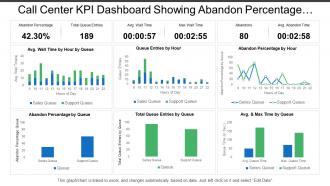 Call center kpi dashboard showing abandon percentage total queue entries
PowerPoint shape easy to amend as color, text, font etc are amendable. Notable quality presentation template. Well-adjusted online software programs such as JPG and PDF. Extra-ordinary picture quality as pixels don’t break when viewed in widescreen view. PPT design goes well with Google slides. Matching designs available with different nodes and stages. Handy presentation design saves you valuable time. Show the PowerPoint diagram with your corporate sign and title. Easy to download and can be saved for future reference.
-
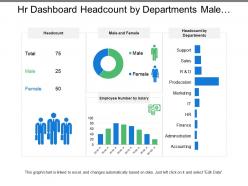 Hr dashboard headcount by departments male and female
Presenting this set of slides with name - Hr Dashboard Headcount By Departments Male And Female. This is a three stage process. The stages in this process are Hr Dashboard, Human Resource Dashboard, Hr Kpi.
-
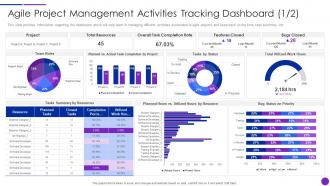 Agile Project Management Lean Agile Project Management Playbook
This slide provides information regarding the dashboard which will help team in managing different activities associated to agile projects and keep track on the time, task summary, etc. Deliver an outstanding presentation on the topic using this Agile Project Management Lean Agile Project Management Playbook. Dispense information and present a thorough explanation of Planned Hours, Team Roles, Planned Tasks using the slides given. This template can be altered and personalized to fit your needs. It is also available for immediate download. So grab it now.
-
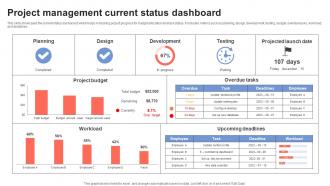 Project Management Current Status Dashboard
This slide showcases the current status dashboard, which helps in tracking project progress for budget allocation and task status. It includes metrics such as planning, design, development, testing, budget, overdue tasks, workload, and deadlines. Presenting our well structured Project Management Current Status Dashboard The topics discussed in this slide are Planning, Design, Development This is an instantly available PowerPoint presentation that can be edited conveniently. Download it right away and captivate your audience.
-
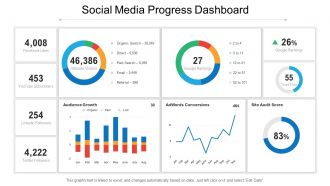 Social media progress dashboard snapshot
Presenting this set of slides with name Social Media Progress Dashboard Snapshot. The topics discussed in these slides are Progress Dashboard, Chart And Graph, Finance, Marketing. This is a completely editable PowerPoint presentation and is available for immediate download. Download now and impress your audience.
-
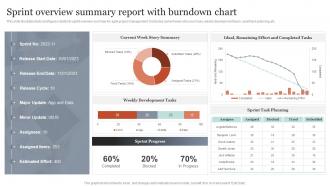 Sprint Overview Summary Report With Burndown Chart
This slide illustrates facts and figures related to sprint overview summary for agile project management. It includes current week story summary, weekly development tasks, sprint task planning, etc. Presenting our well structured Sprint Overview Summary Report With Burndown Chart. The topics discussed in this slide are Sprint Overview, Summary Report, Burndown Chart. This is an instantly available PowerPoint presentation that can be edited conveniently. Download it right away and captivate your audience.
-
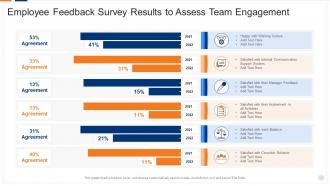 Employee Feedback Survey Results To Assess Team Engagement
Presenting our well structured Employee Feedback Survey Results To Assess Team Engagement. The topics discussed in this slide are Employee Feedback Survey Results To Assess Team Engagement. This is an instantly available PowerPoint presentation that can be edited conveniently. Download it right away and captivate your audience.
-
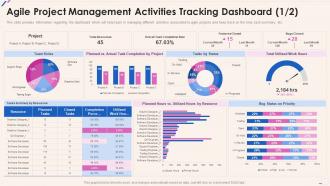 Project Management Activities Tracking Dashboard Agile Playbook Agile
This slide provides information regarding the dashboard which will help team in managing different activities associated to agile projects and keep track on the time, task summary, etc. Present the topic in a bit more detail with this Project Management Activities Tracking Dashboard Agile Playbook Agile. Use it as a tool for discussion and navigation on Project, Total Resources, Overall Task Completion Rate, Features Closed, Bugs Closed. This template is free to edit as deemed fit for your organization. Therefore download it now.
-
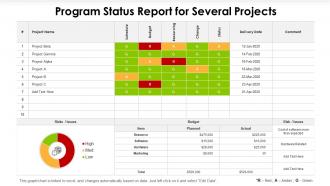 Program status report for several projects
Presenting this set of slides with name Program Status Report For Several Projects. The topics discussed in these slides are Budget, Resource, Marketing. This is a completely editable PowerPoint presentation and is available for immediate download. Download now and impress your audience.
-
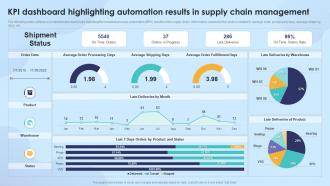 KPI Dashboard Highlighting Automation Results In Supply Chain Strengthening Process Improvement
The following slide outlines a comprehensive dashboard depicting the business process automation BPA results in the supply chain. Information covered in the slide is related to average order processing days, average shipping days, etc. Present the topic in a bit more detail with this KPI Dashboard Highlighting Automation Results In Supply Chain Strengthening Process Improvement. Use it as a tool for discussion and navigation on Shipment Status, Average Order Processing Days, Average Order Fulfillment Days, Late Deliveries By Warehouse, Late Deliveries Product. This template is free to edit as deemed fit for your organization. Therefore download it now.
-
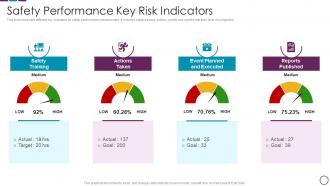 Safety Performance Key Risk Indicators
slide shows the different key indicators for safety performance measurement . It includes safety training, actions, events and reports with their level of completion. Introducing our Safety Performance Key Risk Indicators set of slides. The topics discussed in these slides are Safety Performance Key Risk Indicators. This is an immediately available PowerPoint presentation that can be conveniently customized. Download it and convince your audience.
-
 Solar Energy Introduction Powerpoint Presentation Slides
Presenting Solar Energy Introduction PowerPoint Presentation Slides. Change PPT templates as per your requirements in colors, fonts and texts. This PowerPoint slide is supported by Google slides. Quick and easy downloadable icon and supports other formats like JPEG and PDF. Fit for corporate, business, sales and marketing teams. Data entry of company name, logo and trademark is easy. Quality of image remains similar even when see it on widescreen view.
-
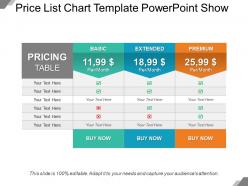 Price list chart template powerpoint show
Presenting price list chart template PowerPoint show slideshow which is 100% editable. This PPT template is crafted with attractive display and unique components. This PPT slide is easy to customize and enables you to personalize it as per your own criteria. The presentation slide is fully compatible with Google slides, multiple format and software options. In case of any assistance, kindly take instructions from our presentation design services and it is easy to download in a very short span of time. The images, layouts, designs are of high quality and ensures quality in widescreen.
-
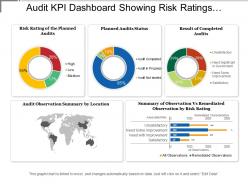 Audit kpi dashboard showing risk ratings planned audit status
Presenting this set of slides with name - Audit Kpi Dashboard Showing Risk Ratings Planned Audit Status. This is a five stage process. The stages in this process are Audit, Examine, Survey.
-
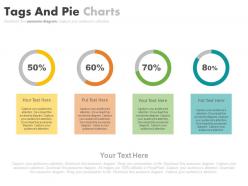 Four Staged Tags And Pie Charts Percentage Analysis Powerpoint Slides
Presenting four staged tags and pie charts percentage analysis powerpoint slides. This Power Point template slide has been crafted with graphic of four staged tags and pie charts. This PPT slide contains the concept of percentage analysis. Use this PPT slide for business and marketing related presentations.
-
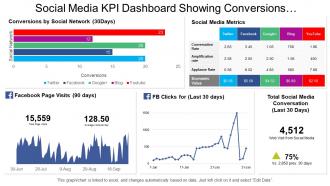 Social media kpi dashboard showing conversions by social network and metrics
Presenting this set of slides with name - Social Media Kpi Dashboard Showing Conversions By Social Network And Metrics. This is a five stage process. The stages in this process are Social Media, Digital Marketing, Social Marketing.
-
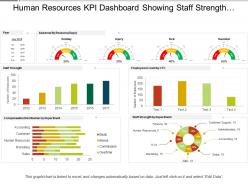 Human resources kpi dashboard showing staff strength compensation distribution
SlideTeam presenting Human Resources Kpi Dashboard Showing Staff Strength Compensation Distribution PPT. It will not only help you in knowing the exact strength of the staff but also about actual staff required in the organization. This slideshow is entirely editable and you can edit it whenever you want. All the slides in this presentation are compatible with Google slides. You can enter thousands of relatable icons of your own choice. You can also change from 4:3 standard screen size to 16:9 widescreen size.
-
 Circular interconnected organizational chart
Presenting this set of slides with name Circular Interconnected Organizational Chart. This is a one stage process. The stages in this process are Circular Organizational Chart, Hierarchy Organizational Chart, Interconnected Organizational Chart. This is a completely editable PowerPoint presentation and is available for immediate download. Download now and impress your audience.
-
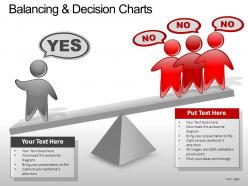 Balancing Decision Charts Powerpoint Presentation Slides
These high quality, editable pre-designed powerpoint slides have been carefully created by our professional team to help you impress your audience. Each graphic in every slide is vector based and is 100% editable in powerpoint. Each and every property of any slide - color, size, shading etc can be modified to build an effective powerpoint presentation. Use these slides to convey complex business concepts in a simplified manner. Any text can be entered at any point in the powerpoint slide. Simply DOWNLOAD, TYPE and PRESENT!
-
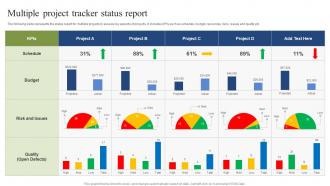 Multiple Project Tracker Status Report
The following slide represents the status report for multiple projects to assess key aspects of projects. It includes KPIs such as schedule, budget, resources, risks, issues and quality etc. Introducing our Multiple Project Tracker Status Report set of slides. The topics discussed in these slides are Risk And Issues, Budget, Schedule. This is an immediately available PowerPoint presentation that can be conveniently customized. Download it and convince your audience.
-
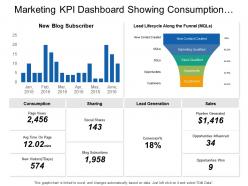 Marketing kpi dashboard showing consumption sharing sales lead generation
As this slideshow is 100% customizable you can easily add or remove anything from the pre-designed slides. You can change the font size, font color and the font style of the text used following instructions given in the sample templates. The orientation, size and the color of various graphical illustrations used in the PPT template are also adjustable. If you download this PPT slideshow you can view it in either standard size screen ratio of 4:3 or wide screen display ratio of 16:9. The PowerPoint presentation can be saved in PDF or JPG format. The slides are fully compatible with Google slides.
-
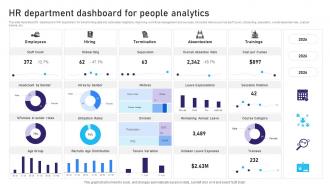 HR Department Dashboard For People Analytics
This slide illustrates KPI Dashboard of HR department for transforming data into actionable insights by improving workforce management and success. It includes metrics such as staff count, onboarding, separation, overall absentee rate, cost per trainee, etc. Introducing our HR Department Dashboard For People Analytics set of slides. The topics discussed in these slides are Employees, Hiring, Termination. This is an immediately available PowerPoint presentation that can be conveniently customized. Download it and convince your audience.
-
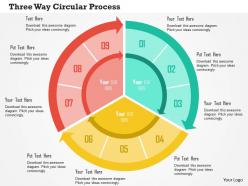 Three way circular process flat powerpoint design
Impactful show of graphical visuals. Extraordinary match of the topic and the PPT components. Impressive designing to incorporate your tailor-made needs. High resolution PowerPoint visuals which do not get pixelate when projected on wide screen. Stunning picture quality does not deer when undergoes modification.
-
 Talent Acquisition And Recruitment Analytics Dashboard
The slide highlights the talent acquisition and recruitment analytics dashboard depicting total application, experience, gender diversity, application type, salary preference, employee details and open positions by department. Introducing our Talent Acquisition And Recruitment Analytics Dashboard set of slides. The topics discussed in these slides are Salary Preference, Application Type, Inexperience Candidates. This is an immediately available PowerPoint presentation that can be conveniently customized. Download it and convince your audience.
-
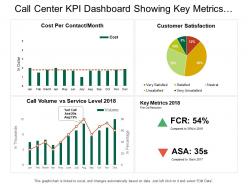 Call center kpi dashboard snapshot showing key metrics customer satisfaction
Introducing call center kpi dashboard snapshot showing key metrics customer satisfaction presentation template. Slide designs quality does not deflect when opened on a wide screen show. Inconvenience free fuse of tweaked shading, content and illustrations. Slide incorporates instructional slides to give direction to change the graphical substance. Spare the presentation graphics in JPG or PDF organize. Successfully valuable for the systems administration experts, mediators and the procedure architects, it administrators, data innovation firms. Format slide with various stages or hubs are accessible. Simplicity of download.
-
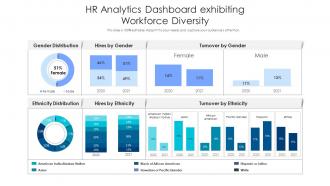 Hr analytics dashboard exhibiting workforce diversity
Presenting our well structured HR Analytics Dashboard Exhibiting Workforce Diversity. The topics discussed in this slide are HR Analytics Dashboard Exhibiting Workforce Diversity. This is an instantly available PowerPoint presentation that can be edited conveniently. Download it right away and captivate your audience.
-
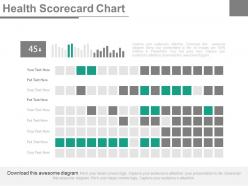 Health scorecard chart ppt slides
Simple and scholarly slide outline. Utilization of outwardly amazing hues. Shocking picture quality. High determination pictures don't pixelate when anticipated on wide screen. Perfect with various programming and arrangement alternatives. 100 percent editable slide outline parts. Change the introduction components according to the need of 60 minutes. Customize the PPT with your organization name and logo. Utilized by business people, advertisers, administrative office, partners and understudies.The stages in this process are finance, marketing, strategy, business.
-
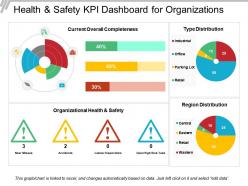 Health and safety kpi dashboard for organizations
Presenting this set of slides with name - Health And Safety Kpi Dashboard For Organizations. This is a four stage process. The stages in this process are Health And Safety, Health And Security, Health And Protection.
-
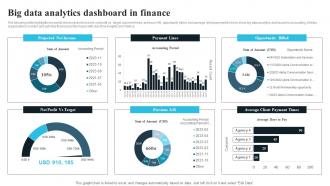 Big Data Analytics Dashboard In Finance
The following slide highlights key points like project net income, net profit vs. target, payment lines, previous AR, opportunity billed, and average client payment times to show big data analytics dashboard in accounting. It helps organizations monitor and optimize financial performance with real-time insights and metrics. Introducing our Big Data Analytics Dashboard In Finance set of slides. The topics discussed in these slides are Projected Net Income, Opportunity Billed. This is an immediately available PowerPoint presentation that can be conveniently customized. Download it and convince your audience.
-
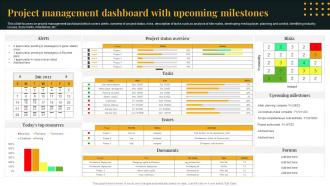 Project Management Dashboard With Upcoming Milestones
This slide focuses on project management dashboard which covers alerts, overview of project status, risks, description of tasks such as analysis of site matrix, developing media player, planning and control, identifying industry, issues, documents, milestones, etc. Presenting our well structured Project Management Dashboard With Upcoming Milestones. The topics discussed in this slide are Project Status Overview, Upcoming Milestones, Risks. This is an instantly available PowerPoint presentation that can be edited conveniently. Download it right away and captivate your audience.
-
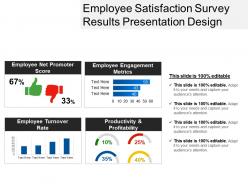 Employee satisfaction survey results presentation design
Presenting Employee Satisfaction Survey Results Presentation Design. The slide is completely customizable and can be downloaded in various formats like JPG, PNG, and JPEG. It goes well with the Google Slides and the major Microsoft versions. Also, you are free to change the colors, font type and the font size of the slide. The background of the template can also be altered. The template can be viewed on two screen sizes i.e. standard screen (4:3) and widescreen (16:9).
-
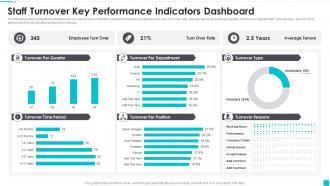 Staff Turnover Key Performance Indicators Dashboard Snapshot
The following slide highlights the staff turnover key performance Indicators dashboard snapshot illustrating employee turn over, turn over rate, average tenure, turnover per quarter, turnover per department, turnover type, turnover time period, turnover per position and turnover reasons. Introducing our Staff Turnover Key Performance Indicators Dashboard set of slides. The topics discussed in these slides are Turnover Per Quarter, Turnover Time Period, Turnover Per Position. This is an immediately available PowerPoint presentation that can be conveniently customized. Download it and convince your audience.
-
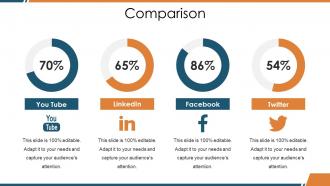 Comparison ppt introduction
Presenting this set of slides with name - Comparison Ppt Introduction. This is a four stage process. The stages in this process are You Tube, LinkedIn, Facebook, Twitter, Comparison.
-
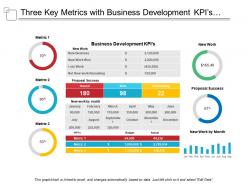 Three key metrics with business development kpis and proposal success
Presenting this set of slides with name - Three Key Metrics With Business Development Kpis And Proposal Success. This is a three stage process. The stages in this process are Key Metrics, Key Performance Indicator, Kpi.
-
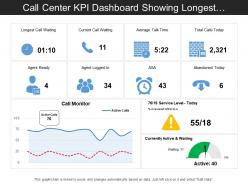 Call center kpi dashboard showing longest call waiting and average talk time
Presenting this set of slides with name - Call Center Kpi Dashboard Showing Longest Call Waiting And Average Talk Time. This is a three stage process. The stages in this process are Call Center Agent, Customer Care, Client Support.
-
 Business development statistics results slide powerpoint templates
Presenting business development statistics results slide powerpoint templates. This is a business development statistics results slide powerpoint templates. This is a five stage process. The stages in this process are results, output, deliverables, goals.
-
 Our offerings vs the competition ppt slides
Editable PPT Slide and compatible with numerous format options like JPEG, JPG or PDF. Available in Widescreen slide size also. Freedom to customize it with company name and logo. Widely used by business professionals, students, teachers, business analysts and strategists. Customization of each PowerPoint graphic and text according to your desire and want. Access to inclusion and exclusion of contents as per specific needs of any business. High resolution quality slides.The stages in this process are marketing, strategy, business, management.
-
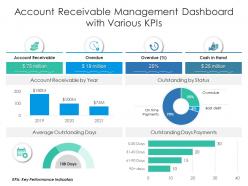 Account receivable management dashboard snapshot with various kpis
Introducing our Account Receivable Management Dashboard Snapshot With Various KPIs set of slides. The topics discussed in these slides are Account Receivable, Key Performance Indicators, Payments. This is an immediately available PowerPoint presentation that can be conveniently customized. Download it and convince your audience.
-
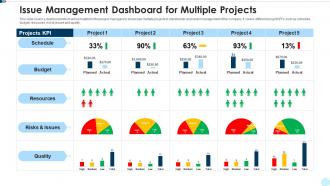 Issue management dashboard for multiple projects
Introducing our Issue Management Dashboard For Multiple Projects set of slides. The topics discussed in these slides are Issue Management Dashboard For Multiple Projects. This is an immediately available PowerPoint presentation that can be conveniently customized. Download it and convince your audience.
-
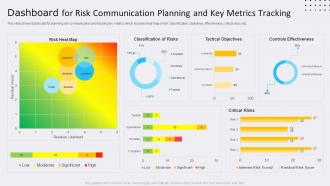 Dashboard Snapshot For Risk Communication Planning And Key Metrics Tracking
This slide shows dashboard snapshot for planning risk communication and tracking key metrics which includes heat map of risk, classification, objectives, effectiveness, critical risks, etc. Presenting our well-structured Dashboard For Risk Communication Planning And Key Metrics Tracking. The topics discussed in this slide are Classification Risks, Tactical Objectives, Controls Effectiveness. This is an instantly available PowerPoint presentation that can be edited conveniently. Download it right away and captivate your audience.
-
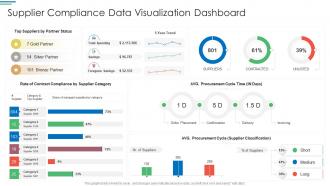 Supplier compliance data visualization dashboard snapshot
Presenting our well structured Supplier Compliance Data Visualization Dashboard Snapshot. The topics discussed in this slide are Supplier Compliance Data Visualization Dashboard Snapshot. This is an instantly available PowerPoint presentation that can be edited conveniently. Download it right away and captivate your audience.
-
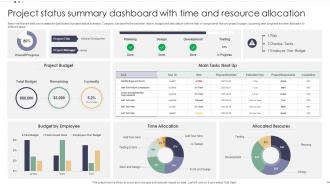 Project Status Summary Dashboard With Time And Resource Allocation
Below mentioned slide showcases the dashboard of project status summary. Company can identify the potential risks in budget and task status with the help of components that are project budget, upcoming task progress and time allocation to different tasks. Introducing our Project Status Summary Dashboard With Time And Resource Allocation set of slides. The topics discussed in these slides are Project Budget, Allocated Resoures, Time Allocation. This is an immediately available PowerPoint presentation that can be conveniently customized. Download it and convince your audience.
-
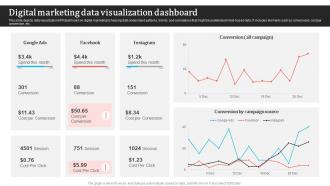 Digital Marketing Data Visualization Dashboard
This slide depicts data visualization KPI dashboard on digital marketing to help big data understand patterns, trends, and correlations that might be undetected in text-based data. It includes elements such as conversions, cost per conversion, etc. Introducing our Digital Marketing Data Visualization Dashboard set of slides. The topics discussed in these slides are Digital Marketing, Data Visualization Dashboard.This is an immediately available PowerPoint presentation that can be conveniently customized. Download it and convince your audience.
-
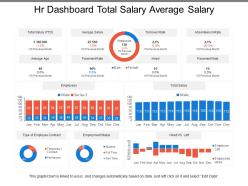 Hr dashboard total salary average salary
Presenting this set of slides with name - Hr Dashboard Total Salary Average Salary. This is a three stage process. The stages in this process are Hr Dashboard, Human Resource Dashboard, Hr Kpi.
-
 Date Scheduler Global Financial Matters Checklist Report Ppt Icons Graphics
Presenting date scheduler global financial matters checklist report ppt icons graphics. This Power Point icon template diagram has been crafted with graphic of date scheduler, globe and checklist icons. This icon PPT diagram contains the concept of global financial matters analysis and checklist formation .Use this icon PPT for business and finance related presentations.
-
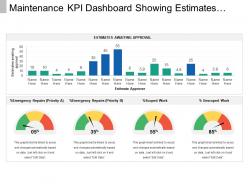 Maintenance kpi dashboard snapshot showing estimates awaiting approval
Presenting maintenance KPI dashboard snapshot showing estimates awaiting approval PPT slide. This layout is fully compatible with Google slides and data driven. User can edit the data in linked excel sheet and the design will change accordingly. Easy to put in company logo, trademark or name; accommodate words to support the key points. Images do no distort out even when they are projected on large screen. Adjust colors, text and fonts as per your business requirements.
-
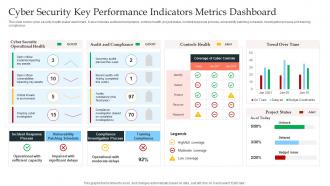 Cyber Security Key Performance Indicators Metrics Dashboard
This slide covers cyber security health status dashboard . It also includes audit and compliance, controls health, project status, incident response process, vulnerability patching schedule, investigation process and training compliance. Presenting our well-structured Cyber Security Key Performance Indicators Metrics Dashboard. The topics discussed in this slide are Cyber Security, Key Performance Indicators, Metrics Dashboard. This is an instantly available PowerPoint presentation that can be edited conveniently. Download it right away and captivate your audience.
-
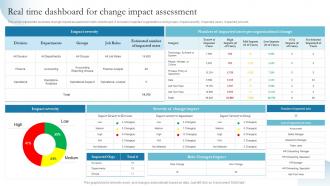 Real Time Dashboard For Change Impact Assessment
This slide represents business change impact assessment metric dashboard. It includes impacted organizations and groups, impact severity, impacted users, impacted jobs etc. Introducing our Real Time Dashboard For Change Impact Assessment set of slides. The topics discussed in these slides are Departments, Real Time Dashboard, Impact Assessment. This is an immediately available PowerPoint presentation that can be conveniently customized. Download it and convince your audience.


