Charts, Graphs PowerPoint Designs, Presentation Charts Designs & PPT Graphics
- Sub Categories
-
- Arrows and Targets
- Bullet and Text Slides
- Charts and Graphs
- Circular Cycle Diagrams
- Concepts and Shapes
- Custom Flat Designs
- Dashboards and Measuring
- Flow Process
- Funnels
- Gears
- Growth
- Harvey Balls
- Idea Innovation and Light Bulbs
- Leadership
- Linear Process Diagrams
- Magnifying Glass
- Misc Other Graphics
- Opportunity and Handshake
- Organization Charts
- Puzzles
- Pyramids
- Roadmaps and Timelines
- Silhouettes
- Steps
- Strategic Planning Analysis
- SWOT Analysis
- Tables and Matrix
- Teamwork
- Technology and Communication
- Venn Diagrams
- Visuals and Illustrations
-
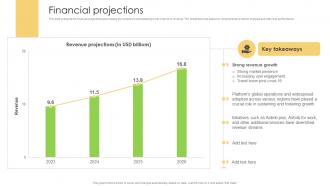 Financial Projections Bed And Breakfast Business Model BMC V
This slide presents the financial projections showcasing the companys anticipated growth in terms of revenue. The predictions are based on comprehensive market analysis and historical performance. Deliver an outstanding presentation on the topic using this Financial Projections Bed And Breakfast Business Model BMC V. Dispense information and present a thorough explanation of Financial Projections, Market Presence, Fostering Growth using the slides given. This template can be altered and personalized to fit your needs. It is also available for immediate download. So grab it now.
-
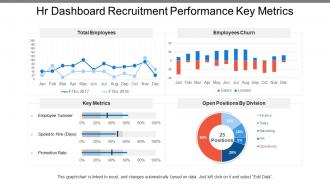 Hr dashboard snapshot recruitment performance key metrics
Presenting this set of slides with name - Hr Dashboard Snapshot Recruitment Performance Key Metrics. This is a four stage process. The stages in this process are Hr Dashboard, Human Resource Dashboard, Hr Kpi.
-
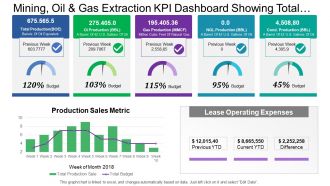 Mining oil and gas extraction kpi dashboard showing total production and budget
Presenting this set of slides with name - Mining Oil And Gas Extraction Kpi Dashboard Showing Total Production And Budget. This is a three stage process. The stages in this process are Mining, Oil And Gas Extraction, Refinery, Natural Gas.
-
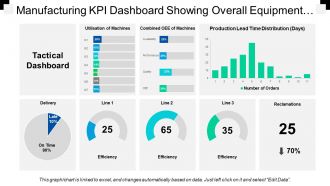 Manufacturing kpi dashboard showing overall equipment effectiveness
Presenting this set of slides with name - Manufacturing Kpi Dashboard Showing Overall Equipment Effectiveness. This is a eight stage process. The stages in this process are Manufacturing, Production, Manufacture.
-
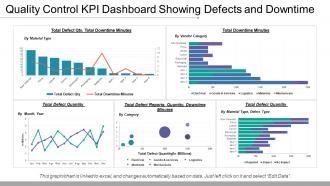 Quality control kpi dashboard showing defects and downtime
Presenting this set of slides with name - Quality Control Kpi Dashboard Showing Defects And Downtime. This is a five stage process. The stages in this process are Quality Management, Quality Control, Quality Assurance.
-
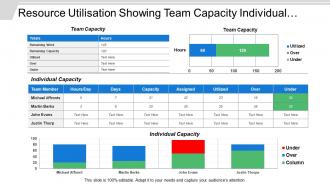 Resource utilisation showing team capacity individual capacity
Presenting this set of slides with name - Resource Utilisation Showing Team Capacity Individual Capacity. This is a four stage process. The stages in this process are Resource Management, Resource Utilization, Resource Allocation.
-
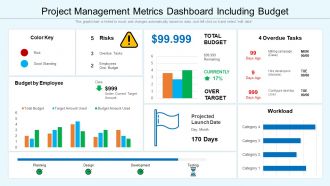 Project management metrics dashboard including budget
Presenting this set of slides with name Project Management Metrics Dashboard Including Budget. The topics discussed in these slides are Budget, Target, Campaign. This is a completely editable PowerPoint presentation and is available for immediate download. Download now and impress your audience.
-
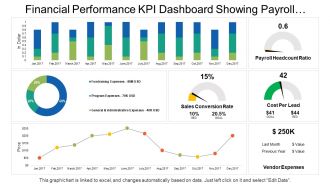 Financial performance kpi dashboard showing payroll headcount ratio cost per lead
Presenting this set of slides with name - Financial Performance Kpi Dashboard Showing Payroll Headcount Ratio Cost Per Lead. This is a seven stage process. The stages in this process are Financial Performance, Financial Report, Financial Review.
-
 Supply progress graph dashboard snapshot
Presenting this set of slides with name Supply Progress Graph Dashboard Snapshot. The topics discussed in these slides are Progress Dashboard, Chart And Graph, Finance, Marketing. This is a completely editable PowerPoint presentation and is available for immediate download. Download now and impress your audience.
-
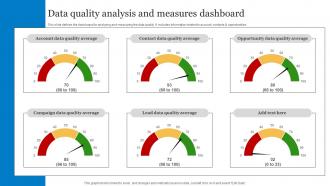 Data Quality Analysis And Measures Dashboard Snapshot
This slide defines the dashboard for analyzing and measuring the data quality. It includes information related to account, contacts and opportunities. Introducing our Data Quality Analysis And Measures Dashboard Snapshot set of slides. The topics discussed in these slides are Campaign Data, Quality Average, Opportunity Data. This is an immediately available PowerPoint presentation that can be conveniently customized. Download it and convince your audience.
-
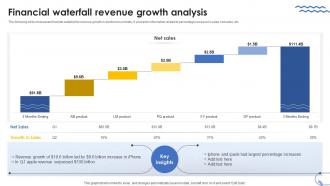 Financial Waterfall Revenue Growth Analysis
The following slide showcases financial waterfall for revenue growth in electronics industry. It presents information related to percentage increase in sales, net sales, etc. Introducing our Financial Waterfall Revenue Growth Analysis set of slides. The topics discussed in these slides are Financial Waterfall, Revenue, Growth Analysis. This is an immediately available PowerPoint presentation that can be conveniently customized. Download it and convince your audience.
-
 Four key metrics donut chart with percentage
This key performance indicator presentation slide can easily be downloaded from our web page. The design is 100% editable; you can modify and customize the design according to your business needs. All the design elements such as font, type, color, size, images, shape, style, background is completely editable. Design is fully supported on standard and full screen view; no compromise with design quality on full screen view.
-
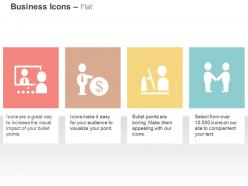 Video Calling Financial Management Business Deal Ppt Icons Graphics
Presenting video calling financial management business deal ppt icons graphics. This Power Point icon template diagram has been crafted with graphic of four business icons. This icon PPT diagram contains the concept of video calling and financial management .Use this icon PPT for business and finance related presentations.
-
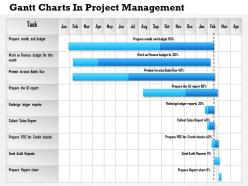 0514 Gantt Charts In Project Management Powerpoint Presentation
High definition PPT presentation diagrams. Organises the complex data in a well-arranged manner to enable easy understanding and memorising of the information. Packed with advanced presentation patterns and icons they will surely stun the viewers. Extremely versatile and dynamic PPT presentation templates. Changeable format which provides no compatibility issues. Downloads instantly to save your valuable time. Allows complete modification by any user at any time without any issues.
-
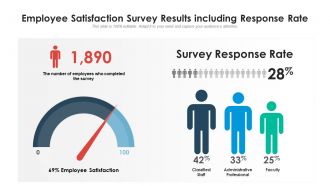 Employee satisfaction survey results including response rate
Presenting this set of slides with name Employee Satisfaction Survey Results Including Response Rate. The topics discussed in these slides are Classified Staff, Administrative Professional, Faculty. This is a completely editable PowerPoint presentation and is available for immediate download. Download now and impress your audience.
-
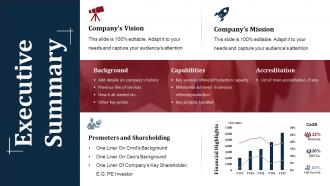 Executive summary powerpoint slide background image
Presenting executive summary powerpoint slide background image. • Tension free download possible. • Once downloaded, the presentation can be modified to any format like JPG, JPEG, PDF, etc • It’s also compatible with multiple software and Google slides. • The provided executive summary PPT presentation template can easily be used solely or as part your pre built presentation. • Be happy to customize and personalize the presentation with company specifications. • There is no hassle when any fact, figures or text is to be included or excluded in the presentation. • Picture quality compatible with wide screen exposure. • Much appreciated and used by business executives, professionals, students and teachers.
-
 Report Check Checklist Growth Chart Analysis Ppt Icons Graphics
Presenting report check checklist growth chart analysis ppt icons graphics. This Power Point icon template diagram has been crafted with graphic of report check, checklist and growth icons. This icon PPT diagram contains the concept of report analysis and data checklist representation. Use this icon PPT for business and finance related presentations.
-
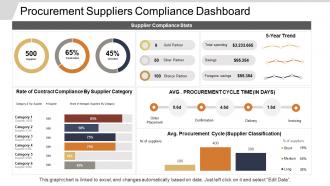 Procurement suppliers compliance dashboard
Presenting this set of slides with name - Procurement Suppliers Compliance Dashboard. This is a four stage process. The stages in this process are Purchase, Procurement, Buy.
-
 Workforce at a glance powerpoint slide graphics
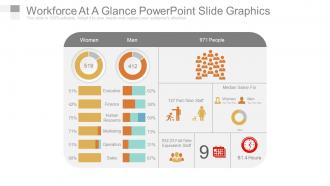
Presenting this workforce analysis and planning PowerPoint presentation slide. The PPT slide is available in both widescreen size (16:9) and standard screen size (4:3). This template has been designed by our team of qualified designers and is editable in PowerPoint. You can change the font type, font size, font style, icons and background color of the slide as per your requirement. It is convenient to insert your company name and logo in the slide. You can remove the sample content in text placeholders and add your presentation’s content. The slide is fully compatible with Google slides and can be saved in JPG or PDF format easily. High resolution graphic image ensures that there is no deterioration in quality on enlarging the size of the image. You can download the slide quickly at the click of a button.
-
 Revenue Split By Geography Vacation Rental Solution Company Profile CP SS V
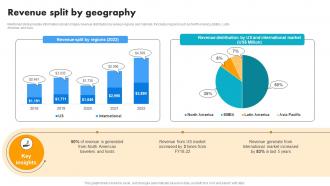
Mentioned slide provides information about company revenue distribution by various regions and markets. It includes regions such as North America, EMEA, Latin America, and Asia. Deliver an outstanding presentation on the topic using this Revenue Split By Geography Vacation Rental Solution Company Profile CP SS V Dispense information and present a thorough explanation of North American Travelers And Hosts, Revenue From US Market using the slides given. This template can be altered and personalized to fit your needs. It is also available for immediate download. So grab it now.
-
 Kpi dashboard for hr recruitment process
Presenting this set of slides with name KPI Dashboard For HR Recruitment Process. The topics discussed in these slides are Total Applicants, Shortlisted Candidates, Hired Candidates, Rejected Candidates, Time To Hire, Cost To Hire. This is a completely editable PowerPoint presentation and is available for immediate download. Download now and impress your audience.
-
 Dashboards by function it project management dashboard
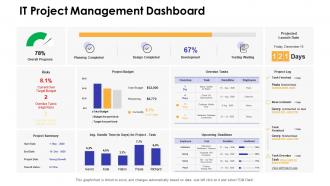
Present the topic in a bit more detail with this Dashboards By Function It Project Management Dashboard. Use it as a tool for discussion and navigation on It Project Management Dashboard. This template is free to edit as deemed fit for your organization. Therefore download it now.
-
 Call center kpi dashboard showing total calls average answer speed abandon rate
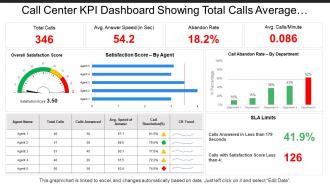
Presenting this set of slides with name - Call Center Kpi Dashboard Showing Total Calls Average Answer Speed Abandon Rate. This is a five stage process. The stages in this process are Call Center Agent, Customer Care, Client Support.
-
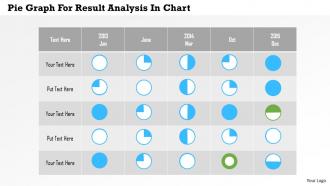 Pie graph for result analysis in chart flat powerpoint design
We are proud to present our pie graph for result analysis in chart flat powerpoint design. Graphic of pie graph has been used to craft this power point template diagram. This PPT diagram contains the concept of result analysis. This diagram can be used for business and marketing presentations.
-
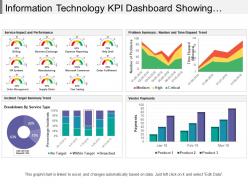 Information technology kpi dashboard showing incident target summary trend
Presenting this set of slides with name - Information Technology Kpi Dashboard Showing Incident Target Summary Trend. This is a five stage process. The stages in this process are Information Technology, It, Iot.
-
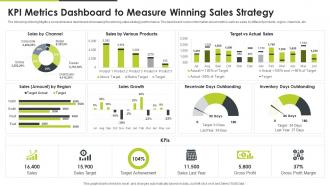 KPI Metrics Dashboard To Measure Winning Sales Strategy
The following slide highlights a comprehensive dashboard showcasing the winning sales strategy performance. The dashboard covers information about metrics such as sales by different products, region, channels, etc. Introducing our KPI Metrics Dashboard To Measure Winning Sales Strategy set of slides. The topics discussed in these slides are Sales Growth, Target Vs Actual Sales, Target Achievement. This is an immediately available PowerPoint presentation that can be conveniently customized. Download it and convince your audience.
-
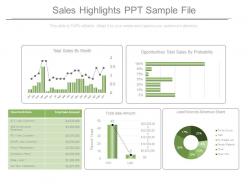 Sales highlights ppt sample file
Presenting sales highlights ppt sample file. This is a sales highlights ppt sample file. This is a five stage process. The stages in this process are total sales by month, opportunities total sales by probability, opportunity name amount, total sale amount, lead sources revenue share.
-
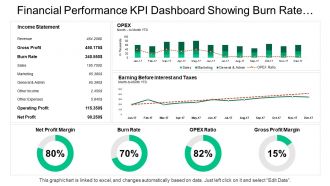 Financial performance kpi dashboard showing burn rate opex ratio gross profit
Presenting this set of slides with name - Financial Performance Kpi Dashboard Showing Burn Rate Opex Ratio Gross Profit. This is a four stage process. The stages in this process are Financial Performance, Financial Report, Financial Review.
-
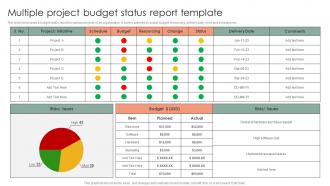 Multiple Project Budget Status Report Template
The Slide Showcases A Budget Status Report For Various Projects Of An Organization. It Covers Planned Vs Actual Budget, Resourcing, Delivery Date, Risks And Schedule Etc. Presenting Our Well Structured Multiple Project Budget Status Report Template. The Topics Discussed In This Slide Are Organization, Resourcing, Schedule. This Is An Instantly Available Powerpoint Presentation That Can Be Edited Conveniently. Download It Right Away And Captivate Your Audience.
-
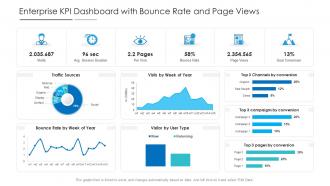 Enterprise kpi dashboard with bounce rate and page views powerpoint template
This Enterprise KPI Dashboard With Bounce Rate And Page Views Powerpoint Template is designed using a data-driven approach to help you display important stats, figures, insights, and metrics related to the topic of your choice. You can also deploy this slide to present reports on a specific business project and strategy. It is tailor-made using a mix of KPIs that make the information easily understandable. Project managers, executives, or other department heads can grab this readily available PowerPoint presentation slide to present relevant information. It can be further used for monitoring and identifying various trends doing rounds in the industry of your choice. The biggest feature of this PowerPoint layout is that it is designed using vector-based and high-quality graphics that can be reproduced as PNGs, JPGs, and PDFs. It also works well with Google Slides and PowerPoint. Therefore, giving a lot of options to work with.
-
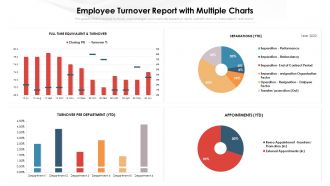 Employee turnover report with multiple charts
Presenting this set of slides with name Employee Turnover Report With Multiple Charts. The topics discussed in these slides are Organisation, Transfer, Performance. This is a completely editable PowerPoint presentation and is available for immediate download. Download now and impress your audience.
-
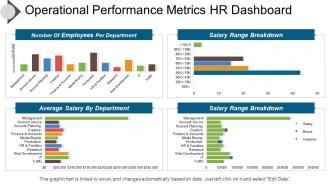 Operational performance metrics hr dashboard snapshot presentation images
Introducing operational performance metric HR PPT image. Fully regulated PowerPoint template quite reasonable for the HR and management professionals and business specialists. Extensive scope for reviving the dummy data and can add company logo, trademark etc. Reconvert able background PPT image, subject matter, designs, context etc. according to need. Versant with all Google Slides and other system applications. Can be easily projected over wide screen with exceptional picture quality.
-
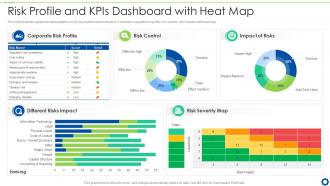 Risk Profile And KPIs Dashboard Snapshot With Heat Map
This slide illustrates graphical representation of risk key performance indicators. It includes corporate risk profile, risk control, risk impacts with heat map. Introducing our Risk Profile And KPIs Dashboard Snapshot With Heat Map set of slides. The topics discussed in these slides are Corporate Risk Profile, Risk Control, Impact of Risks, Different Risks Impact. This is an immediately available PowerPoint presentation that can be conveniently customized. Download it and convince your audience.
-
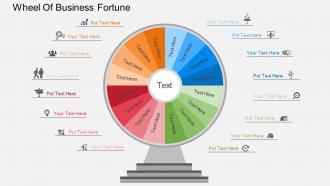 Cw wheel of business fortune flat powerpoint design
Beautifully crafted Presentation illustration. Hundred percent editable slide graphics. Opportunity to modify the content as per the industry need. Simplicity of personalization with your organization name and logo. Perfect with wide assortment of organization alternatives. PPT diagram can be downloaded easily and transform into JPG and PDF format. Choice to access similar designs comes with different nodes and stages.
-
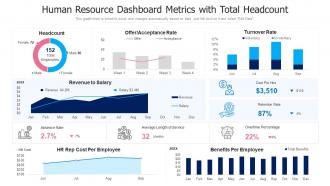 Human resource dashboard metrics with total headcount
Presenting our well-structured Human Resource Dashboard Metrics With Total Headcount. The topics discussed in this slide are Human Resource Dashboard Metrics With Total Headcount. This is an instantly available PowerPoint presentation that can be edited conveniently. Download it right away and captivate your audience.
-
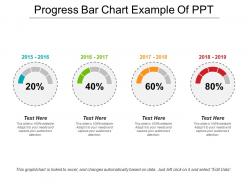 Progress bar chart example of ppt
SlideTeam presents to you Progress Bar Chart Example Of PPT. This PowerPoint presentation can be saved in either PDF or JPG format easily. You can also view the slideshow in standard size display ratio of 4:3 or widescreen display ratio of 16:9. You can make any changes to the pre-designed PPT template, as it is highly customizable. You can also edit the font size, font color and the font style of the text used in the presentation. The slides are also compatible with Google slides.
-
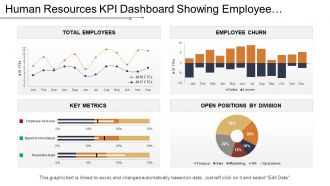 Kpi dashboard showing employee churn key metrics and open positions
Presenting this set of slides with name - Kpi Dashboard Showing Employee Churn Key Metrics And Open Positions. This is a four stage process. The stages in this process are Human Resource, Hrm, Human Capital.
-
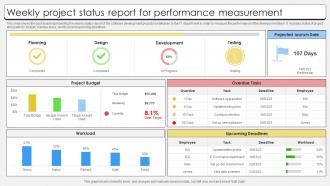 Weekly Project Status Report For Performance Measurement
This slide shows the dashboard representing the weekly status report of the software development projects undertaken by the IT department in order to measure the performance of the development team. It includes status of project along with its budget, overdue tasks, workload and upcoming deadlines. Introducing our Weekly Project Status Report For Performance Measurement set of slides. The topics discussed in these slides are Weekly Project, Status Report, For Performance, Measurement. This is an immediately available PowerPoint presentation that can be conveniently customized. Download it and convince your audience.
-
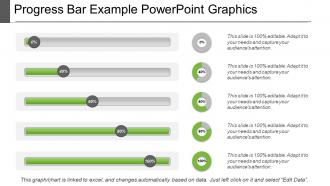 Progress bar example powerpoint graphics
We brings to you the progress bar example PowerPoint graphics. You can download this PPT completely free of cost. You just have to edit the data in a pre-designed format and present it. You can insert pictures and new slides to this ready-made deck of slides. All these slides are fully compatible with Google Slides. This presentation can be downloaded in JPG and PDF formats. It can be viewed in the 16:9 ratio widescreen size and the ratio of 4:3 standard screen size.
-
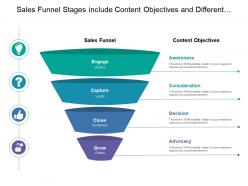 Sales funnel stages include content objectives and different process steps
Presenting this set of slides with name - Sales Funnel Stages Include Content Objectives And Different Process Steps. This is a four stage process. The stages in this process are Sales Funnel Stages, Sales Funnel Phases, Sales Funnel Steps.
-
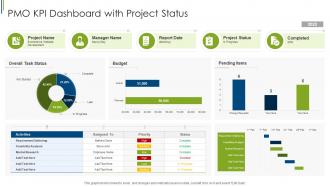 PMO KPI Dashboard Snapshot With Project Status
Introducing our PMO KPI Dashboard Snapshot With Project Status set of slides. The topics discussed in these slides are Budget, Analysis, Market Research. This is an immediately available PowerPoint presentation that can be conveniently customized. Download it and convince your audience.
-
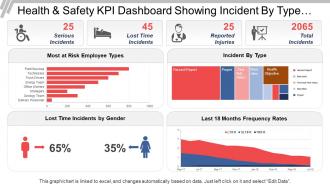 Health and safety kpi dashboard showing incident by type and frequency rates
Presenting the dashboard presentation slide. This KPI dashboard is fully editable and is designed by professionals looking for professional presentation design. You can edit the objects in the slide like font size and font color easily. This presentation slide is fully compatible with Google Slide and can be saved in JPG or PDF file format without any hassle. Click on the download button below.
-
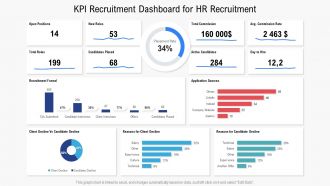 Kpi recruitment dashboard for hr recruitment
Presenting this set of slides with name KPI Recruitment Dashboard For HR Recruitment. The topics discussed in these slides are Recruitment Funnel, Positions, Commission. This is a completely editable PowerPoint presentation and is available for immediate download. Download now and impress your audience.
-
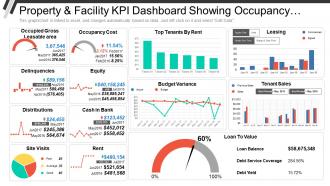 Property and facility kpi dashboard showing occupancy cost delinquencies and distributions
Presenting Property And Facility KPI Dashboard Showing Occupancy Cost Delinquencies And Distributions PPT slide. The Property And Facility KPI Dashboard PPT slide designed professionally by the team of SlideTeam to present the different parameters. These parameters have illustrated by different charts such as bar, line and pie chart, along with that the text in the KPI metric dashboard slide is customizable in PowerPoint. The logistics KPI dashboard template is compatible with Google Slide. A user can do alteration in the font size, font type, color and dimensions of the different figures as per the requirement.
-
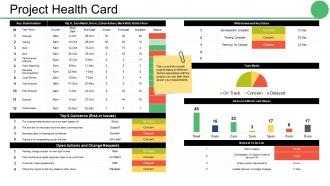 Project health card ppt gallery rules
Presenting health card PPT gallery rules. This layout is fully compatible with Google slides and data driven. User can edit the data in linked excel sheet and graphs and charts gets customized accordingly. Easy to put in company logo, trademark or name; accommodate words to support the key points. Images do no distort out even when they are projected on large screen. Adjust colors, text and fonts as per your business requirements
-
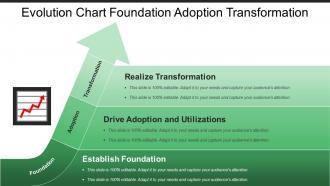 Evolution chart foundation adoption transformation
Presenting evolution chart foundation adoption transformation PowerPoint template. Download is quick and can be converting into JPEG and PDF document. Pre-designed template for helping other business companies. Suitable for business corporates and managers. Use of high pixel quality graphics in the slide. Complete access to change the size and orientation of the image. Easy insertion of the brand logo or company name in the slide background. Attuned well with the Google slides and other Microsoft office programs.
-
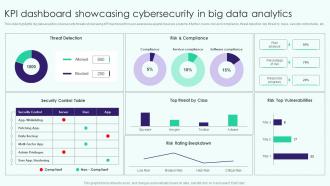 Kpi Dashboard Showcasing Cybersecurity In Big Data Analytics
This slide highlights big data analytics cybersecurity threats showcasing KPI dashboard for user awareness against insecure systems. It further covers risk and compliance, threat detection, top threat by class, security control table, etc. Presenting our well structured Kpi Dashboard Showcasing Cybersecurity In Big Data Analytics. The topics discussed in this slide are KPI Dashboard, Showcasing Cybersecurity, Big Data Analytics, Security Control Table. This is an instantly available PowerPoint presentation that can be edited conveniently. Download it right away and captivate your audience.
-
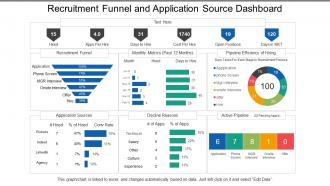 Recruitment funnel and application source dashboard
Presenting this set of slides with name - Recruitment Funnel And Application Source Dashboard. This is a three stage process. The stages in this process are Staffing Plan, Recruitment, Staff Management.
-
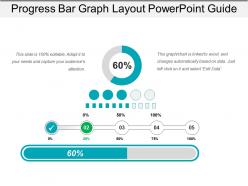 Progress bar graph layout powerpoint guide
Presenting a PPT slide named Progress Bar Graph Layout PowerPoint Guide. You can completely edit this slide as per your requirement. The font color, font size, font style, background color and the color of the diagram are all editable and can be changed. The dummy text in the slide can be rewritten. It’s a data-driven or Excel-linked template and hence can be customized accordingly. A collection of editable and high-quality icons ensures a better design for your presentation. The slide is compatible with Google Slides and can be saved in JPG, JPEG or PDF formats.
-
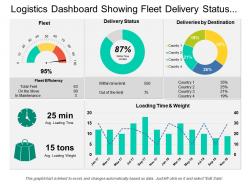 Logistics dashboard showing fleet delivery status and delivery by destination
Presenting this set of slides with name - Logistics Dashboard Showing Fleet Delivery Status And Delivery By Destination. This is a three stage process. The stages in this process are Logistics Dashboard, Logistics Kpis, Logistics Performance.
-
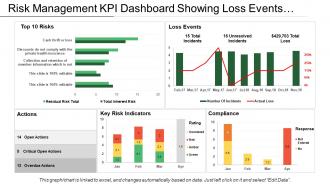 Risk management kpi dashboard showing loss events actions and compliance
Presenting this set of slides with name - Risk Management Kpi Dashboard Showing Loss Events Actions And Compliance. This is a four stage process. The stages in this process are Risk Management, Risk Assessment, Project Risk.
-
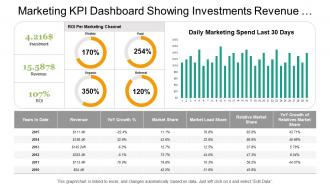 Marketing kpi dashboard showing investments revenue metrics details
Presenting marketing kpi dashboard showing investments revenue metrics details presentation template slide. The PPT template is very user friendly as it allows you to make numerous changes to the editable slides. You can amend the font size, font style and also the font color as per your requirements. Template slide can be downloaded quickly and cab be saved in format of PDF or JPG easily. The template slide after being downloaded can be viewed in large screen display ratio of 16:9 or standard size display ratio of 4:3.
-
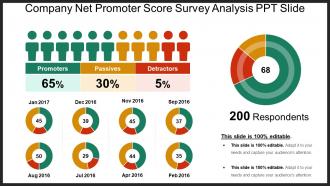 Company net promoter score survey analysis ppt slide
Presenting company net promoter score survey analysis PPT slide Powerpoint presentation which is 100% editable. This PPT template is excel linked i.e. data driven and can easily be customized which enables you to personalize it as per your own criteria. The presentation slide is fully compatible with Google slides, multiple format and software options. In case of any assistance, kindly take instructions from our presentation design services and it is easy to download in a very short span of time. The images, layouts, designs are of high quality and ensures quality in widescreen.
-
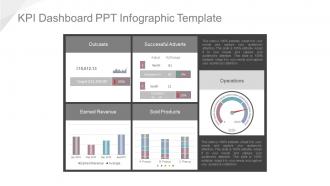 Kpi dashboard ppt infographic template
Presenting kpi dashboard ppt infographic template. This is a Kpi Dashboard Ppt Infographic Template. This is a four stage. The Stages in this process are outcasts, successful adverts, earned revenue, sold products, operations.
-
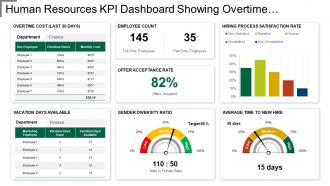 Kpi dashboard showing overtime cost gender diversity ratio
Presenting this set of slides with name - Kpi Dashboard Showing Overtime Cost Gender Diversity Ratio. This is a six stage process. The stages in this process are Human Resource, Hrm, Human Capital.
-
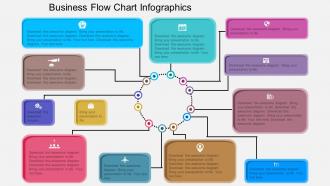 Business flow chart infographics flat powerpoint desgin
Images quality don't pixelate when anticipated on wide screen. PPT designs go perfect with Google slides. Straightforward and quick to incorporate titles and sub titles. Changeable slides graphics, colors, font size and style, and concept as per necessities. Layouts can be effectively changed over into PDF or JPG positions. Unique affirmation PowerPoint slides outlines. Ideal for business affiliation gathering, specialists, authorities, marketing experts, IT affiliations, lenders, merchants, brokers, promoters, business people, and pioneers.
-
 Communication Network Time Management News Announcement Ppt Icons Graphics
Presenting communication network time management news announcement ppt icons graphics. This Power Point icon template diagram has been crafted with graphic of communication, network and news icons. This icon PPT diagram contains the concept of news announcement and time management .Use this icon PPT for business and finance related presentations.
-
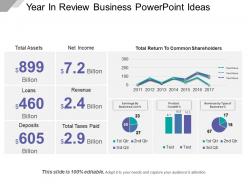 Year in review business powerpoint ideas
Presenting Year In Review Business PowerPoint Ideas. Get this Excel linked PPT slide and deliver quality presentations to your audience. You are free to make changes in any part of the slide. Modify the colors as per your choice, change the font type and font size and save this in JPG and PDF formats. This is entirely compatible with Google Slides and can be viewed on the standard screen and widescreen.
-
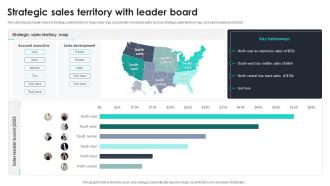 Strategic Sales Territory With Leader Board
This slide depicts leader board of strategic sales territory to keep sales reps accountable. It includes parts such as strategic sales territory map, and sales leader board 2023. Introducing our Strategic Sales Territory With Leader Board set of slides. The topics discussed in these slides are Strategic Sales Territory Map, Account Executive, Sales Development. This is an immediately available PowerPoint presentation that can be conveniently customized. Download it and convince your audience.
-
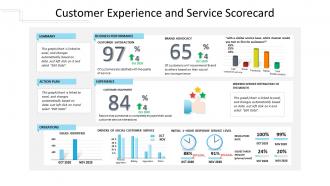 Customer experience and service scorecard
Presenting this set of slides with name Customer Experience And Service Scorecard. The topics discussed in these slides are Business Performance, Experience, Operations, Action Plan, Summary. This is a completely editable PowerPoint presentation and is available for immediate download. Download now and impress your audience.


