Charts, Graphs PowerPoint Designs, Presentation Charts Designs & PPT Graphics
- Sub Categories
-
- Arrows and Targets
- Bullet and Text Slides
- Charts and Graphs
- Circular Cycle Diagrams
- Concepts and Shapes
- Custom Flat Designs
- Dashboards and Measuring
- Flow Process
- Funnels
- Gears
- Growth
- Harvey Balls
- Idea Innovation and Light Bulbs
- Leadership
- Linear Process Diagrams
- Magnifying Glass
- Misc Other Graphics
- Opportunity and Handshake
- Organization Charts
- Puzzles
- Pyramids
- Roadmaps and Timelines
- Silhouettes
- Steps
- Strategic Planning Analysis
- SWOT Analysis
- Tables and Matrix
- Teamwork
- Technology and Communication
- Venn Diagrams
- Visuals and Illustrations
-
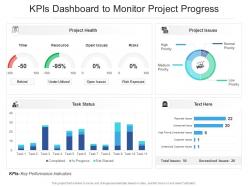 Kpis dashboard snapshot to monitor project progress
Introducing our KPIs Dashboard Snapshot To Monitor Project Progress set of slides. The topics discussed in these slides are KPIs Dashboard To Monitor Project Progress. This is an immediately available PowerPoint presentation that can be conveniently customized. Download it and convince your audience.
-
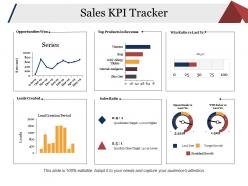 Sales kpi tracker presentation examples
Presenting this set of slides with name - Sales Kpi Tracker Presentation Examples. This is a six stage process. The stages in this process are Opportunities Won, Top Products In Revenue, Win Ratio Vs Last, Leads Created, Sales Ratio.
-
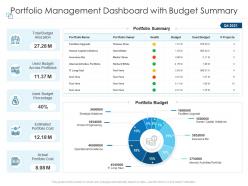 Portfolio management dashboard with budget summary
Introducing our Portfolio Management Dashboard With Budget Summary set of slides. The topics discussed in these slides are Budget Allocation, Portfolio, Portfolio Cost. This is an immediately available PowerPoint presentation that can be conveniently customized. Download it and convince your audience.
-
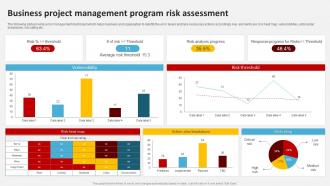 Business Project Management Program Risk Assessment
The following slide provide a risk management dashboard which helps business and organisation to identify the error levels and take necessary actions accordingly. Key elements are risk heat map, vulnerabilities, action plan breakdown, risk rating etc.Presenting our well structured Business Project Management Program Risk Assessment. The topics discussed in this slide are Response Progress, Average Risk Threshold, Management Program. This is an instantly available PowerPoint presentation that can be edited conveniently. Download it right away and captivate your audience.
-
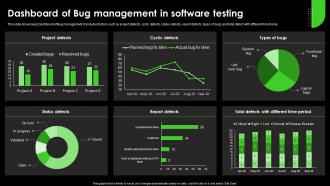 Dashboard Of Bug Management In Software Testing
This slide showcases Dashboard of Bug management. It includes factors such as project defects, cyclic defects, status defects, report defects, types of bugs and total defect with different time frame. Presenting our well structured Dashboard Of Bug Management In Software Testing The topics discussed in this slide are Project Defects, Cyclic Defects, Report Defects This is an instantly available PowerPoint presentation that can be edited conveniently. Download it right away and captivate your audience.
-
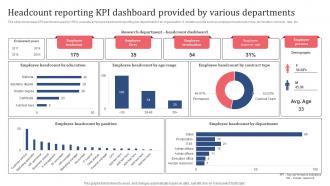 Headcount Reporting KPI Dashboard Provided By Various Departments
The slide showcases KPI dashboard used by HR to evaluate employee headcount reporting per department in an organization. It contains points such as employee headcount, hires, termination, turnover, rate, etc. Introducing our Headcount Reporting KPI Dashboard Provided By Various Departments set of slides. The topics discussed in these slides are Employee Headcount, Employee Termination, Employee Persona. This is an immediately available PowerPoint presentation that can be conveniently customized. Download it and convince your audience.
-
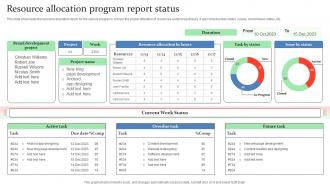 Resource Allocation Program Report Status
This slide showcases the resource allocation report for the various programs to track the proper utilization of resources under project tasks. It also inlcudes task status, issues, current week status, etc. Introducing our Resource Allocation Program Report Status set of slides. The topics discussed in these slides are Brand Development Project, Current Week Status. This is an immediately available PowerPoint presentation that can be conveniently customized. Download it and convince your audience.
-
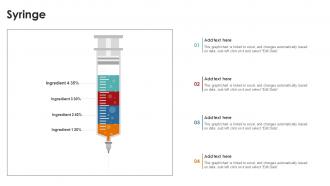 Syringe PU Chart SS
Introducing our Syringe PU Chart SS set of slides. The topics discussed in these slides are Syringe. This is an immediately available PowerPoint presentation that can be conveniently customized. Download it and convince your audience.
-
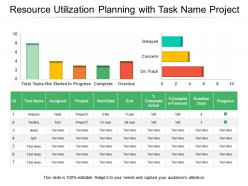 Resource utilization planning with task name project
Presenting this set of slides with name - Resource Utilization Planning With Task Name Project. This is a three stage process. The stages in this process are Resource Management, Resource Utilization, Resource Allocation.
-
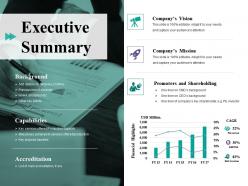 Executive summary ppt file elements
Presenting this set of slides with name - Executive Summary Ppt File Elements. This is a five stage process. The stages in this process are Company Vision, Promoters And Shareholding, Background, Capabilities, Accreditation.
-
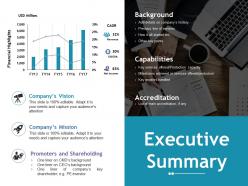 Executive summary ppt file example topics
Presenting this set of slides with name - Executive Summary Ppt File Example Topics. This is a five stage process. The stages in this process are Company Vision, Promoters And Shareholding, Background, Capabilities, Accreditation.
-
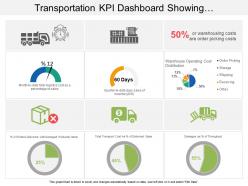 Transportation kpi dashboard snapshot showing warehouse operating cost distribution
Presenting transportation KPI dashboard snapshot showing warehouse operating cost distribution PPT slide. Simple data input like company logo, name or trademark. User can edit the data in linked excel sheet and graphs and charts gets customized accordingly. Picture quality of these slides does not change even when project on large screen. Fast downloading speed and formats can be easily changed to JPEG and PDF applications. This template is suitable for marketing, sales persons, business managers and entrepreneurs.
-
 Big Data Analytics Dashboard In Accounting
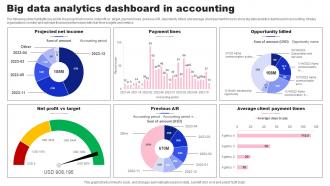
The following slide highlights key points like project net income, net profit vs. target, payment lines, previous A R, opportunity billed, and average client payment times to show big data analytics dashboard in accounting. It helps organizations monitor and optimize financial performance with real-time insights and metrics. Presenting our well structured Big Data Analytics Dashboard In Accounting. The topics discussed in this slide are Payment Lines, Profit Vs Target. This is an instantly available PowerPoint presentation that can be edited conveniently. Download it right away and captivate your audience.
-
 Product Portfolio Monitoring Dashboard Developing Managing Product Portfolio
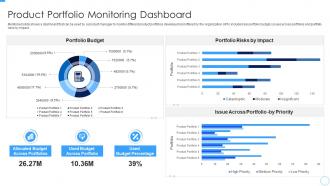
Mentioned slide shows a dashboard that can be used by a product manager to monitor different product portfolios developed and offered by the organization. KPIs included are portfolio budget, issues across portfolios and portfolio risks by impact. Present the topic in a bit more detail with this Product Portfolio Monitoring Dashboard Developing Managing Product Portfolio. Use it as a tool for discussion and navigation on Product Portfolio Monitoring Dashboard. This template is free to edit as deemed fit for your organization. Therefore download it now.
-
 Project Key Performance Indicators Status Card
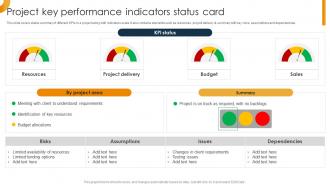
This slide covers status summary of different KPIs in a project along with indicators scale. It also contains elements such as resources, project delivery and summary with key risks, assumptions and dependencies. Presenting our well structured Project Key Performance Indicators Status Card. The topics discussed in this slide are Resources, Project Delivery, Budget, Sales. This is an instantly available PowerPoint presentation that can be edited conveniently. Download it right away and captivate your audience.
-
 High medium low priority risk shown as metric indicators
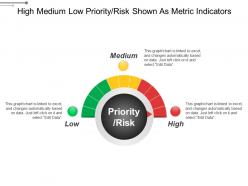
Presenting this set of slides with name - High Medium Low Priority Risk Shown As Metric Indicators. This is a three stage process. The stages in this process are High Medium Low, High Moderate Low, Top Medium Low.
-
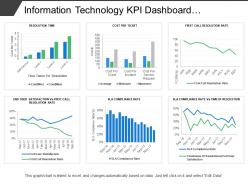 Information technology kpi dashboard showing cost per ticket sla compliance rate
Presenting this set of slides with name - Information Technology Kpi Dashboard Showing Cost Per Ticket Sla Compliance Rate. This is a six stage process. The stages in this process are Information Technology, It, Iot.
-
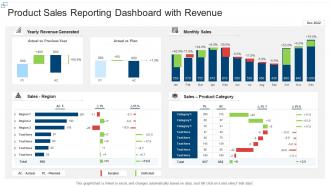 Product sales reporting dashboard snapshot with revenue
Presenting our well structured Product Sales Reporting Dashboard Snapshot With Revenue. The topics discussed in this slide are Revenue, Plan, Sales. This is an instantly available PowerPoint presentation that can be edited conveniently. Download it right away and captivate your audience.
-
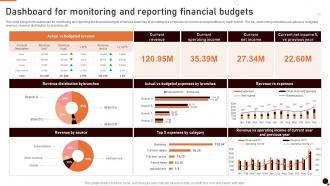 Dashboard For Monitoring And Reporting Financial Budgets
This slide brings forth dashboard for monitoring and reporting the financial budgets of various branches of an enterprise emphasis on income and expenditure by each branch. The key performing indicators are actual vs budgeted revenue, revenue distribution by branches etc. Introducing our Dashboard For Monitoring And Reporting Financial Budgets set of slides. The topics discussed in these slides are Current Revenue, Current Operating Income This is an immediately available PowerPoint presentation that can be conveniently customized. Download it and convince your audience.
-
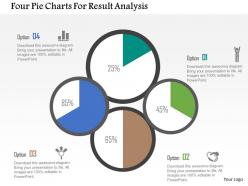 Four Pie Charts For Result Analysis Flat Powerpoint Design
High quality visuals with splendid resolution. 100 percent editable PPT slide templates. Aesthetically designed and professionally proficient. Include or exclude the slide content at your ease and requirement. Compatible with several software options. Harmonious with numerous format options life JPEG, JPG or PDF. Ease of personalization with your company specific name, logo and or trademark.
-
 Health Analytics Dashboard For Various Medical Services
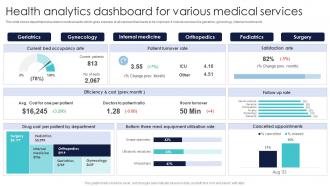
This slide shows department wise data in medical sector which gives overview of all services that needs to be improved. It include services like geriatrics, gynecology, internal medicine etc. Presenting our well structured Health Analytics Dashboard For Various Medical Services. The topics discussed in this slide are Geriatrics, Gynecology, Internal Medicine, Orthopedics. This is an instantly available PowerPoint presentation that can be edited conveniently. Download it right away and captivate your audience.
-
 Financial Projection Business Model Of American Express BMC SS
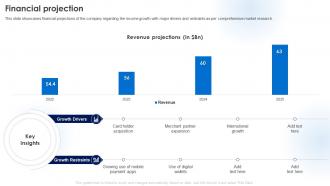
This slide showcases financial projections of the company regarding the income growth with major drivers and restraints as per comprehensive market research. Present the topic in a bit more detail with this Financial Projection Business Model Of American Express BMC SS. Use it as a tool for discussion and navigation on Financial Projection, Comprehensive Market Research, International Growth. This template is free to edit as deemed fit for your organization. Therefore download it now.
-
 Impact On Quarterly Sales Revenue Sales Enablement Strategy To Boost Productivity And Drive SA SS
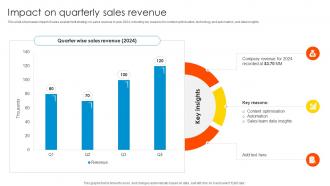
This slide showcases impact of sales enablement strategy on sales revenue in year 2024, including key reasons for content optimisation, technology and automation, and data insights. Present the topic in a bit more detail with this Impact On Quarterly Sales Revenue Sales Enablement Strategy To Boost Productivity And Drive SA SS. Use it as a tool for discussion and navigation on Sales Revenue, Company Revenue, Content Optimization. This template is free to edit as deemed fit for your organization. Therefore download it now.
-
 Tools To Understand Potential Sales Management Optimization Best Practices To Close SA SS
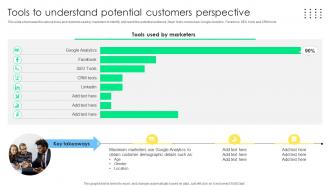
This slide showcases the various tools and channels used by marketers to identify and reach the potential audience. Major tools covered are Google Analytics, Facebook, SEO tools and CRM tools. Deliver an outstanding presentation on the topic using this Tools To Understand Potential Sales Management Optimization Best Practices To Close SA SS. Dispense information and present a thorough explanation of Understand Potential, Customers Perspective, Customer Demographic using the slides given. This template can be altered and personalized to fit your needs. It is also available for immediate download. So grab it now.
-
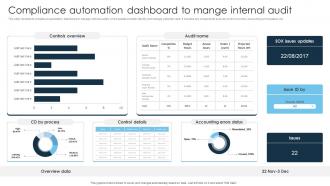 Compliance Automation Dashboard To Mange Internal Audit
This slide represents compliance automation dashboard to manage internal audits which assists to better identify and manage potential risks. It includes key components such as control overview, accounting errors status, etc. Introducing our Compliance Automation Dashboard To Mange Internal Audit set of slides. The topics discussed in these slides are Compliance Automation Dashboard, Mange Internal Audit, Accounting Errors Status. This is an immediately available PowerPoint presentation that can be conveniently customized. Download it and convince your audience.
-
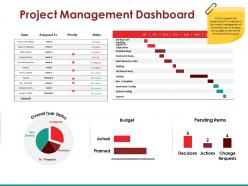 Project management dashboard powerpoint slide ideas
Presenting this set of slides with name - Project Management Dashboard Powerpoint Slide Ideas. This is a four stage process. The stages in this process are Overall Task Status, Budget, Pending Items, Decisions.
-
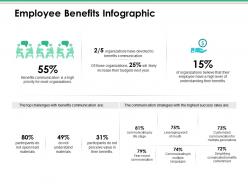 Employee benefits infographic ppt infographic template professional
Presenting this set of slides with name - Employee Benefits Infographic Ppt Infographic Template Professional. This is a two stage process. The stages in this process are Business, Management, Strategy, Analysis, Communication.
-
 Talent Sourcing And Recruitment Metrics Dashboard
This slide illustrates graphical representation and other statistics related to talent acquisition. It includes sourcing channels, turnover ratio age-wise, recruitment conduit etc. Presenting our well-structured Talent Sourcing And Recruitment Metrics Dashboard. The topics discussed in this slide are Recruitment, Metrics, Dashboard, Sourcing. This is an instantly available PowerPoint presentation that can be edited conveniently. Download it right away and captivate your audience.
-
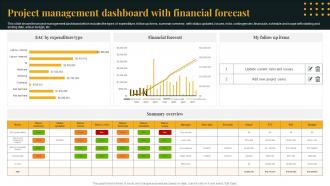 Project Management Dashboard With Financial Forecast
This slide shows the project management dashboard which includes the types of expenditure, follow up items, summary overview, with status updated, issues, risks, contingencies, financials, schedule and scope with starting and ending date, actual budget, etc. Presenting our well structured Project Management Dashboard With Financial Forecast. The topics discussed in this slide are Project Management, Dashboard With Financial Forecast. This is an instantly available PowerPoint presentation that can be edited conveniently. Download it right away and captivate your audience.
-
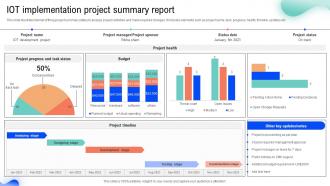 IoT Implementation Project Summary Report
This slide illustrate internet of thing project summary status to analyze project activities and make required changes. It includes elements such as project name, task, progress, health, timeline, updates etc. Introducing our IoT Implementation Project Summary Report set of slides. The topics discussed in these slides are IOT Implementation, Project Summary Report, Development Stage. This is an immediately available PowerPoint presentation that can be conveniently customized. Download it and convince your audience.
-
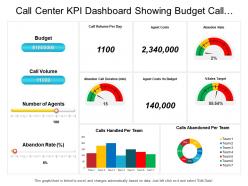 Call center kpi dashboard showing budget call volume agent costs percentage sales target
Presenting this set of slides with name - Call Center Kpi Dashboard Showing Budget Call Volume Agent Costs Percentage Sales Target. This is a four stage process. The stages in this process are Call Center Agent, Customer Care, Client Support.
-
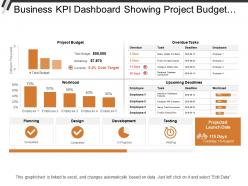 Business kpi dashboard showing project budget overdue tasks and workload
Presenting this set of slides with name - Business Kpi Dashboard Showing Project Budget Overdue Tasks And Workload. This is a two stage process. The stages in this process are Business Dashboard, Business Kpi, Business Performance.
-
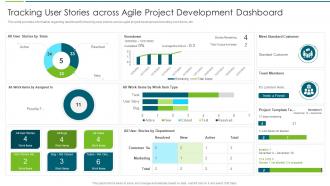 Agile Transformation Approach Playbook Stories Across Agile Project Development Dashboard
This slide provides information regarding dashboard for tracking user stories across agile project development including work items, etc. Present the topic in a bit more detail with this Agile Transformation Approach Playbook Stories Across Agile Project Development Dashboard. Use it as a tool for discussion and navigation on Agile Project, Development, Dashboard . This template is free to edit as deemed fit for your organization. Therefore download it now.
-
 Gantt Chart Showing Management Plan For IT Projects
This slide covers Gantt Chart which will be helpful for project leaders to track the task completion on time. It also includes task name such as project definition, design, coding, content build, user experience and presentation. Introducing our Gantt Chart Showing Management Plan For IT Projects that is designed to showcase some of the vital components that will help you create timelines, roadmaps, and project plans. In addition, also communicate your project durations, milestones, tasks, subtasks, dependencies, and other attributes using this well structured Gantt Chart Showing Management Plan For IT Projects template. You can also exhibit preeminence against time by deploying this easily adaptable slide to your business presentation. Our experts have designed this template in such a way that it is sure to impress your audience. Thus, download it and steer your project meetings, meetups, and conferences.
-
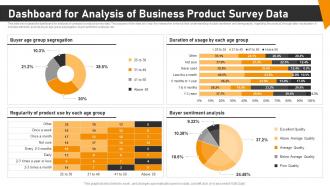 Dashboard For Analysis Of Business Product Survey Data
This slide showcases the dashboard for analysis of companys product survey data. The purpose of this slide is to help the researcher enhance their understanding of public sentiment and demography, regarding the product, through data visualization. It includes elements such as buyer age group segregation, buyer sentiment analysis, etc. Introducing our Dashboard For Analysis Of Business Product Survey Data set of slides. The topics discussed in these slides are Group Segregation, Regularity Product, Buyer Sentiment Analysis. This is an immediately available PowerPoint presentation that can be conveniently customized. Download it and convince your audience.
-
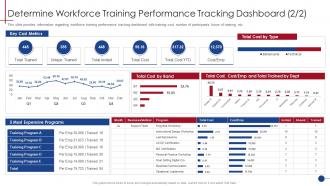 Determine Workforce Training Human Resource Training Playbook
This slide provides information regarding workforce training performance tracking dashboard with training cost, number of participants, hours of training, etc. Present the topic in a bit more detail with this Determine Workforce Training Human Resource Training Playbook. Use it as a tool for discussion and navigation on Determine Workforce Training Performance Tracking Dashboard. This template is free to edit as deemed fit for your organization. Therefore download it now.
-
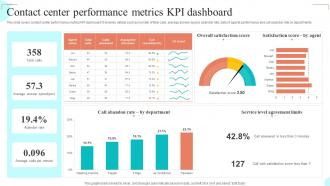 Contact Center Performance Metrics KPI Dashboard
This slide covers contact center performance metrics KPI dashboard. It involves details such as number of total calls, average answer speed, abandon rate, data of agents performance and call abandon rate by departments. Presenting our well structured Contact Center Performance Metrics KPI Dashboard The topics discussed in this slide are Call Abandon Rate, Overall Satisfaction Score, Satisfaction Score This is an instantly available PowerPoint presentation that can be edited conveniently. Download it right away and captivate your audience.
-
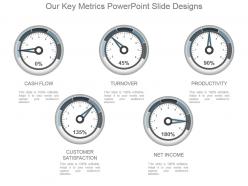 Our key metrics powerpoint slide designs
Presenting our key metrics PowerPoint slide designs. This power point slide offers you plenty of space to put in titles and sub titles. High resolution-based presentation layout does not change the image even after resizing. This presentation icon is fully compatible with Google slides. Quick downloading speed and simple editing options in color text and fonts.PPT icons can easily be changed into JPEG and PDF applications. This diagram has been designed for entrepreneurs, corporate and business managers.
-
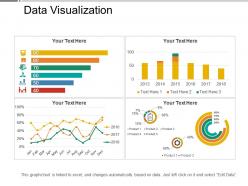 Data visualization
Presenting this Data Visualization PowerPoint slide. This PPT presentation is Google Slides compatible hence it is easily accessible. You can download and save this PowerPoint layout in different formats like PDF, PNG, and JPG. This PPT theme is available in both 4:3 and 16:9 aspect ratios. As this PowerPoint template is 100% editable, you can modify color, font size, font type, and shapes as per your requirements.
-
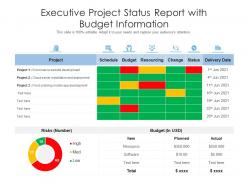 Executive project status report with budget information
Introducing our Executive Project Status Report With Budget Information set of slides. The topics discussed in these slides are Server, Development, Budget. This is an immediately available PowerPoint presentation that can be conveniently customized. Download it and convince your audience.
-
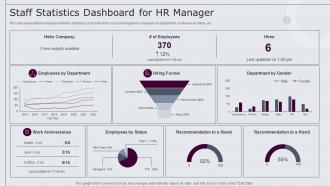 Staff Statistics Dashboard For Hr Manager
This slide represents the employee statistics dashboard. It includes KPIs such as hiring funnel, employees by department, employees by status, etc. Presenting our well structured Staff Statistics Dashboard For Hr Manager. The topics discussed in this slide are Statistics, Dashboard, Department. This is an instantly available PowerPoint presentation that can be edited conveniently. Download it right away and captivate your audience.
-
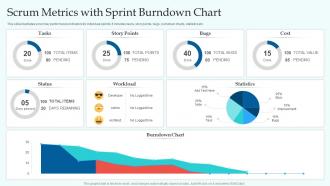 Scrum Metrics With Sprint Burndown Chart
This slide illustrates scrum key performance indicators for individual sprints. It includes tasks, story points, bugs, burndown charts, statistics etc. Presenting our well structured Scrum Metrics With Sprint Burndown Chart. The topics discussed in this slide are Story Points, Statistics, Workload, Burndown Chart. This is an instantly available PowerPoint presentation that can be edited conveniently. Download it right away and captivate your audience.
-
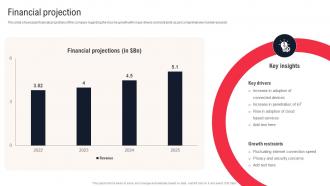 Financial Projection Business Model Of Twilio BMC SS
This slide showcases financial projections of the company regarding the income growth with major drivers and restraints as per comprehensive market research. Deliver an outstanding presentation on the topic using this Financial Projection Business Model Of Twilio BMC SS. Dispense information and present a thorough explanation of Financial Projections, 2022 To 2024, Increase Penetration using the slides given. This template can be altered and personalized to fit your needs. It is also available for immediate download. So grab it now.
-
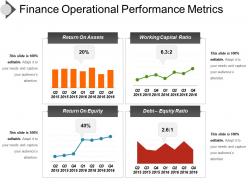 Finance operational performance metrics ppt daigram
Introducing finance operational performance metrics PPT diagram. Exquisitely coordinated PPT design template beneficial for various business professionals. Easily resizable shapes, patterns, and matters etc. Genuine and admissible PPT Image with pliant data options. Adequately compatible with all operating softwares and all Google Slides. Easily convertible to other file formats such as PDF or JPG. Adequate space available to add headings and subheadings. Unaffected high resolution PPT graphic when projected on huge screen.
-
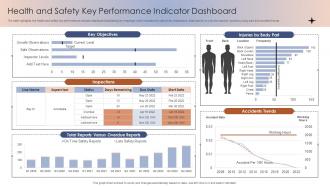 Health And Safety Key Performance Indicator Dashboard
The slide highlights the health and safety key performance indicator dashboard illustrating key headings which includes key objectives, inspections, total reports vs over due reports, injuries by body part and accident trends Introducing our Health And Safety Key Performance Indicator Dashboard set of slides. The topics discussed in these slides are Key Objectives, Inspections, Overdue Reports, Accidents Trends. This is an immediately available PowerPoint presentation that can be conveniently customized. Download it and convince your audience.
-
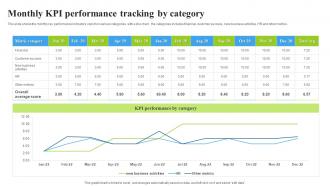 Monthly KPI Performance Tracking By Category
This slide shows the monthly key performance indicators report on various categories with a line chart. the categories includes financial, customer success, new business activities, HR and other metrics. Presenting our well structured Monthly KPI Performance Tracking By Category. The topics discussed in this slide are Performance Category, Tracking Category, Average Score. This is an instantly available PowerPoint presentation that can be edited conveniently. Download it right away and captivate your audience.
-
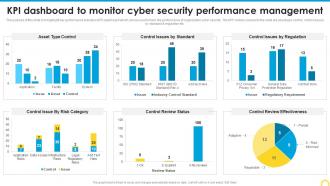 Kpi Dashboard To Monitor Cyber Building A Security Awareness Program
The purpose of this slide is to highlight key performance indicator KPI dashboard which can be used to track the performance of organization cyber security. The KPI metrics covered in the slide are asset type control, control issues by standard and regulation etc. Deliver an outstanding presentation on the topic using this KPI Dashboard To Monitor Cyber Building A Security Awareness Program. Dispense information and present a thorough explanation of Control Review Effectiveness, Performance Management using the slides given. This template can be altered and personalized to fit your needs. It is also available for immediate download. So grab it now.
-
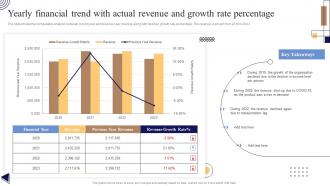 Yearly Financial Trend With Actual Revenue And Growth Rate Percentage
The slide shows the comparative analysis between current year and previous year revenue along with revenue growth rate percentage. The revenue is shown from 2019 to 2023. Introducing our Yearly Financial Trend With Actual Revenue And Growth Rate Percentage set of slides. The topics discussed in these slides are Yearly Financial Trend, Actual Revenue, Growth Rate Percentage. This is an immediately available PowerPoint presentation that can be conveniently customized. Download it and convince your audience.
-
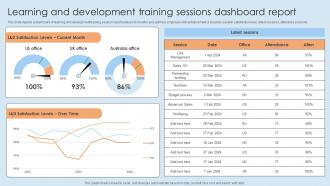 Learning And Development Training Sessions Dashboard Report
This slide covers learning and development reports highly used by companies such as course rating report, learner grades report, course progress report etc. to identify which report provides insightful feedback and data to users. Presenting our well structured Learning And Development Training Sessions Dashboard Report The topics discussed in this slide are Satisfaction Levels, Latest Sessions. This is an instantly available PowerPoint presentation that can be edited conveniently. Download it right away and captivate your audience.
-
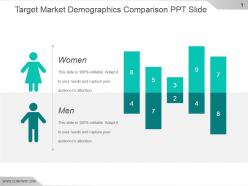 Target market demographics comparison ppt slide
Presenting target market demographics comparison ppt slide. This is a target market demographics comparison ppt slide. This is a two stage process. The stages in this process are women, men.
-
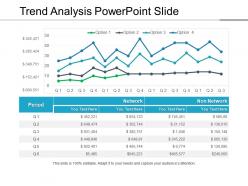 Trend analysis powerpoint slide
Presenting trend analysis PowerPoint template. Access to edit the content, style, size and orientation of the PPT slides. Extremely spacious to cover all the aspects of the company profile. High resolution images do not pixelate when projected on wide screen. Personalize the PPT with your company name and logo. Modify the presentation elements as per the need of an hour. Compatible with numerous software and format options. Used by entrepreneurs, marketers, managerial department, stakeholders and students. Self-explanatory and intellectual slide charts.
-
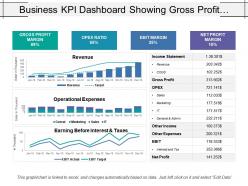 Business kpi dashboard showing gross profit margin opex ratio and ebit margin
Presenting this set of slides with name - Business Kpi Dashboard Showing Gross Profit Margin Opex Ratio And Ebit Margin. This is a three stage process. The stages in this process are Business Dashboard, Business Kpi, Business Performance.
-
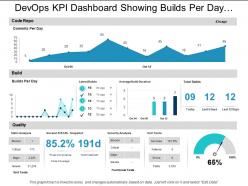 Devops kpi dashboard showing builds per day and code repo
Presenting this set of slides with name - Devops Kpi Dashboard Showing Builds Per Day And Code Repo. This is a three stage process. The stages in this process are Development And Operations, Devops.
-
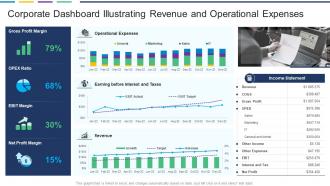 Corporate Dashboard Illustrating Revenue And Operational Expenses
This graph or chart is linked to excel, and changes automatically based on data. Just left click on it and select edit data. Introducing our Corporate Dashboard Illustrating Revenue And Operational Expenses set of slides. The topics discussed in these slides are Gross Profit Margin, PEX Ratio, EBIT Margin, Net Profit Margin. This is an immediately available PowerPoint presentation that can be conveniently customized. Download it and convince your audience.
-
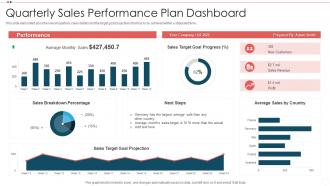 Quarterly Sales Performance Plan Dashboard
This slide elaborated about he overall quarterly sales details and the target goal projections that has to be achieved within a stipulated time. Presenting our well-structured Quarterly Sales Performance Plan Dashboard. The topics discussed in this slide are Sales Target Goal Progress, Sales Breakdown Percentage, Sales Target Goal Projection. This is an instantly available PowerPoint presentation that can be edited conveniently. Download it right away and captivate your audience.
-
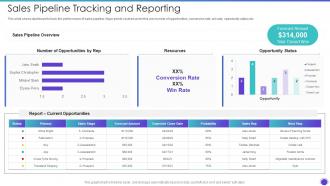 Sales Pipeline Tracking And Reporting Sales Pipeline Management Strategies
This slide shows dashboard to track the performance of sales pipeline. Major points covered under this are number of opportunities, conversion rate, win rate, opportunity status etc. Deliver an outstanding presentation on the topic using this Sales Pipeline Tracking And Reporting Sales Pipeline Management Strategies. Dispense information and present a thorough explanation of Sales Pipeline Overview, Resources, Opportunity using the slides given. This template can be altered and personalized to fit your needs. It is also available for immediate download. So grab it now.
-
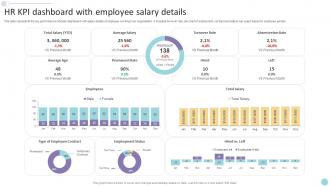 HR KPI Dashboard Snapshot With Employee Salary Details
This slide represents the key performance indicator dashboard snapshot with salary details of employee working in an organisation. It includes turnover rate, pie chart of employment contract and status, bar graph based on employee gender Introducing our HR KPI Dashboard With Employee Salary Details set of slides. The topics discussed in these slides are HR KPI Dashboard Snapshot Employee Salary Details. This is an immediately available PowerPoint presentation that can be conveniently customized. Download it and convince your audience.
-
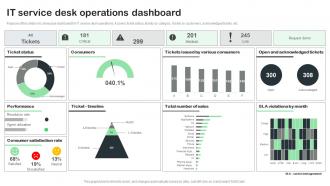 IT Service Desk Operations Dashboard
Purpose of this slide is to showcase dashboard for IT service desk operations. It covers ticket status, tickets by category, tickets by customers, acknowledged tickets, etc. Presenting our well structured IT Service Desk Operations Dashboard. The topics discussed in this slide are Ticket Status, Consumers, Performance, Consumer Satisfaction Rate. This is an instantly available PowerPoint presentation that can be edited conveniently. Download it right away and captivate your audience.
-
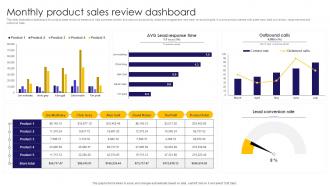 Monthly Product Sales Review Dashboard
This slide illustrates a dashboard for product sales review to measure to help business monitor and improve productivity, employee engagement and meet revenue targets. It covers product names with sales reps, lead conversion, response time and outbound calls. Presenting our well structured Monthly Product Sales Review Dashboard. The topics discussed in this slide are AVG Lead Response, Time, Outbound Calls, Lead Conversion Rate. This is an instantly available PowerPoint presentation that can be edited conveniently. Download it right away and captivate your audience.
-
 Ho seven segment circle of business target flat powerpoint design
Rational and resourceful PowerPoint visuals, An impressive tool perfect for Business professionals from diverse Companies, Huge range of unique PPT slides with multiple colored theme options , Quickly changeable colors, texts, fonts, graphics, PPT images, info graphic PPT designs in vector formats, High quality visuals , Exclusive design for better conceptualization, Resizable and editable Presentation graphics.


