Charts, Graphs PowerPoint Designs, Presentation Charts Designs & PPT Graphics
- Sub Categories
-
- Arrows and Targets
- Bullet and Text Slides
- Charts and Graphs
- Circular Cycle Diagrams
- Concepts and Shapes
- Custom Flat Designs
- Dashboards and Measuring
- Flow Process
- Funnels
- Gears
- Growth
- Harvey Balls
- Idea Innovation and Light Bulbs
- Leadership
- Linear Process Diagrams
- Magnifying Glass
- Misc Other Graphics
- Opportunity and Handshake
- Organization Charts
- Puzzles
- Pyramids
- Roadmaps and Timelines
- Silhouettes
- Steps
- Strategic Planning Analysis
- SWOT Analysis
- Tables and Matrix
- Teamwork
- Technology and Communication
- Venn Diagrams
- Visuals and Illustrations
-
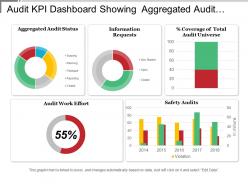 Audit kpi dashboard showing aggregated audit status and audit work effort
Presenting this set of slides with name - Audit Kpi Dashboard Showing Aggregated Audit Status And Audit Work Effort. This is a five stage process. The stages in this process are Audit, Examine, Survey.
-
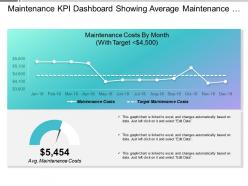 Maintenance kpi dashboard showing average maintenance costs
Presenting this set of slides with name - Maintenance Kpi Dashboard Showing Average Maintenance Costs. This is a one stage process. The stages in this process are Maintenance, Preservation, Conservation.
-
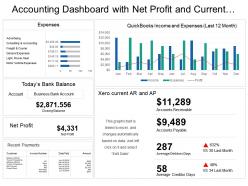 Accounting dashboard with net profit and current accounts payable
Presenting accounting dashboard with net profit and current accounts payable PPT slideshow. Makes the information clear in the mind of the audience. Editable visuals, colors and charts. Easy to edit and customize as per your needs. Beneficial for industry professionals, technologists, managers, executives, researchers, sales people, etc. Flexible presentation designs can be presented in standard and widescreen view. Privilege of insertion of logo and trademarks for more personalization. Easy to download and save. Highly beneficial PowerPoint Slide for highlighting financial data.
-
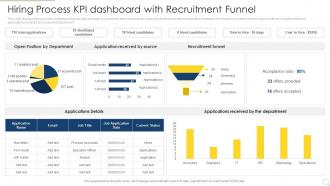 Hiring Process Kpi Dashboard Snapshot With Recruitment Funnel
This slide displays hiring process dashboard that can help company to source the best candidate for roles and develop new talent acquisition strategies. It includes key metrics that are open positions, recruitment funnel, applications received by source and department Introducing our Hiring Process Kpi Dashboard Snapshot With Recruitment Funnel set of slides. The topics discussed in these slides are Process, Dashboard, Recruitment. This is an immediately available PowerPoint presentation that can be conveniently customized. Download it and convince your audience.
-
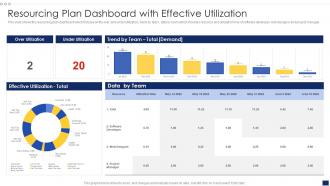 Resourcing Plan Dashboard Snapshot With Effective Utilization
This slide shows the resourcing plan dashboard which focuses on the over and under utilization, trend by team, data by team which includes resource and utilization time of software developer, web designer and project manager. Introducing our Resourcing Plan Dashboard Snapshot With Effective Utilization set of slides. The topics discussed in these slides are Effective Utilization Total, Team, Trend Team, Over Utilization. This is an immediately available PowerPoint presentation that can be conveniently customized. Download it and convince your audience.
-
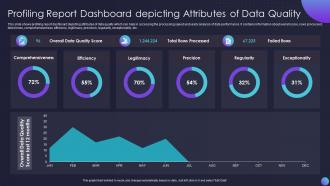 Profiling Report Dashboard Snapshot Depicting Attributes Of Data Quality
This slide shows profiling report dashboard snapshot depicting attributes of data quality which can help in accessing the processing speed and yearly analysis of data performance. It contains information about overall score, rows processed, failed rows, comprehensiveness, efficiency, legitimacy, precision, regularity, exceptionality, etc.Introducing our Profiling Report Dashboard Depicting Attributes Of Data Quality set of slides. The topics discussed in these slides are Comprehensiveness, Legitimacy, Efficiency This is an immediately available PowerPoint presentation that can be conveniently customized. Download it and convince your audience.
-
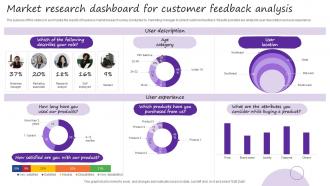 Market Research Dashboard For Customer Feedback Analysis
The purpose of this slide is to summarize the results of business market research survey conducted by marketing manager to collect customer feedback. Results provided are related to user description and user experience Presenting our well structured Market Research Dashboard For Customer Feedback Analysis. The topics discussed in this slide are Research, Dashboard, Analysis. This is an instantly available PowerPoint presentation that can be edited conveniently. Download it right away and captivate your audience.
-
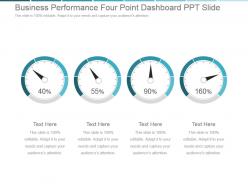 Business performance four point dashboard snapshot ppt slide
Presenting business performance four point dashboard snapshot ppt slide. This is a business performance four point dashboard ppt slide. This is a four stage process. The stages in this process are business, success, dashboard, finance, strategy.
-
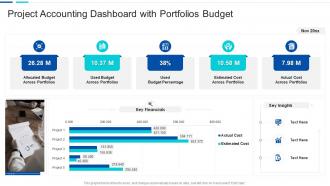 Project accounting dashboard with portfolios budget
Introducing our Project Accounting Dashboard With Portfolios Budget set of slides. The topics discussed in these slides are Budget, Portfolios, Cost. This is an immediately available PowerPoint presentation that can be conveniently customized. Download it and convince your audience.
-
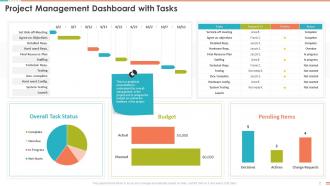 Project Management Dashboard With Tasks Project Management Bundle
Present the topic in a bit more detail with this Project Management Dashboard With Tasks Project Management Bundle. Use it as a tool for discussion and navigation on Overall Task Status, Budget, Pending Items. This template is free to edit as deemed fit for your organization. Therefore download it now.
-
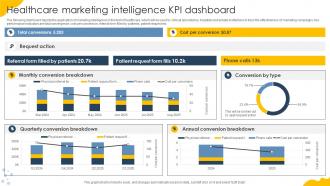 Healthcare Marketing Intelligence KPI Dashboard
The following dashboard depicts the application of marketing intelligence in the field of healthcare, which will be used by clinical laboratories, hospitals and private institutions to track the effectiveness of marketing campaigns. Key performance indicators are total convergence, cost per conversion, referral form filled by patients, patient request etc. Introducing our Healthcare Marketing Intelligence KPI Dashboard set of slides. The topics discussed in these slides are Patient Request, Conversion Breakdown, Request Action. This is an immediately available PowerPoint presentation that can be conveniently customized. Download it and convince your audience.
-
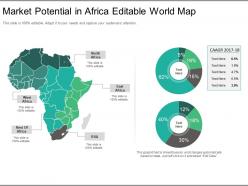 Market potential in africa editable world map ppt model
Presenting market potential in africa editable world map ppt model. This is a market potential in africa editable world map ppt model. This is a three stage process. The stages in this process are north africa, east africa, rsa, rest of africa, west africa.
-
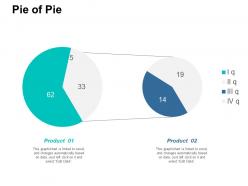 Pie of pie ppt summary background designs
Presenting this set of slides with name - Pie Of Pie Ppt Summary Background Designs. This is a two stage process. The stages in this process are Percentage, Product, Business, Management, Marketing.
-
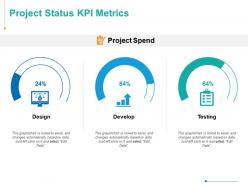 Project status kpi metrics testing ppt powerpoint presentation inspiration layouts
Presenting this set of slides with name - Project Status KPI Metrics Testing Ppt Powerpoint Presentation Inspiration Layouts. This is a three stage process. The stages in this process are Design, Develop, Testing, Finance, Marketing.
-
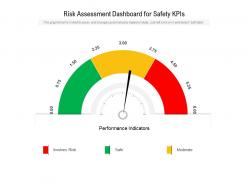 Risk assessment dashboard for safety kpis
Presenting this set of slides with name Risk Assessment Dashboard Snapshot For Safety KPIs. The topics discussed in these slides are Involves Risk, Safe, Moderate. This is a completely editable PowerPoint presentation and is available for immediate download. Download now and impress your audience.
-
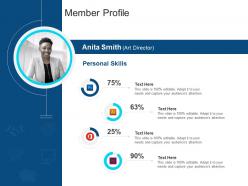 Corporate profiling member profile ppt themes
Present the topic in a bit more detail with this Corporate Profiling Member Profile Ppt Themes. Use it as a tool for discussion and navigation on Member Profile. This template is free to edit as deemed fit for your organization. Therefore download it now.
-
 Project management issue tracking dashboard
Introducing our Project Issue Management Dashboard With Budget And Risks Status set of slides. The topics discussed in these slides are Project Management Issue Tracking Dashboard. This is an immediately available PowerPoint presentation that can be conveniently customized. Download it and convince your audience.
-
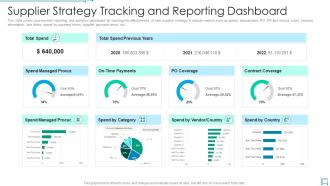 Supplier strategy tracking and reporting dashboard
This slide covers procurement reporting and analytics dashboard for tracking the effectiveness of new supplier strategy. It include metrics such as spend, transactions, PO, PR and invoice count, invoices information, due dates, spend by payment terms, supplier payment terms, etc. Introducing our Supplier Strategy Tracking And Reporting Dashboard set of slides. The topics discussed in these slides are Supplier Strategy Tracking And Reporting Dashboard. This is an immediately available PowerPoint presentation that can be conveniently customized. Download it and convince your audience.
-
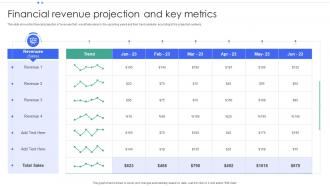 Financial Revenue Projection And Key Metrics
This slide shows the financial projection of revenues that would take place in the upcoming years and their trend analysis according to the projected numbers. Introducing our Financial Revenue Projection And Key Metrics set of slides. The topics discussed in these slides are Financial, Revenue Projection, Key Metrics. This is an immediately available PowerPoint presentation that can be conveniently customized. Download it and convince your audience.
-
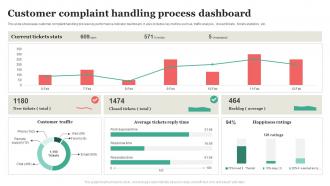 Customer Complaint Handling Process Dashboard
This slide showcases customer complaint handling process key performance indicator dashboard . It also includes key metrics such as traffic analysis , closed tickets , tickets statistics , etc. Presenting our well structured Customer Complaint Handling Process Dashboard. The topics discussed in this slide are Process, Dashboard, Customer. This is an instantly available PowerPoint presentation that can be edited conveniently. Download it right away and captivate your audience.
-
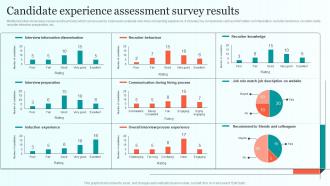 Candidate Experience Assessment Survey Results Comprehensive Guide For Talent Sourcing
Mentioned slide showcases survey result summary which can be used by business to evaluate new hires onboarding experience. It includes key components such as information communication, recruiter behaviour, recruiter clarify, recruiter interview preparation, etc. Deliver an outstanding presentation on the topic using this Candidate Experience Assessment Survey Results Comprehensive Guide For Talent Sourcing Dispense information and present a thorough explanation of Recruiter Behaviour, Recruiter Knowledge, Interview Preparation using the slides given. This template can be altered and personalized to fit your needs. It is also available for immediate download. So grab it now.
-
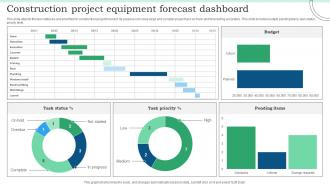 Construction Project Equipment Forecast Dashboard
This slide depicts the task statuses and priorities for construction project forecast. Its purpose is to keep large and complex project task on track and forecasting accurately. This slide includes budget, pending tasks, task status, priority level. Presenting our well structured Construction Project Equipment Forecast Dashboard. The topics discussed in this slide are Task Status, Pending Items. This is an instantly available PowerPoint presentation that can be edited conveniently. Download it right away and captivate your audience.
-
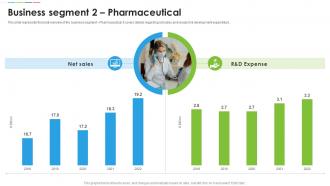 Bayer Company Profile Business Segment 2 Pharmaceutical Ppt Slides CP SS
This slide represents financial overview of the business segment Pharmaceutical. It covers details regarding net sales and research and development expenditure. Deliver an outstanding presentation on the topic using this Bayer Company Profile Business Segment 2 Pharmaceutical Ppt Slides CP SS. Dispense information and present a thorough explanation of Net Sales, Expense using the slides given. This template can be altered and personalized to fit your needs. It is also available for immediate download. So grab it now.
-
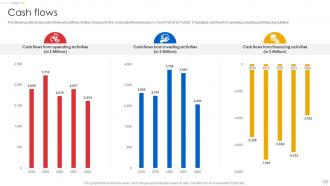 Ebay Company Profile Cash Flows Ppt Rules CP SS
The following slide shows cash inflows and outflows of eBay company for five consecutive financial years i.e. from FY2018 to FY2022. It highlights cash flow from operating, investing and financing activities. Present the topic in a bit more detail with this Ebay Company Profile Cash Flows Ppt Rules CP SS. Use it as a tool for discussion and navigation on Cash Flows. This template is free to edit as deemed fit for your organization. Therefore download it now.
-
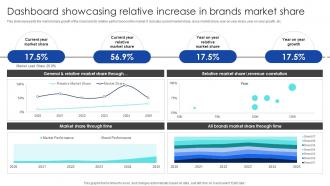 Strategic Process To Enhance Dashboard Showcasing Relative Increase In Brands Market Share
This slide represents the market share growth of the brand and its relative performance in the market. It includes current market share, close market share, year-on-year share, year-on-year growth, etc. Deliver an outstanding presentation on the topic using this Strategic Process To Enhance Dashboard Showcasing Relative Increase In Brands Market Share Dispense information and present a thorough explanation of Current Year Market Share, Relative Market Share, Year On Year Growth using the slides given. This template can be altered and personalized to fit your needs. It is also available for immediate download. So grab it now.
-
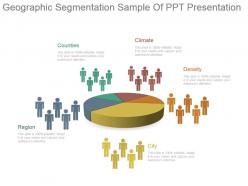 Geographic segmentation sample of ppt presentation
Presenting geographic segmentation sample of ppt presentation. This is a geographic segmentation sample of ppt presentation. This is a five stage process. The stages in this process are counties, climate, density, city, region.
-
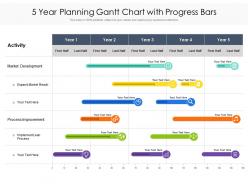 5 year planning gantt chart with progress bars
Presenting this set of slides with name 5 Year Planning Gantt Chart With Progress Bars. The topics discussed in these slides are Activity, Market Development, Expand Market Reach, Process Improvement. This is a completely editable PowerPoint presentation and is available for immediate download. Download now and impress your audience.
-
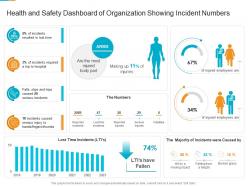 Health and safety dashboard of organization showing incident numbers
Presenting our well structured Health And Safety Dashboard Of Organization Showing Incident Numbers. The topics discussed in this slide are Fatalities, Serious Injuries, Lost Time Incidents. This is an instantly available PowerPoint presentation that can be edited conveniently. Download it right away and captivate your audience.
-
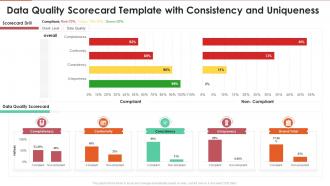 Data quality scorecard template with consistency and uniqueness
Present the topic in a bit more detail with this Data Quality Scorecard Template With Consistency And Uniqueness. Use it as a tool for discussion and navigation on Completeness, Conformity, Consistency, Uniqueness, Grand Total . This template is free to edit as deemed fit for your organization. Therefore download it now.
-
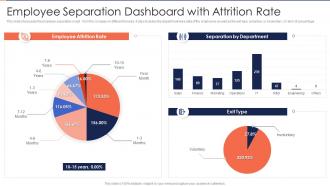 Employee Separation Dashboard Snapshot With Attrition Rate
This slide showcases the employee separation or exit form the company in different tenures. It also includes the department wise data of the employees as well as the exit type voluntary or involuntary in term of percentage. Presenting our well structured Employee Separation Dashboard Snapshot With Attrition Rate. The topics discussed in this slide are Employee Attrition Rate, Exit Type, Separation By Department. This is an instantly available PowerPoint presentation that can be edited conveniently. Download it right away and captivate your audience.
-
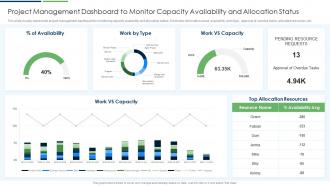 Project Management Dashboard To Monitor Capacity Availability And Allocation Status
This slide visually represents project management dashboard for monitoring capacity availability and allocation status. It includes information about availability, work type, approval of overdue tasks, allocated resources, etc. Introducing our Project Management Dashboard To Monitor Capacity Availability And Allocation Status set of slides. The topics discussed in these slides are Management, Dashboard, Allocation. This is an immediately available PowerPoint presentation that can be conveniently customized. Download it and convince your audience.
-
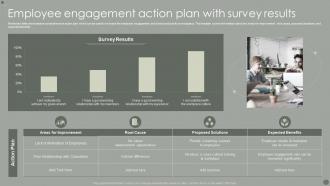 Employee Engagement Action Plan With Survey Results
Mentioned slide showcases a comprehensive action plan which can be used to increase the employee engagement and boost productivity at workplace. The template covers information about the areas for improvement, root cause, proposed solutions, and expected benefits. Presenting our well-structured Employee Engagement Action Plan With Survey Results. The topics discussed in this slide are Employee Engagement, Action Plan, Survey Results. This is an instantly available PowerPoint presentation that can be edited conveniently. Download it right away and captivate your audience.
-
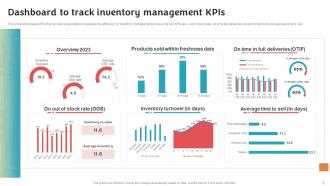 Dashboard To Track Inventory Management Stock Inventory Procurement And Warehouse
This slide showcases KPIs that can help organization to evaluate the efficiency of inventory management process. Its key KPIs are out of stock rate, on time full deliveries, inventory turnover and average time to sell. Present the topic in a bit more detail with this Dashboard To Track Inventory Management Stock Inventory Procurement And Warehouse. Use it as a tool for discussion and navigation on Products Sold, Inventory Turnover, Average Time To Sell. This template is free to edit as deemed fit for your organization. Therefore download it now.
-
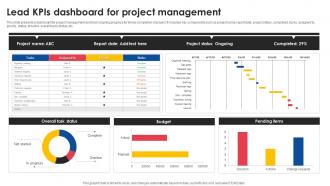 Lead Kpis Dashboard For Project Management
This slide presents a dashboard for project management and track ongoing progress for timely completion of project. It includes key components such as project name, report date, project status, completed, tasks, assigned to, priority, status, timeline, overall tasks status, etc. Introducing our Lead Kpis Dashboard For Project Management set of slides. The topics discussed in these slides are Tasks, Priority, Budget. This is an immediately available PowerPoint presentation that can be conveniently customized. Download it and convince your audience.
-
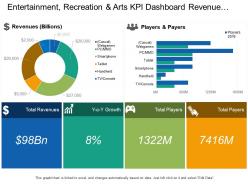 Entertainment recreation and arts kpi dashboard revenue players and payers
Presenting this set of slides with name - Entertainment Recreation And Arts Kpi Dashboard Revenue Players And Payers. This is a four stage process. The stages in this process are Entertainment, Recreation And Arts, Attractions, Culture, Entertainment.
-
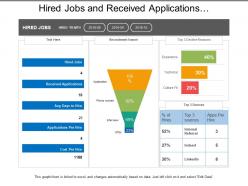 Hired jobs and received applications recruitment dashboard
Presenting this set of slides with name - Hired Jobs And Received Applications Recruitment Dashboard. This is a three stage process. The stages in this process are Staffing Plan, Recruitment, Staff Management.
-
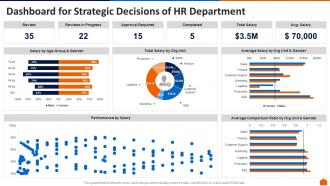 Dashboard for strategic decisions of hr department hr service delivery ppt slides smartart
Present the topic in a bit more detail with this Dashboard For Strategic Decisions Of Hr Department Hr Service Delivery Ppt Slides Smartart. Use it as a tool for discussion and navigation on Dashboard For Strategic Decisions Of HR Department. This template is free to edit as deemed fit for your organization. Therefore download it now.
-
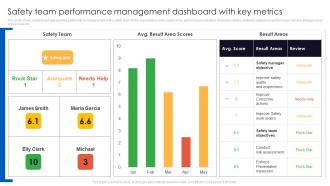 Safety Team Performance Management Dashboard Snapshot With Key Metrics
This slide shows a dashboard representing performance measurement of the safety team of the organization on the basis of key performance indicators. It includes details related to safety team performance ranking, average result area scores etc. Presenting our well structured Safety Team Performance Management Dashboard Snapshot With Key Metrics. The topics discussed in this slide are Safety Team Performance, Management Dashboard, Key Metrics. This is an instantly available PowerPoint presentation that can be edited conveniently. Download it right away and captivate your audience.
-
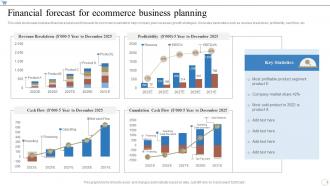 Financial Forecast For Ecommerce Business Planning
This slide showcases business financial analysis and forecasts for ecommerce website to help company plan necessary growth strategies. It includes parameters such as revenue breakdown, profitability, cash flow, etc. Presenting our well-structured Financial Forecast For Ecommerce Business Planning. The topics discussed in this slide are Financial Forecast, Ecommerce Business Planning. This is an instantly available PowerPoint presentation that can be edited conveniently. Download it right away and captivate your audience.
-
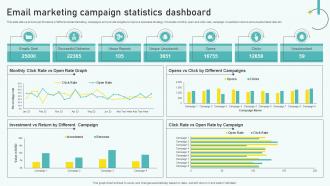 Email Marketing Campaign Statistics Dashboard
This slide allows to track performance of different email marketing campaigns and provide insights to improve business strategy. It includes monthly open and click rate, campaign investment returns and unsubscribed ratio etc.Introducing our Email Marketing Campaign Statistics Dashboard set of slides. The topics discussed in these slides are Successful Deliveries, Different Campaigns, Abuse Reports. This is an immediately available PowerPoint presentation that can be conveniently customized. Download it and convince your audience.
-
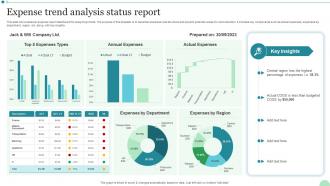 Expense Trend Analysis Status Report
This slide showcases an expense report dashboard for analyzing trends. The purpose of this template is to ascertain business cost structure and pinpoint potential areas for cost reduction. It includes key components such as actual expenses, expenses by department, region, etc. along with key insights. Presenting our well structured Expense Trend Analysis Status Report. The topics discussed in this slide are Expenses Types, Annual Expenses.This is an instantly available PowerPoint presentation that can be edited conveniently. Download it right away and captivate your audience.
-
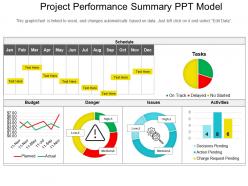 Project performance summary ppt model
Presenting a PPT template named Project performance Summary PPT Model. It is a professionally designed template with relevant visuals and subject driven content. Get easy access to the customizable slide which is linked with the Excel sheet. You can edit the colour, text and font size as per your need. You can add or delete the content if required. The slide is compatible with Google Slides and can be exported in both PDF as well as JPG formats. You can avail this PPT slide both in standard as well as widescreen size.
-
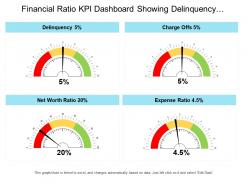 Financial ratio kpi dashboard snapshot showing delinquency charge offs and net worth ratio
Presenting this set of slides with name - Financial Ratio Kpi Dashboard Snapshot Showing Delinquency Charge Offs And Net Worth Ratio. This is a four stage process. The stages in this process are Accounting Ratio, Financial Statement, Financial Ratio.
-
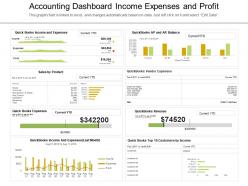 Accounting dashboard income expenses and profit
Presenting this set of slides with name - Accounting Dashboard Income Expenses And Profit. This is a six stage process. The stages in this process are Accounting, Bookkeeping, Auditing, Finance.
-
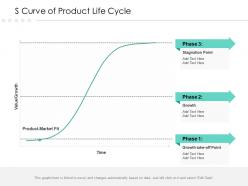 S curve of product life cycle
Presenting this set of slides with name S Curve Of Product Life Cycle. The topics discussed in these slides are Stagnation Point, Growth, Value. This is a completely editable PowerPoint presentation and is available for immediate download. Download now and impress your audience.
-
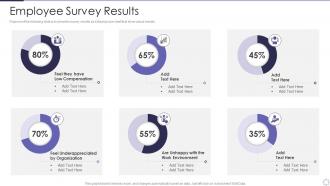 Managing Employee Turnover Employee Survey Results Ppt Microsoft
Purpose of the following slide is to show the survey results as it displays pie chart that show actual results. Deliver an outstanding presentation on the topic using this Managing Employee Turnover Employee Survey Results Ppt Microsoft. Dispense information and present a thorough explanation of Work Environment, Employee Survey Results using the slides given. This template can be altered and personalized to fit your needs. It is also available for immediate download. So grab it now.
-
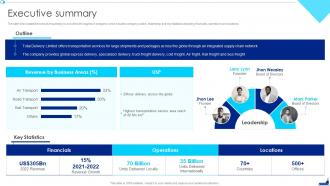 Shipping Company Profile Executive Summary Ppt Infographics Deck
The slide showcases the executive summary to provide brief insights of company which includes company outline, leadership and key statistics depicting financials, operations and locations. Deliver an outstanding presentation on the topic using this Shipping Company Profile Executive Summary Ppt Infographics Deck. Dispense information and present a thorough explanation of Financials, Revenue Business Areas, Operations using the slides given. This template can be altered and personalized to fit your needs. It is also available for immediate download. So grab it now.
-
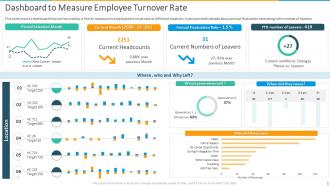 Dashboard To Measure Employee Turnover Rate Introducing Employee Succession Planning
Deliver an outstanding presentation on the topic using this Dashboard To Measure Employee Turnover Rate Introducing Employee Succession Planning. Dispense information and present a thorough explanation of Current Headcounts, Dashboard To Measure, Employee Turnover Rate using the slides given. This template can be altered and personalized to fit your needs. It is also available for immediate download. So grab it now.
-
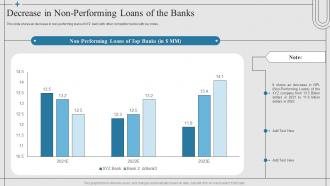 Financial Risk Management Strategies Decrease In Non Performing Loans Of The Banks
This slide shows an decrease in non-performing loans of XYZ bank with other competitor banks with key notes. Present the topic in a bit more detail with this Financial Risk Management Strategies Decrease In Non Performing Loans Of The Banks. Use it as a tool for discussion and navigation on Decrease, Performing, Company. This template is free to edit as deemed fit for your organization. Therefore download it now.
-
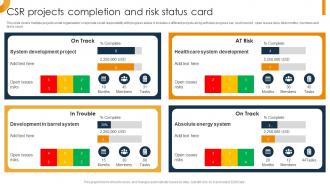 CSR Projects Completion And Risk Status Card
This slide covers multiple projects under organizations corporate social responsibility with progress status. It includes 4 different projects along with task progress bar, cost incurred, open issues risks, total months, members and tasks count. Presenting our well structured CSR Projects Completion And Risk Status Card. The topics discussed in this slide are System Development Project, Healthcare System Development, Absolute Energy System. This is an instantly available PowerPoint presentation that can be edited conveniently. Download it right away and captivate your audience.
-
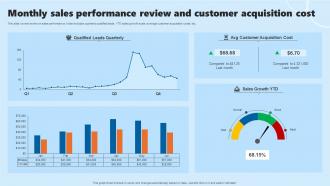 Monthly Sales Performance Review And Customer Acquisition Cost
This slide covers review on sales performance. It also includes quarterly qualified leads, YTD sales growth scale, average customer acquisition costs, etc. Presenting our well structured Monthly Sales Performance Review And Customer Acquisition Cost. The topics discussed in this slide are Sales, Customer, Cost. This is an instantly available PowerPoint presentation that can be edited conveniently. Download it right away and captivate your audience.
-
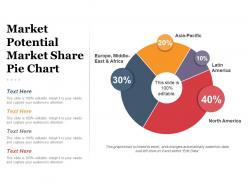 Market potential market share pie chart presentation deck
Presenting market potential market share pie chart presentation deck. This is a market potential market share pie chart presentation deck. This is a four stage process. The stages in this process are business, marketing, finance, strategy, success, pie chart.
-
 Adversity man jumping over cliff challenges and goals
Presenting this set of slides with name - Adversity Man Jumping Over Cliff Challenges And Goals. This is a two stage process. The stages in this process are Adversity, Problems And Challenges, Problems And Hurdles.
-
 Social media kpi dashboard showing traffic social events referral traffic
Presenting this set of slides with name - Social Media Kpi Dashboard Showing Traffic Social Events Referral Traffic. This is a four stage process. The stages in this process are Social Media, Digital Marketing, Social Marketing.
-
 Revenue bridge graph showing sales growth
Presenting this set of slides with name Revenue Bridge Graph Showing Sales Growth. The topics discussed in these slide is Revenue Bridge Graph Showing Sales Growth. This is a completely editable PowerPoint presentation and is available for immediate download. Download now and impress your audience.
-
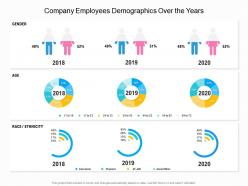 Company employees demographics over the years
Presenting this set of slides with name Company Employees Demographics Over The Years. The topics discussed in these slides are Ethnicity, Gender, Age. This is a completely editable PowerPoint presentation and is available for immediate download. Download now and impress your audience.
-
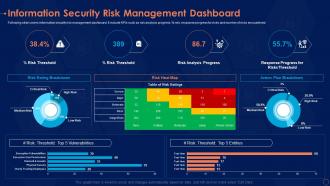 Information security risk management dashboard ppt icon examples
Following slide covers information security risk management dashboard. It include KPIs such as risk analysis progress, per cent risk, response progress for risks and number of risks encountered. Deliver an outstanding presentation on the topic using this Information Security Risk Management Dashboard Ppt Icon Examples. Dispense information and present a thorough explanation of Vulnerabilities, Response, Risk Analysis using the slides given. This template can be altered and personalized to fit your needs. It is also available for immediate download. So grab it now.
-
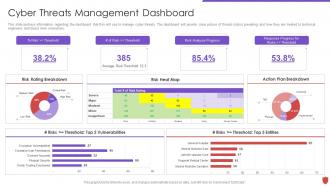 Cyber security risk management cyber threats management dashboard
This slide portrays information regarding the dashboard that firm will use to manage cyber threats. The dashboard will provide clear picture of threats risks prevailing and how they are treated to technical engineers and board level executives. Deliver an outstanding presentation on the topic using this Cyber Security Risk Management Cyber Threats Management Dashboard. Dispense information and present a thorough explanation of Risk Rating Breakdown, Risk Heat Map, Action Plan Breakdown, Risks, Threshold Top 5 Entities using the slides given. This template can be altered and personalized to fit your needs. It is also available for immediate download. So grab it now.
-
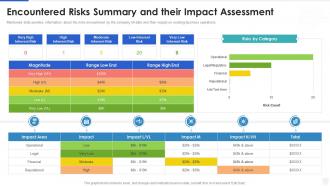 Cybersecurity and digital business risk management encountered risks summary
Mentioned slide provides information about the risks encountered by the company till date and their impact on existing business operations. Deliver an outstanding presentation on the topic using this Cybersecurity And Digital Business Risk Management Encountered Risks Summary. Dispense information and present a thorough explanation of Assessment, Information, Business using the slides given. This template can be altered and personalized to fit your needs. It is also available for immediate download. So grab it now.
-
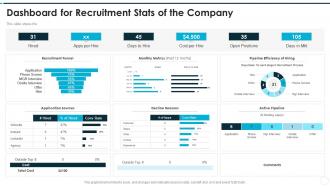 Recruitment training to improve selection process dashboard for recruitment stats of the company
Deliver an outstanding presentation on the topic using this Recruitment Training To Improve Selection Process Dashboard For Recruitment Stats Of The Company. Dispense information and present a thorough explanation of Dashboard For Recruitment Stats Of The Company using the slides given. This template can be altered and personalized to fit your needs. It is also available for immediate download. So grab it now.


