Charts, Graphs PowerPoint Designs, Presentation Charts Designs & PPT Graphics
- Sub Categories
-
- Arrows and Targets
- Bullet and Text Slides
- Charts and Graphs
- Circular Cycle Diagrams
- Concepts and Shapes
- Custom Flat Designs
- Dashboards and Measuring
- Flow Process
- Funnels
- Gears
- Growth
- Harvey Balls
- Idea Innovation and Light Bulbs
- Leadership
- Linear Process Diagrams
- Magnifying Glass
- Misc Other Graphics
- Opportunity and Handshake
- Organization Charts
- Puzzles
- Pyramids
- Roadmaps and Timelines
- Silhouettes
- Steps
- Strategic Planning Analysis
- SWOT Analysis
- Tables and Matrix
- Teamwork
- Technology and Communication
- Venn Diagrams
- Visuals and Illustrations
-
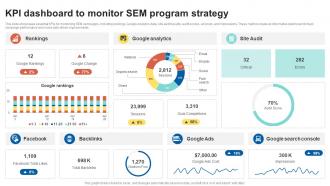 KPI Dashboard To Monitor SEM Program Strategy
This slide showcases essential KPIs for monitoring SEM campaigns, including rankings, Google Analytics data, site audit results, audit scores, ad costs, and impressions. These metrics create an informative dashboard to track campaign performance and make data-driven improvements. Introducing our KPI Dashboard To Monitor SEM Program Strategy set of slides. The topics discussed in these slides are Google Rankings, Google Analytics, Site Audit. This is an immediately available PowerPoint presentation that can be conveniently customized. Download it and convince your audience.
-
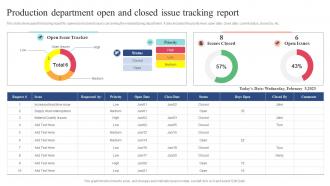 Production Department Open And Closed Issue Tracking Report
This slide showcases the tracking report for opened and closed issues concerning the manufacturing department. It also includes the priority level, open date, close date, current status, closed by, etc. Presenting our well structured Production Department Open And Closed Issue Tracking Report. The topics discussed in this slide are Production Department, Open Closed Issue, Tracking Report. This is an instantly available PowerPoint presentation that can be edited conveniently. Download it right away and captivate your audience.
-
 Kpi Dashboard Snapshot Powerpoint Ideas
Fabulously composed PPT design useful for business professionals, organizational experts or researchers , students and many more from diverse areas , Comprehensive and convenient PPT Images with ductile dummy data options, Consonant with all available graphic software’s and Google slides, Accessible to other file configurations like PDF or JPG. Multi-color options, background images, styles and other characteristics are fully editable, Expeditious downloading process, Allows to introduce your company logo or brand name in the PPT slides.
-
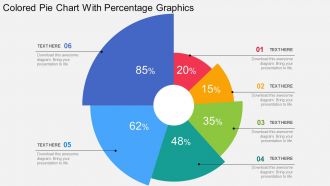 Colored pie chart with percentage graphics flat powerpoint design
We are proud to present our colored pie chart with percentage graphics flat powerpoint design. Graphic of colored pie chart has been used to craft this power point template diagram. This PPT diagram contains the concept of financial analysis. Use this PPT diagram for business and finance related presentations.
-
 Dashboards By Industry Powerpoint Presentation Slides
This complete deck has PPT slides on Dashboards By Industry Powerpoint Presentation Slides with well-suited graphics and subject driven content. This deck consists of a total of twenty-seven slides. All templates are completely editable for your convenience. You can change the color, text and font size of these slides. You can add or delete the content as per your requirement. The templates are compatible with Google Slides so it can be easily accessible. It can be saved into various file formats like PDF, JPG. And PNG. It is available in both standard and widescreen formats.
-
 Bar Graphs And Pie Charts Sale Business Powerpoint Templates Themes
Pixel-friendly images and graphics in the icons. No effect on picture quality when used on a wide screen display. Attune well with the major online and offline softwares. Provided instructions to customize the content and the slide icons. Useful for the business entrepreneurs and the professional presenters.
-
 Web Development Seo Monitoring Content Optimization Web Design Ppt Icons Graphics
Presenting web development seo monitoring content optimization web design ppt icons graphics. This Power Point icon template diagram has been crafted with graphic of web and technology icons. This icon PPT diagram contains the concept of SEO monitoring and content optimization. Use this icon PPT for web and technology related presentations.
-
 Key Human Resource Metrics Dashboard Snapshot Ppt Slide
Presenting key human resource metrics dashboard snapshot ppt slide. This is a key human resource metrics dashboard ppt slide. This is a four stage process. The stages in this process are key health metrics, previous 4 quarters, change year over year, voluntary, turnover rate, involuntary, q, registration rate, manager instability rate, top talent turnover rate, top 3 potential areas of concern, for smb services in vancouver, for products in u k, for human resources in denver, key health metrics, previous 4 quarters, change year over year, flow through rate, headcount flow, out, in, span of control, direct compensation change.
-
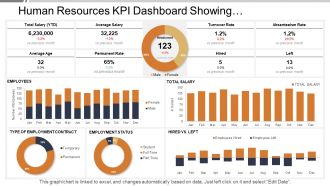 Human resources kpi dashboard showing employment status turnover rate
SlideTeam presents the Human Resources Kpi Dashboard Showing Employment Status Turnover Rate PPT which will help you keep a track of the human capital working under you. All the slides in the slideshow are 100 percent editable and you can make all the desired changes in the presentation. You can also add or delete the slides All the slides are fully compatible with Google slides as well. Your audience will be amazed by Google slides. You can even view the document in 16:9 widescreen size.
-
 Architectural Discussion Process Control Data Analysis Chart Gears Ppt Icons Graphics
Presenting architectural discussion process control data analysis chart gears ppt icons graphics. This Power Point icon template diagram has been crafted with graphic of gears, data chart and architectural icons. This icon template contains the concept of data analysis and process control. Use this icon PPT for architecture and data related presentations.
-
 3d Men Holding Feedback Signifying Solution Problem Ppt Graphic Icon
We are proud to present our 3d men holding feedback signifying solution problem ppt graphic icon. Use this PowerPoint Diagram which shows three men standing together holding feedback. It portrays the concept of response, reaction, comment, criticism, advice, pointer, opinion, view and reply etc. They will enhance the essence of your viable ideas.
-
 Achieving Sales Target Sales Kpi Editable Dashboard Snapshot Ppt Diagrams
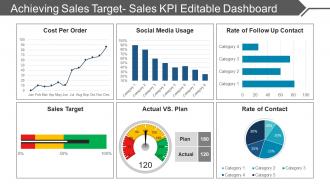
Presenting achieving sales target sales kpi editable dashboard PPT diagrams. Simple data input like company logo, name or trademark. This PowerPoint theme is fully supported by Google slides. Picture quality of these slides does not change even when projected on large screen. Fast downloading speed and formats can be easily changed to JPEG and PDF applications. This template is suitable for marketing, sales persons, business managers and entrepreneurs. Adjust PPT layout, font, text and color as per your necessity.
-
 New product performance evaluation product performance dashboards
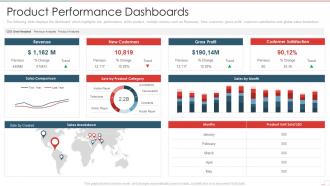
The following slide displays the dashboard which highlights the performance of the product, multiple metrics such as Revenues, New customer, gross profit, customer satisfaction and global sales breakdown Present the topic in a bit more detail with this New Product Performance Evaluation Product Performance Dashboards. Use it as a tool for discussion and navigation on Product Performance Dashboards. This template is free to edit as deemed fit for your organization. Therefore download it now.
-
 Annual B2C Business Review Dashboard Snapshot
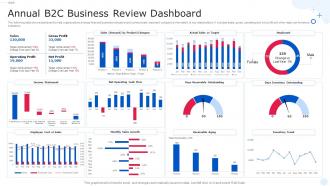
The following slide shows dashboard to help organizations arrange financial business indicators and communicate important companys information to key stakeholders. It includes sales, gross, operating and net profit and other major performance indicators. Introducing our Annual B2C Business Review Dashboard Snapshot set of slides. The topics discussed in these slides are Monthly Sales Growth, Days Receivable Outstanding, Days Inventory Outstanding. This is an immediately available PowerPoint presentation that can be conveniently customized. Download it and convince your audience.
-
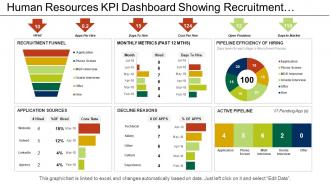 Human resources kpi dashboard showing recruitment funnel application sources
Presenting this set of slides with name - Human Resources Kpi Dashboard Showing Recruitment Funnel Application Sources. This is a six stage process. The stages in this process are Human Resource, Hrm, Human Capital.
-
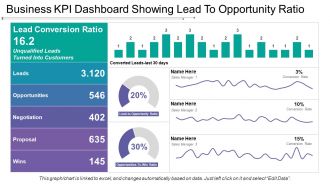 Business kpi dashboard showing lead to opportunity ratio
Presenting this set of slides with name - Business Kpi Dashboard Showing Lead To Opportunity Ratio. This is a three stage process. The stages in this process are Business Dashboard, Business Kpi, Business Performance.
-
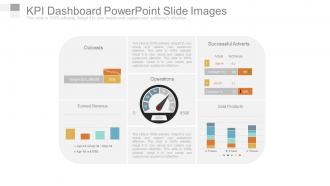 Kpi Dashboard Powerpoint Slide Images
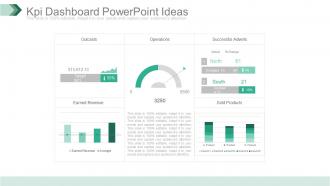
Presenting kpi dashboard powerpoint slide images. This is a kpi dashboard powerpoint slide images. This is a one stage process. The stages in this process are sold products, earned revenue, outcasts, successful adverts, operations, target, compare.
-
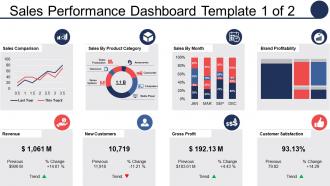 Sales performance dashboard sales comparison sales by product category
Introducing sales performance dashboard sales comparison sales by product category PPT design. Tailor the design with trade name, icon and even tagline. Fast download and easy to convert into JPG and PDF. Alternative to share presentation diagram in standard and widescreen display view. High quality PowerPoint slide comes with editable options as color, text and font can be edited at any stage. PowerPoint graphic is available with different nodes and stages.
-
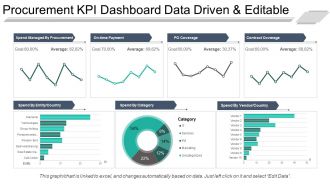 Procurement kpi dashboard snapshot data driven and editable ppt sample file
Presenting procurement kpi dashboard snapshot data driven and editable ppt sample file. This is a procurement kpi dashboard data driven and editable ppt sample file. This is a seven stage process. The stages in this process are business, strategy, growth, finance, chart and graph.
-
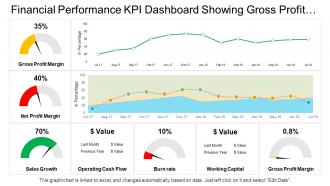 Financial performance kpi dashboard showing gross profit margin sales growth operating cash flow
Presenting this set of slides with name - Financial Performance Kpi Dashboard Showing Gross Profit Margin Sales Growth Operating Cash Flow. This is a three stage process. The stages in this process are Financial Performance, Financial Report, Financial Review.
-
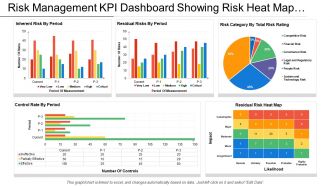 Risk Management Kpi Dashboard Showing Risk Heat Map And Control Rate By
Presenting this set of slides with name - Risk Management Kpi Dashboard Showing Risk Heat Map And Control Rate By Period. This is a five stage process. The stages in this process are Risk Management, Risk Assessment, Project Risk.
-
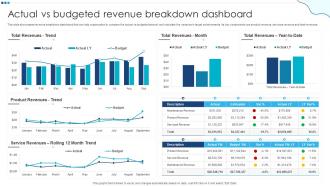 Actual Vs Budgeted Revenue Breakdown Dashboard
This style showcases revenue breakdown dashboard that can help organization to compare the actual vs budgeted amount and calculate the variance in target achievements. Its key components are product revenue, services revenue and total revenues Introducing our Actual Vs Budgeted Revenue Breakdown Dashboard set of slides. The topics discussed in these slides are Actual Vs Budgeted, Revenue Breakdown Dashboard. This is an immediately available PowerPoint presentation that can be conveniently customized. Download it and convince your audience.
-
 Sales performance reporting ppt sample presentations
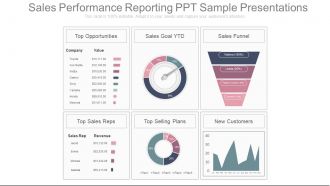
These slides are fully editable to suit your needs. Instantly download any design within a few seconds. Standard and widescreen compatible graphics. Can be opened using Google Slides also. Suitable for use by marketers, sales team, businessmen. Premium customer support service.This is a four stage process. The stages in this process are top opportunities, sales goal ytd, sales funnel, top sales reps, top selling plans, new customers, company, value, sales rep, revenue.
-
 Risk Management Kpi Dashboard Showing Overall Security Risk And Regulatory
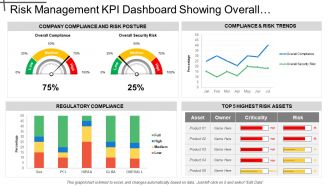
Presenting this set of slides with name - Risk Management Kpi Dashboard Showing Overall Security Risk And Regulatory Compliance. This is a four stage process. The stages in this process are Risk Management, Risk Assessment, Project Risk.
-
 Project status kpi dashboard snapshot showing delivery roadmap and resource allocation
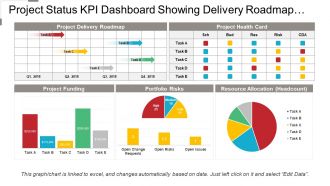
Presenting project status KPI dashboard snapshot showing delivery roadmap and resource allocation. Simple data input with linked Excel chart, just right click to input values. This PowerPoint theme is fully supported by Google slides. Picture quality of these slides does not change even when project on large screen. Fast downloading speed and formats can be easily changed to JPEG and PDF applications. This template is suitable for marketing, sales persons, business managers and entrepreneurs. Adjust PPT layout, font, text and color as per your necessity.
-
 1214 Four Colored Pie Charts For Result Analysis Data Driven Powerpoint Slide
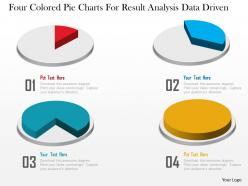
We are proud to present our 1214 four colored pie charts for result analysis data driven powerpoint slide. Four colored pie charts are used to craft this power point template slide. This PPT slide contains the concept of data driven result analysis. This PPT can be used for business and finance related presentations
-
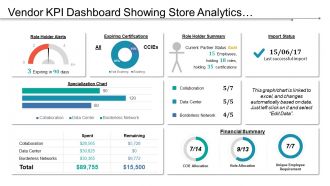 Vendor kpi dashboard showing role holder alerts and specialization chart
Presenting Vendor KPI Dashboard Showing Role Holder Alerts And Specialization Chart Pictures PPT slide. This presentation design has been professionally designed, is fully editable in PowerPoint and is compatible with Google slides as well. The font type, font size, colors of the diagrams, background color are customizable and the company logo can be added too. High quality graphs, charts, tables and icons ensure that there is no deteriorating in quality on enlarging their size. Fast download at click of a button.
-
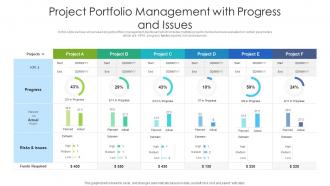 Project portfolio management dashboard snapshot with progress and issues
In this slide we have showcased project portfolio management dashboard which includes multiple projects involved and are evaluated on certain parameters which are- KPIS, progress, funds required, risk and issue etc. Introducing our Project Portfolio Management dashboard snapshot With Progress And Issues set of slides. The topics discussed in these slides are Project Portfolio Management With Progress And Issues. This is an immediately available PowerPoint presentation that can be conveniently customized. Download it and convince your audience.
-
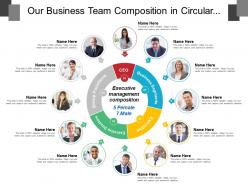 Our business team composition in circular format
Presenting this set of slides with name - Our Business Team Composition In Circular Format. This is a two stage process. The stages in this process are Our Team, Our Group, Our Members.
-
 Sign Up Vendor Shopping Goods Delivery Ppt Icons Graphics
Presenting sign up vendor shopping goods delivery ppt icons graphics. This Power Point icon template diagram has been crafted with graphic of sign up, vendor and goods icons. This icon PPT diagram contains the concept of goods shopping .Use this icon PPT for business and finance related presentations.
-
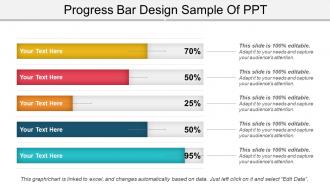 Progress bar design sample of ppt
Presenting a PowerPoint slide named Progress Bar Design Sample of PPT. Use this completely customizable and easy-to-edit PPT slide to communicate your ideas in the presentation. You can format the font size, color and style of the slide. Add your desired content anywhere in the slide. Its compatibility with Google Slides makes it readily accessible. You can save it in PDF, JPEG or JPG formats. This PPT slide is Excel-linked. You can avail it in a widescreen size as well a standard size screen.
-
 Types Of Organizational Structures And Org Charts Powerpoint Presentation Slides
Introducing Types Of Organizational Structures And Org Charts Powerpoint Presentation Slides. Design a visually-grabbing business presentation using this 100% editable complete PPT template deck. Gain access to 46 professionally-built PowerPoint slides. Customize text, background, colors, font, patterns, orientation, and shapes as desired. Change the PowerPoint presentation into various file formats like PDF, PNG, and JPG as and when convenient. Use Google Slides to view this presentation. It is also compatible with standard and widescreen display aspect ratios.
-
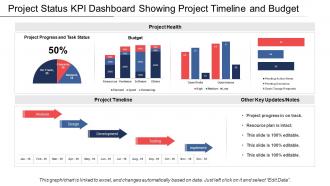 Project status kpi dashboard showing project timeline and budget
Presenting this set of slides with name - Project Status Kpi Dashboard Showing Project Timeline And Budget. This is a five stage process. The stages in this process are Project Health Card, Project Performance, Project Status.
-
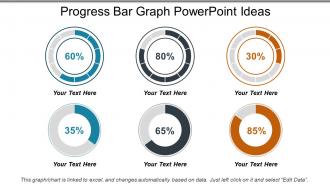 Progress bar graph powerpoint ideas
Presenting the slide named Progress Bar Graph PowerPoint Ideas. This template is professionally designed and is completely editable. The font color, font size, font style, background color and the color of the diagram can be altered as per your suitability. The text in the template can be replaced with your desired content. The slide is compatible with Google Slides and can be easily saved in JPG or PDF format. You can customize the template conveniently by changing the data in the excel sheet, as this template is Excel-linked.
-
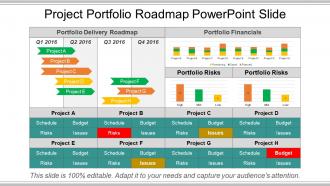 Project portfolio roadmap powerpoint slide
Presenting project portfolio roadmap PowerPoint slide. This is professional developed Presentation graphic. The PPT layout also provides the high resolution quality levels which remains unaffected even when projected on to the wider screens. This PPT slide is also simple to use and download. All the features diagram, chart, design, pattern, size, color, and PowerPoint image etc. are totally modifiable. This is also well conversant with the Google Slides and other operating software. Can be used with the different file formats such as PDF or JPG.
-
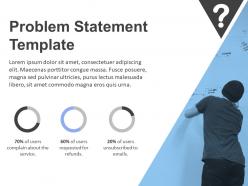 Problem Statement Template With Man Writing On Whiteboard And Data Driven Pie Charts
Presenting problem statement template with man writing on whiteboard and data driven pie charts. This is a problem statement template with man writing on whiteboard and data driven pie charts. This is a three stage process. The stages in this process are problem, business problem, research problem statement, business challenge, challenges.
-
 Sales Campaign Icon Slide Ppt Powerpoint Presentation Diagram Graph Charts
Presenting this set of slides with name - Sales Campaign Icon Slide Ppt Powerpoint Presentation Diagram Graph Charts. This is a five stage process. The stages in this process are Business, Planning, Strategy, Marketing, Management.
-
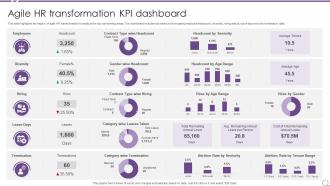 Agile HR Transformation KPI Dashboard Snapshot
This slide highlights the impact of agile HR transformation to analyze the key performing areas. The dashboard includes key metrics showcasing employee headcount, diversity, hiring status, leave days and the termination data. Introducing our Agile HR Transformation KPI Dashboard Snapshot set of slides. The topics discussed in these slides are Attrition Rate, Contract Type Wise Hiring, Category Wise Termination. This is an immediately available PowerPoint presentation that can be conveniently customized. Download it and convince your audience.
-
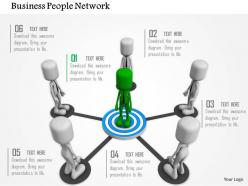 Target Achievement Network For Business Ppt Graphics Icons
We are proud to present our target achievement network for business ppt graphics icons. Concept of target achievement has been displayed in this PPT diagram. To show this concept we have used graphic of target board and team network. Use this PPT diagram for business and marketing presentations.
-
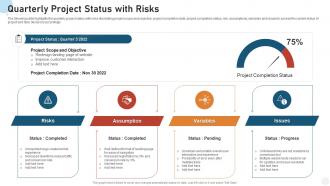 Quarterly project status with risks
Presenting our well structured Quarterly Project Status With Risks. The topics discussed in this slide are Risks, Assumption, Variables. This is an instantly available PowerPoint presentation that can be edited conveniently. Download it right away and captivate your audience.
-
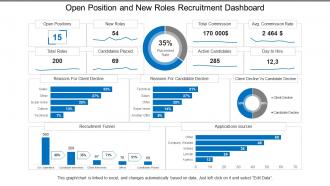 Open position and new roles recruitment dashboard
Presenting this set of slides with name - Open Position And New Roles Recruitment Dashboard. This is a three stage process. The stages in this process are Staffing Plan, Recruitment, Staff Management.
-
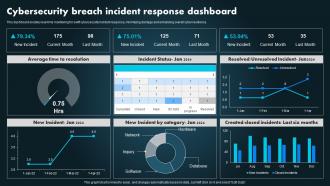 Cybersecurity Breach Incident Response Dashboard
This dashboard enables real-time monitoring for swift cybersecurity incident response, minimizing damage and enhancing overall cyber resilience. Presenting our well structured Cybersecurity Breach Incident Response Dashboard. The topics discussed in this slide are Cybersecurity Breach, Incident Response Dashboard, Overall Cyber Resilience. This is an instantly available PowerPoint presentation that can be edited conveniently. Download it right away and captivate your audience.
-
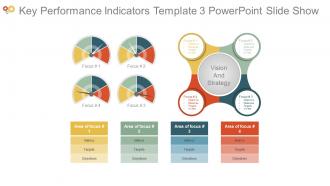 Key performance indicators template 3 powerpoint slide show
Presenting key performance indicators template 3 powerpoint slide show. Presenting key performance indicators template 3 powerpoint slide show. Presenting key performance indicators template 3 powerpoint slide show. This is a key performance indicators template 3 powerpoint slide show. This is four stage process. The stages in this process are area of focus, metrics, targets, objectives, vision and strategy, objective, measures, targets, invites.
-
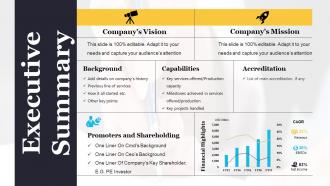 Executive summary example of ppt presentation
Presenting executive summary example PowerPoint Presentation. Elegant and simple visuals help you present your research in easy to understand, visual style. Presentation is downloaded in both widescreen (16:9) and standard screen (4:3) aspect ratio. Presentation template is compatible with Google slides. Fully editable in PowerPoint slideshow. Customize the font size, font color, graphic colors, and slide background without any hassle. The slides have text placeholders to enter your presentation content. PPT images with unaffected high resolution after editing any number of times.
-
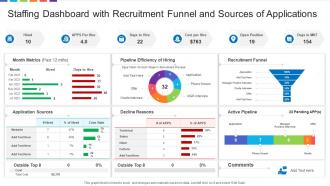 Staffing Dashboard Snapshot With Recruitment Funnel And Sources Of Applications
Presenting our well structured Staffing Dashboard Snapshot With Recruitment Funnel And Sources Of Applications. The topics discussed in this slide are Cost, Recruitment Funnel, Metrics. This is an instantly available PowerPoint presentation that can be edited conveniently. Download it right away and captivate your audience.
-
 Employee Orientation Preparation Orientation Integration Engagement Familiarizing
We bring to you to the point topic specific slides with apt research and understanding. Putting forth our PPT deck comprises of twelve slides. Our tailor made Employee Orientation Preparation Orientation Integration Engagement Familiarizing editable presentation deck assists planners to segment and expound the topic with brevity. The advantageous slides on Employee Orientation Preparation Orientation Integration Engagement Familiarizing is braced with multiple charts and graphs, overviews, analysis templates agenda slides etc. to help boost important aspects of your presentation. Highlight all sorts of related usable templates for important considerations. Our deck finds applicability amongst all kinds of professionals, managers, individuals, temporary permanent teams involved in any company organization from any field.
-
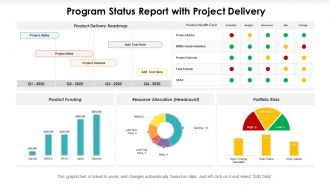 Program status report with project delivery
Presenting this set of slides with name Program Status Report With Project Delivery. The topics discussed in these slides are Roadmap, Resource, Portfolio. This is a completely editable PowerPoint presentation and is available for immediate download. Download now and impress your audience.
-
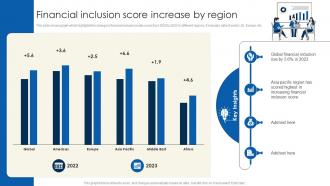 Financial Inclusion Score Financial Inclusion To Promote Economic Fin SS
This slide shows graph which highlights the change in financial inclusion index score from 2022 to 2023 in different regions. It includes data of world, US, Europe, etc. Deliver an outstanding presentation on the topic using this Financial Inclusion Score Financial Inclusion To Promote Economic Fin SS. Dispense information and present a thorough explanation of Global Financial Inclusion, Financial Inclusion Score, Key Insights using the slides given. This template can be altered and personalized to fit your needs. It is also available for immediate download. So grab it now.
-
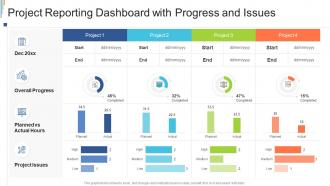 Project reporting dashboard with progress and issues
Introducing our Project Reporting Dashboard With Progress And Issues set of slides. The topics discussed in these slides are Project, Planned, Progress. This is an immediately available PowerPoint presentation that can be conveniently customized. Download it and convince your audience.
-
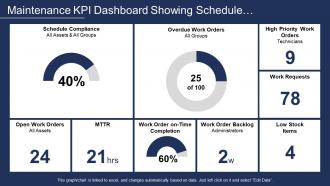 Maintenance kpi dashboard showing schedule compliance and mttr
Presenting this set of slides with name - Maintenance Kpi Dashboard Showing Schedule Compliance And Mttr. This is a nine stage process. The stages in this process are Maintenance, Preservation, Conservation.
-
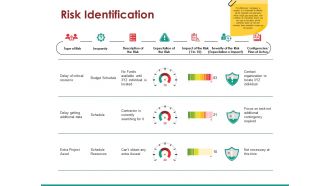 Risk identification ppt examples
Presenting this set of slides with name - Risk Identification Ppt Examples. This is a three stage process. The stages in this process are Type Of Risk, Jeopardy, Description Of The Risk, Expectation Of The Risk.
-
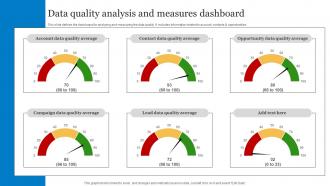 Data Quality Analysis And Measures Dashboard Snapshot
This slide defines the dashboard for analyzing and measuring the data quality. It includes information related to account, contacts and opportunities. Introducing our Data Quality Analysis And Measures Dashboard Snapshot set of slides. The topics discussed in these slides are Campaign Data, Quality Average, Opportunity Data. This is an immediately available PowerPoint presentation that can be conveniently customized. Download it and convince your audience.
-
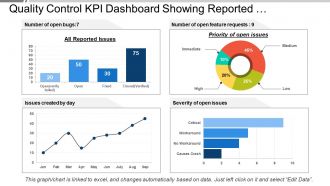 Quality control kpi dashboard showing reported issues and priority
Presenting this set of slides with name - Quality Control Kpi Dashboard Showing Reported Issues And Priority. This is a four stage process. The stages in this process are Quality Management, Quality Control, Quality Assurance.
-
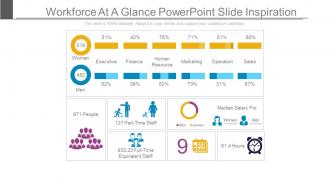 Workforce at a glance powerpoint slide inspiration
Presenting workforce at a glance powerpoint slide inspiration. This is a workforce at a glance powerpoint slide inspiration. This is a two stage process. The stages in this process are women, executive, finance, human resource, marketing, operation, sales, median salary for,part time staff,full time equivalent staff.
-
 Historical Growth Trend Of Marketing Technology Solutions Marketing Technology Stack Analysis
Mentioned slide provide information about global available marketing technologies growth over the years. It includes key components such as years of growth, number of marketing solutions, and key insights. Present the topic in a bit more detail with this Historical Growth Trend Of Marketing Technology Solutions Marketing Technology Stack Analysis Use it as a tool for discussion and navigation on Historical Growth Trend, Marketing Technology Solutions This template is free to edit as deemed fit for your organization. Therefore download it now.
-
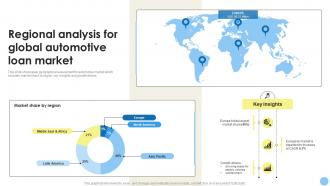 Regional Analysis For Global Automotive Loan Market Global Consumer CRP DK SS
This slide showcases geographical assessment for automotive market which includes market share by region, key insights and growth drivers. Deliver an outstanding presentation on the topic using this Regional Analysis For Global Automotive Loan Market Global Consumer CRP DK SS. Dispense information and present a thorough explanation of Market Share, Growth Drivers, Expected To Increase using the slides given. This template can be altered and personalized to fit your needs. It is also available for immediate download. So grab it now.
-
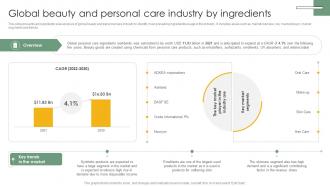 Global Beauty And Personal Cosmetic And Personal Care Market Trends Analysis IR SS V
This slide presents an ingredients wise analysis of global beauty and personal care industry to identify main prevailing ingredients usage in the industry. It includes areas such as market overview, key market player, market segments and trends. Present the topic in a bit more detail with this Global Beauty And Personal Cosmetic And Personal Care Market Trends Analysis IR SS V. Use it as a tool for discussion and navigation on Synthetic Products, Revenue Share, Skincare Segment. This template is free to edit as deemed fit for your organization. Therefore download it now.
-
 US Tobacco Market With Key Smoking Industry Report IR SS V
The slide highlights the US tobacco market with insights which further leverage them in taking strategic decisions. The slide covers the statistics for both. The slide covers market for smokeless tobacco market, cigars, NGP etc. Deliver an outstanding presentation on the topic using this US Tobacco Market With Key Smoking Industry Report IR SS V. Dispense information and present a thorough explanation of Tobacco Market, Novel Products, Customer Preferences using the slides given. This template can be altered and personalized to fit your needs. It is also available for immediate download. So grab it now.
-
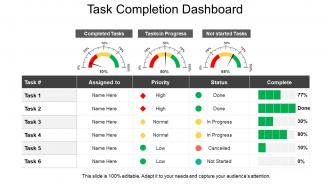 Task completion dashboard presentation examples
Presenting Task Completion Dashboard Presentation Examples. It is a professionally designed template with relevant visual content. Get easy access to the customizable slide. You can edit the color, and the font size of the slide. Background and the number of fields can be altered too. The slide is compatible with Google Slides and can be exported in PDF, JPEG or JPG formats. Avail it in standard screen and full-screen size.
-
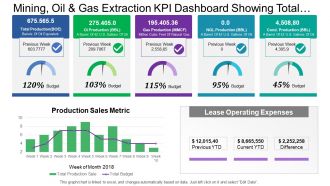 Mining oil and gas extraction kpi dashboard showing total production and budget
Presenting this set of slides with name - Mining Oil And Gas Extraction Kpi Dashboard Showing Total Production And Budget. This is a three stage process. The stages in this process are Mining, Oil And Gas Extraction, Refinery, Natural Gas.


