Charts, Graphs PowerPoint Designs, Presentation Charts Designs & PPT Graphics
- Sub Categories
-
- Arrows and Targets
- Bullet and Text Slides
- Charts and Graphs
- Circular Cycle Diagrams
- Concepts and Shapes
- Custom Flat Designs
- Dashboards and Measuring
- Flow Process
- Funnels
- Gears
- Growth
- Harvey Balls
- Idea Innovation and Light Bulbs
- Leadership
- Linear Process Diagrams
- Magnifying Glass
- Misc Other Graphics
- Opportunity and Handshake
- Organization Charts
- Puzzles
- Pyramids
- Roadmaps and Timelines
- Silhouettes
- Steps
- Strategic Planning Analysis
- SWOT Analysis
- Tables and Matrix
- Teamwork
- Technology and Communication
- Venn Diagrams
- Visuals and Illustrations
-
 Date Scheduler Global Financial Matters Checklist Report Ppt Icons Graphics
Presenting date scheduler global financial matters checklist report ppt icons graphics. This Power Point icon template diagram has been crafted with graphic of date scheduler, globe and checklist icons. This icon PPT diagram contains the concept of global financial matters analysis and checklist formation .Use this icon PPT for business and finance related presentations.
-
 Account receivable management dashboard snapshot with various kpis
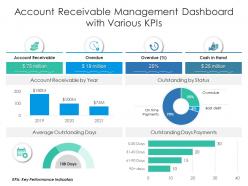
Introducing our Account Receivable Management Dashboard Snapshot With Various KPIs set of slides. The topics discussed in these slides are Account Receivable, Key Performance Indicators, Payments. This is an immediately available PowerPoint presentation that can be conveniently customized. Download it and convince your audience.
-
 Issue management dashboard for multiple projects
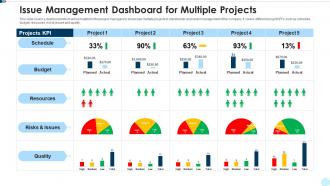
Introducing our Issue Management Dashboard For Multiple Projects set of slides. The topics discussed in these slides are Issue Management Dashboard For Multiple Projects. This is an immediately available PowerPoint presentation that can be conveniently customized. Download it and convince your audience.
-
 Real Time Dashboard For Change Impact Assessment
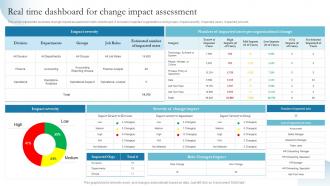
This slide represents business change impact assessment metric dashboard. It includes impacted organizations and groups, impact severity, impacted users, impacted jobs etc. Introducing our Real Time Dashboard For Change Impact Assessment set of slides. The topics discussed in these slides are Departments, Real Time Dashboard, Impact Assessment. This is an immediately available PowerPoint presentation that can be conveniently customized. Download it and convince your audience.
-
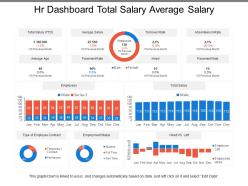 Hr dashboard total salary average salary
Presenting this set of slides with name - Hr Dashboard Total Salary Average Salary. This is a three stage process. The stages in this process are Hr Dashboard, Human Resource Dashboard, Hr Kpi.
-
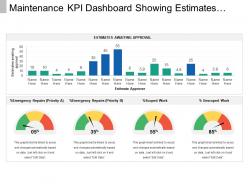 Maintenance kpi dashboard snapshot showing estimates awaiting approval
Presenting maintenance KPI dashboard snapshot showing estimates awaiting approval PPT slide. This layout is fully compatible with Google slides and data driven. User can edit the data in linked excel sheet and the design will change accordingly. Easy to put in company logo, trademark or name; accommodate words to support the key points. Images do no distort out even when they are projected on large screen. Adjust colors, text and fonts as per your business requirements.
-
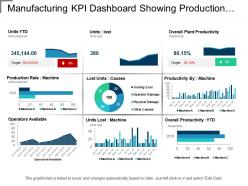 Manufacturing kpi dashboard showing production rate and lost units
Presenting manufacturing KPI dashboard showing production rate and lost units. This layout is compatible with Google slides and data can be updated with excel linked file. Easy to put in company logo, trademark or name; accommodate words to support the key points. Images do no blur out even when they are projected on large screen.PPT template can be utilized by sales and marketing teams and business managers. Instantly downloadable slide and supports formats like JPEG and PDF.
-
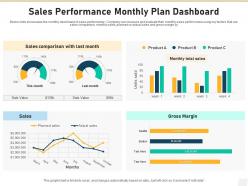 Sales Performance Monthly Plan Dashboard
Below slide showcases the monthly dashboard of sales performance. Company can measure and evaluate their monthly sales performance using key factors that are sales comparison, monthly sales, planned vs actual sales and gross margin by. Introducing our Sales Performance Monthly Plan Dashboard set of slides. The topics discussed in these slides are Sales Comparison, Gross Margin, Product. This is an immediately available PowerPoint presentation that can be conveniently customized. Download it and convince your audience.
-
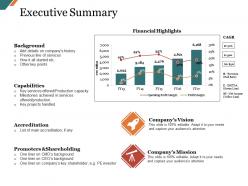 Executive summary ppt slide
Presenting this set of slides with name - Executive Summary Ppt Slide. This is a two stage process. The stages in this process are Background, Capabilities, Accreditation, Promoters And Shareholding, Company Vision.
-
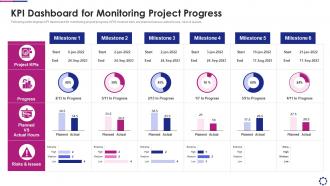 Kpi dashboard for monitoring project progress introducing devops pipeline within software
Following slide displays KPI dashboard for monitoring project progress. KPIS covered here are planned versus actual hours, risks and issues. Present the topic in a bit more detail with this KPI Dashboard For Monitoring Project Progress Introducing Devops Pipeline Within Software. Use it as a tool for discussion and navigation on KPI Dashboard For Monitoring Project Progress. This template is free to edit as deemed fit for your organization. Therefore download it now.
-
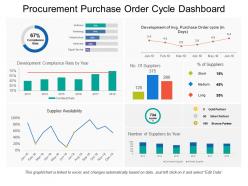 Procurement purchase order cycle dashboard
Presenting this set of slides with name - Procurement Purchase Order Cycle Dashboard. This is a seven stage process. The stages in this process are Purchase, Procurement, Buy.
-
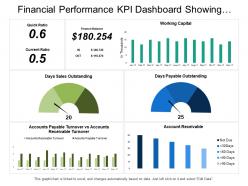 Financial performance kpi dashboard showing quick ratio current ratio working capital
Presenting this set of slides with name - Financial Performance Kpi Dashboard Showing Quick Ratio Current Ratio Working Capital. This is a three stage process. The stages in this process are Financial Performance, Financial Report, Financial Review.
-
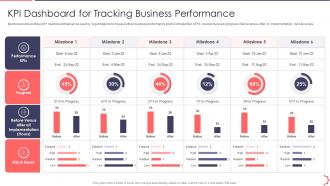 Kpi Dashboard For Tracking Business AI Playbook Accelerate Digital Transformation
Mentioned slide portrays KPI dashboard that can be used by organizations to measure their business performance post AI introduction. KPIS covered here are progress, Before versus After AI Implementation, risks and issues. Present the topic in a bit more detail with this Kpi Dashboard For Tracking Business AI Playbook Accelerate Digital Transformation . Use it as a tool for discussion and navigation on KPI Dashboard For Tracking Business Performance . This template is free to edit as deemed fit for your organization. Therefore download it now.
-
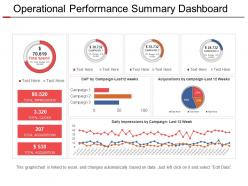 Operational performance summary dashboard presentation design
Presenting operational performance summary dashboard presentation design PowerPoint slide. This deck offers you plenty of space to put in titles and sub titles. High resolution-based layout does not change the image even after resizing. This presentation icon is fully compatible with Google slides. Quick downloading speed and simple editing options in color text and fonts.PPT icons can easily be changed into JPEG and PDF applications. This diagram has been designed for entrepreneurs, corporate and business managers. Easy to use, edit and you can design attractive slides within few minutes.
-
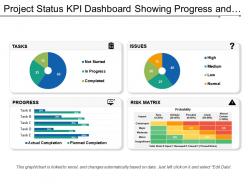 Project status kpi dashboard snapshot showing progress and risk matrix
Presenting project status KPI dashboard snapshot showing progress and risk matrix PowerPoint template. Simple data input like company logo, name or trademark. This PowerPoint theme is fully supported by Google slides. Picture quality of these slides does not change even when projected on large screen. This formats can be easily changed to JPEG and PDF applications. This template is suitable for marketing, sales persons, business managers and entrepreneurs. Adjust PPT layout, font, text and color as per your necessity
-
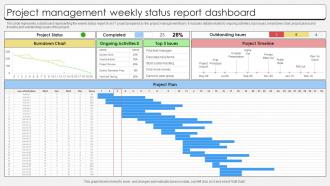 Project Management Weekly Status Report Dashboard
This slide represents a dashboard representing the weekly status report of an IT project prepared by the project management team. It includes details related to ongoing activities, top issues, breakdown chart, project plana and timeline and outstanding issues of the project. Presenting our well structured Project Management Weekly Status Report Dashboard. The topics discussed in this slide are Project Management, Weekly Status, Report Dashboard. This is an instantly available PowerPoint presentation that can be edited conveniently. Download it right away and captivate your audience.
-
 Financial statement powerpoint slide templates download
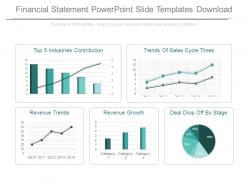
Presenting financial statement powerpoint slide templates download. This is a financial statement powerpoint slide templates download. This is a five stage process. The stages in this process are top 5 industries contribution, trends of sales cycle times, revenue trends, revenue growth, deal drop off by stage.
-
 Profitability Ratios To Measure The Organization Financial Planning And Analysis Best Practices
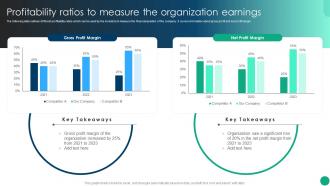
The following slide outlines different profitability ratios which can be used by the investors to measure the financial position of the company. It covers information about gross profit and net profit margin. Deliver an outstanding presentation on the topic using this Forecasting The Revenue And Growth Of Organization Financial Planning And Analysis Best Practices. Dispense information and present a thorough explanation of Profitability Ratios To Measure, The Organization Earnings using the slides given. This template can be altered and personalized to fit your needs. It is also available for immediate download. So grab it now.
-
 Executive Metrics Dashboard To Track Sales Performance
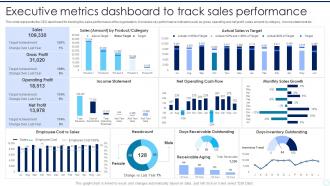
This slide represents the CEO dashboard for tracking the sales performance of the organization. It includes key performance indicators such as gross, operating and net profit, sales amount by category, income statement etc. Introducing our Executive Metrics Dashboard To Track Sales Performance set of slides. The topics discussed in these slides are Income Statement, Monthly Sales Growth, Headcount. This is an immediately available PowerPoint presentation that can be conveniently customized. Download it and convince your audience.
-
 Recruitment Marketing Recruitment Dashboard To Keep Track Of Employees
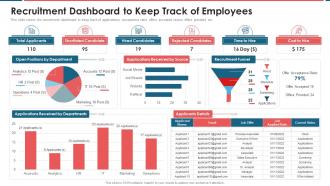
This slide covers the recruitment dashboard to keep track of applications, acceptance ratio, offers accepted versus offers provided etc. Deliver an outstanding presentation on the topic using this Recruitment Marketing Recruitment Dashboard To Keep Track Of Employees. Dispense information and present a thorough explanation of Recruitment, Dashboard, Applications using the slides given. This template can be altered and personalized to fit your needs. It is also available for immediate download. So grab it now.
-
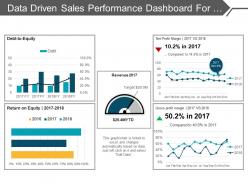 Data driven sales performance dashboard for achieving sales target ppt slides
Presenting a PPT slide named Data driven sales performance dashboard for achieving sales target PPT slides. This PPT slide is Excel driven and easily customizable. The font style, the font color and the font size can be easily edited by a mere click. Access this presentation easily anywhere as it is compatible with Google slides. You can convert and save this slide in PDF or JPG formats. Add or delete content from the given slide as per your convenience. You can add icons to make it more impressive. You can choose from thousands of high quality icons. Download and enjoy the professionally designed PPT slide.
-
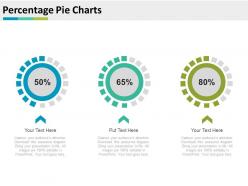 Percentage Pie Charts For Merger And Acquisitions Powerpoint Slides
Maintenance of overwhelming quality visuals all through the presentation. Compatible with wide screen yield. Can be satisfactorily used with any number of on the web and detached programming. The business slide outline is concordant with various courses of action decisions. Give it a more modified look with your association logo and name. Edit the PPT shape, tones, shade, substance and then some. Used by advancing guides, agents, advertisers, merchants, and business people.
-
 Procurement kpi dashboard dashboards by function
Present the topic in a bit more detail with this Procurement Kpi Dashboard Dashboards By Function. Use it as a tool for discussion and navigation on Procurement Kpi Dashboard. This template is free to edit as deemed fit for your organization. Therefore download it now.
-
 Performance Charts Side By Side Text Boxes In Line Powerpoint Diagram Templates Graphics 712
These high quality, editable pre-designed performance charts side by side text boxes in line powerpoint diagram templates graphics 712 powerpoint slides and powerpoint templates have been carefully created by our professional team to help you impress your audience. Each graphic in every powerpoint slide is vector based and is 100% editable in powerpoint.
-
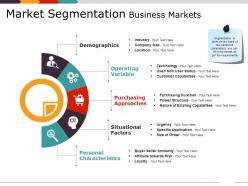 Market segmentation business markets ppt examples
Presenting Market Segmentation Business Markets PPT Examples PowerPoint slide. You can download and save this PowerPoint layout in different formats like PDF, PNG and JPG. This PPT theme is available in both 4:3 and 16:9 aspect ratios. As this PowerPoint template is 100% editable, you can modify color, font size, font type, and shapes as per your requirements. This PPT presentation is Google Slides compatible hence it is easily accessible.
-
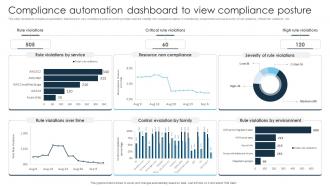 Compliance Automation Dashboard To View Compliance Posture
This slide represents compliance automation dashboard to view compliance posture which provides real time visibility into compliance status. It includes key components such as severity of rule violations, critical role violations, etc. Presenting our well structured Compliance Automation Dashboard To View Compliance Posture. The topics discussed in this slide are Compliance Automation Dashboard, View Compliance Posture, Critical Role Violations. This is an instantly available PowerPoint presentation that can be edited conveniently. Download it right away and captivate your audience.
-
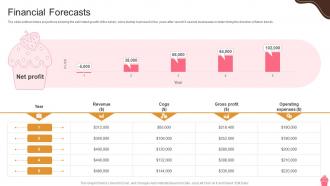 Financial Forecasts Bakery Store Start Up Go To Market Strategy GTM SS
The slide outlines future projections showing the estimated growth of the bakery store startup business for five years after launch It assists businesses in determining the direction of future trends. Deliver an outstanding presentation on the topic using this Financial Forecasts Bakery Store Start Up Go To Market Strategy GTM SS Dispense information and present a thorough explanation of Financial Forecasts using the slides given. This template can be altered and personalized to fit your needs. It is also available for immediate download. So grab it now.
-
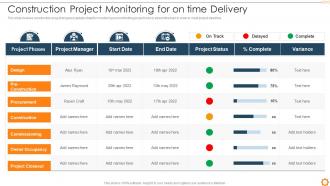 Risk Management Commercial Development Project Construction Project Monitoring Time Delivery
This slide involves construction project progress update sheet for monitoring and controlling project risks to streamline task in order to meet project deadline. Deliver an outstanding presentation on the topic using this Risk Management Commercial Development Project Construction Project Monitoring Time Delivery. Dispense information and present a thorough explanation of Construction, Commissioning, Owner Occupancy using the slides given. This template can be altered and personalized to fit your needs. It is also available for immediate download. So grab it now.
-
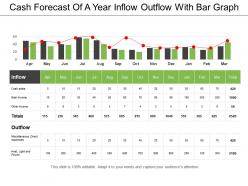 Cash forecast of a year inflow outflow with bar graph
Presenting cash forecast of a year inflow outflow with bar graph. This is a cash forecast of a year inflow outflow with bar graph. This is a two stage process. The stages in this process are cash forecast, cash flow, money forecast, fund forecast.
-
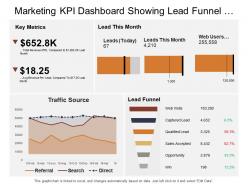 Marketing kpi dashboard snapshot showing lead funnel traffic sources key metrics
Presenting this set of slides with name - Marketing Kpi Dashboard Snapshot Showing Lead Funnel Traffic Sources Key Metrics. This is a three stage process. The stages in this process are Marketing, Branding, Promoting.
-
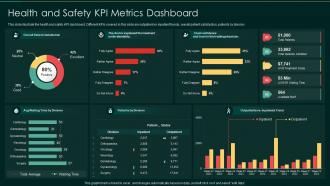 Health and safety kpi metrics dashboard
Presenting our well structured Health And Safety KPI Metrics Dashboard. The topics discussed in this slide are Health And Safety KPI Metrics Dashboard. This is an instantly available PowerPoint presentation that can be edited conveniently. Download it right away and captivate your audience.
-
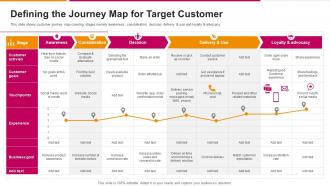 Defining The Journey Map For Target Customer Successful Sales Strategy To Launch
This slide shows customer journey map covering stages namely awareness, consideration, decision, delivery and use and loyalty and advocacy. Present the topic in a bit more detail with this Defining The Journey Map For Target Customer Successful Sales Strategy To Launch. Use it as a tool for discussion and navigation on Defining The Journey Map For Target Customer. This template is free to edit as deemed fit for your organization. Therefore download it now.
-
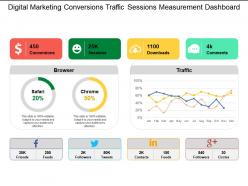 Digital marketing conversions traffic sessions measurement dashboard
Presenting digital marketing conversions traffic sessions measurement dashboard. This is a digital marketing conversions traffic sessions measurement dashboard. This is a four stage process. The stages in this process are digital marketing, digital marketing dashboard, digital marketing funnel.
-
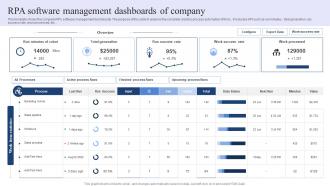 RPA Software Management Dashboards Of Company
This template shows the company RPA software management dashboards. The purpose of this slide to analysis the complete robotics process automation of firms . It includes KPI such as run minutes, total generation, run success rate, work processed, etc. Introducing our RPA Software Management Dashboards Of Company set of slides. The topics discussed in these slides are Generation, Rate, Work Success Rate. This is an immediately available PowerPoint presentation that can be conveniently customized. Download it and convince your audience.
-
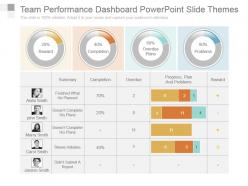 Team performance dashboard powerpoint slide themes
Presenting team performance dashboard powerpoint slide themes. This is a team performance dashboard powerpoint slide themes. This is a four stage process. The stages in this process are summary, completion, overdue, progress, plan and problems, reward, finished what he planned, doesnt complete his plans, doesnt complete his plans, shows initiative, didnt submit a report.
-
 Human resources kpi dashboard showing employee number by salary staff composition
Presenting this set of slides with name - Human Resources Kpi Dashboard Showing Employee Number By Salary Staff Composition. This is a four stage process. The stages in this process are Human Resource, Hrm, Human Capital.
-
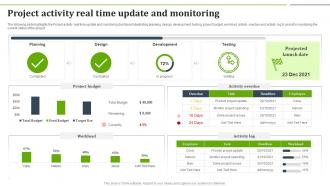 Project Activity Real Time Update And Monitoring
The following slide highlights the Project activity real time update and monitoring dashboard illustrating planning, design, development, testing, project budget, workload, activity overdue and activity log to assist in monitoring the current status of the project. Introducing our Project Activity Real Time Update And Monitoring set of slides. The topics discussed in these slides are Planning, Design, Development, Testing. This is an immediately available PowerPoint presentation that can be conveniently customized. Download it and convince your audience.
-
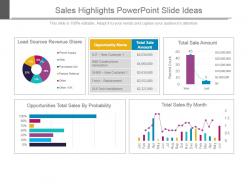 Sales highlights powerpoint slide ideas
Presenting sales highlights powerpoint slide ideas. This is a sales highlights powerpoint slide ideas. This is a five stage process. The stages in this process are lead sources revenue share, opportunity name, total sale amount, total sale amount, opportunities total sales by probability, total sales by month.
-
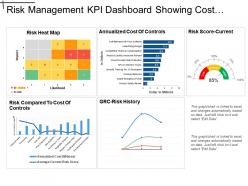 Risk Management Kpi Dashboard Showing Cost Of Control And Risk Score
Presenting this set of slides with name - Risk Management Kpi Dashboard Showing Cost Of Control And Risk Score. This is a five stage process. The stages in this process are Risk Management, Risk Assessment, Project Risk.
-
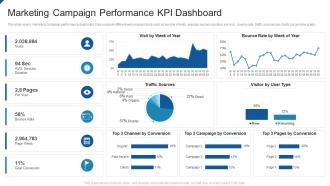 Marketing campaign performance kpi dashboard
Presenting our well structured Marketing Campaign Performance KPI Dashboard. The topics discussed in this slide are Marketing Campaign Performance Kpi Dashboard. This is an instantly available PowerPoint presentation that can be edited conveniently. Download it right away and captivate your audience.
-
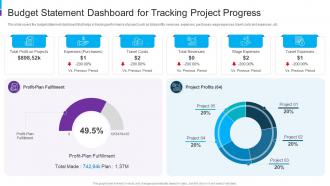 Budget Statement Dashboard For Tracking Project Progress
This slide covers the budget statement dashboard that helps in tracking performance of project such as total profits, revenues, expenses, purchases, wage expenses, travel costs and expenses , etc. Presenting our well structured Budget Statement Dashboard For Tracking Project Progress. The topics discussed in this slide are Profit Plan Fulfilment, Project Profits, Travel Costs, Total Revenues, Wage Expenses, Travel Expenses. This is an instantly available PowerPoint presentation that can be edited conveniently. Download it right away and captivate your audience.
-
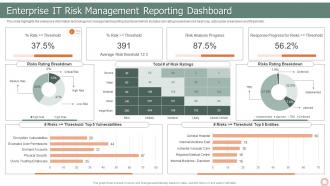 IT Risk Management Strategies Enterprise IT Risk Management Reporting Dashboard
This slide highlights the enterprise information technology risk management reporting dashboard which includes risk rating breakdown risk heat map, action plan breakdown and thresholds. Deliver an outstanding presentation on the topic using this IT Risk Management Strategies Enterprise IT Risk Management Reporting Dashboard. Dispense information and present a thorough explanation of Overspend Project Budget, Data Breach 2021, Key Risks using the slides given. This template can be altered and personalized to fit your needs. It is also available for immediate download. So grab it now.
-
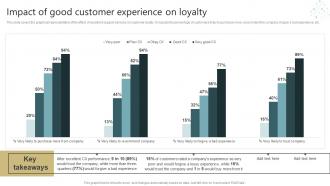 Conducting Successful Customer Impact Of Good Customer Experience On Loyalty
This slide covers the graphical representation of the effect of excellent support services on customer loyalty. It impacts the percentage of customers likely to purchase more, recommend the company, forgive a bad experience, etc. Present the topic in a bit more detail with this Conducting Successful Customer Impact Of Good Customer Experience On Loyalty. Use it as a tool for discussion and navigation on Performance, Experience. This template is free to edit as deemed fit for your organization. Therefore download it now.
-
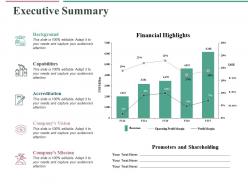 Executive summary ppt professional display
Presenting this set of slides with name - Executive Summary Ppt Professional Display. This is a five stage process. The stages in this process are Bar Chart, Marketing, Strategy, Planning, Finance.
-
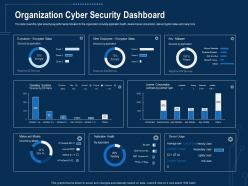 Corporate data security awareness organization cyber security dashboard ppt powerpoint guidelines
This slide covers the cyber security key performance indicators for the organization including application health, device license consumption, data encryption status and many more. Deliver an outstanding presentation on the topic using this Corporate Data Security Awareness Organization Cyber Security Dashboard Ppt Powerpoint Guidelines. Dispense information and present a thorough explanation of Executives, License Consumption, Operating Systems using the slides given. This template can be altered and personalized to fit your needs. It is also available for immediate download. So grab it now.
-
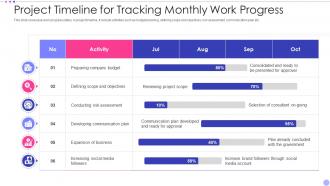 Project Timeline For Tracking Monthly Work Progress
This slide showcase work progress status in project timeline. It include activities such as budget planning, defining scope and objectives, risk assessment, communication plan etc. Presenting our well structured Project Timeline For Tracking Monthly Work Progress. The topics discussed in this slide are Budget, Developing, Business. This is an instantly available PowerPoint presentation that can be edited conveniently. Download it right away and captivate your audience.
-
 Bank Safe Debit Credit Card Calendar Ppt Icons Graphics
Presenting bank safe debit credit card calendar ppt icons graphics. This Power Point icon template diagram has been crafted with graphic of bank, safe and debit card icons. This icon PPT diagram contains the concept of financial management. Use this icon PPT for business and finance related presentations.
-
 Revenue Stream Cisco Investor Funding Elevator Pitch Deck
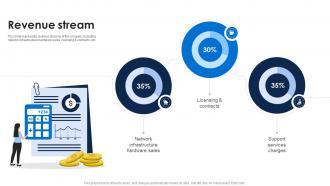
This slide represents revenue streams of the company including network infrastructure hardware sales, licensing and contracts, etc. Present the topic in a bit more detail with this Revenue Stream Cisco Investor Funding Elevator Pitch Deck Use it as a tool for discussion and navigation on Network Infrastructure, Sales, Licensing This template is free to edit as deemed fit for your organization. Therefore download it now.
-
 Performance Appraisal Software Tool Clearcompany Understanding Performance Appraisal A Key To Organizational
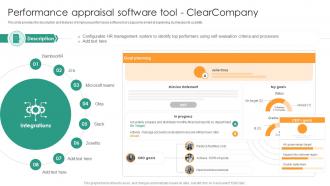
This slide provides the description and features of employee performance software tool Leapsome aimed at explaining businesses its usability. Increase audience engagement and knowledge by dispensing information using Performance Appraisal Software Tool Clearcompany Understanding Performance Appraisal A Key To Organizational. This template helps you present information on eight stages. You can also present information on Performance Appraisal, Software Tool, Clearcompany using this PPT design. This layout is completely editable so personaize it now to meet your audiences expectations.
-
 Agile project status dashboard with story details summary ppt professional
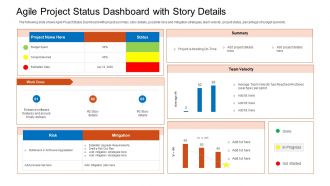
The following slide shows Agile Project Status Dashboard with project summary, story details, possible risks and mitigation strategies, team velocity, project status, percentage of budget spent etc. Deliver an outstanding presentation on the topic using this Agile Project Status Dashboard With Story Details Summary Ppt Professional. Dispense information and present a thorough explanation of Project Is Trending, Bottleneck In Software Upgradation, Establish Upgrade Requirements using the slides given. This template can be altered and personalized to fit your needs. It is also available for immediate download. So grab it now.
-
 Profit and loss waterfall chart ppt infographic template
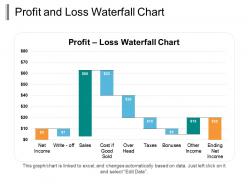
Presenting the Profit And Loss Waterfall Chart PPT Infographic Template. You can edit this template in PowerPoint. The PPT layout is customizable. You can link the slide to your excel sheet and the graph will change accordingly. The slide is available in both standard and wide screen formats. You can change the colors of the chart and bars and the background as well to suit your needs. So go ahead and make your presentation with a few clicks.
-
 Sliding scale for business report powerpoint show
Presenting sliding scale for business report powerpoint show. This is a sliding scale for business report powerpoint show. This is a five stage process. The stages in this process are business, scale, process, strategy, management.
-
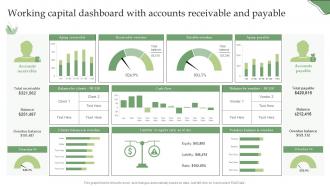 Working Capital Dashboard With Accounts Receivable And Payable
Presenting our well-structured Working Capital Dashboard With Accounts Receivable And Payable. The topics discussed in this slide are Aging Receivable, Receivable Overdue, Payable Overdue, Aging Payable. This is an instantly available PowerPoint presentation that can be edited conveniently. Download it right away and captivate your audience.
-
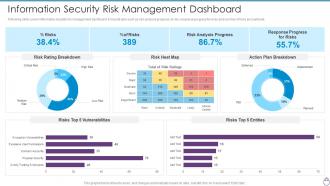 Cybersecurity Risk Management Framework Information Security Risk Management Dashboard
Following slide covers information security risk management dashboard. It include kpis such as risk analysis progress, percent risk, response progress for risks and number of risks encountered. Deliver an outstanding presentation on the topic using this Cybersecurity Risk Management Framework Information Security Risk Management Dashboard. Dispense information and present a thorough explanation of Risk Rating Breakdown, Risk Heat Map, Action Plan Breakdown, Risks Top 5 Vulnerabilities, Risks Top 5 Entities using the slides given. This template can be altered and personalized to fit your needs. It is also available for immediate download. So grab it now.
-
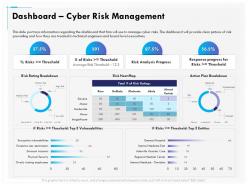 Dashboard Cyber Risk Management Breakdown Ppt Infographics
This slide portrays information regarding the dashboard that firm will use to manage cyber risks. The dashboard will provide clear picture of risk prevailing and how they are treated to technical engineers and board level executives. Presenting this set of slides with name Dashboard Cyber Risk Management Breakdown Ppt Infographics. The topics discussed in these slides are Dashboard Cyber Risk Management. This is a completely editable PowerPoint presentation and is available for immediate download. Download now and impress your audience.
-
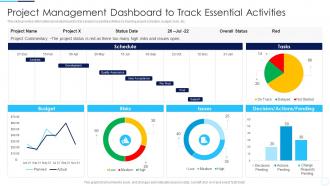 Project Management Dashboard Coordination Activities Successful Project
Project Commentary The project status is red as there too many high risks and issues open. Present the topic in a bit more detail with this Project Management Dashboard Coordination Activities Successful Project. Use it as a tool for discussion and navigation on Analysis, Development, Quality Assurance. This template is free to edit as deemed fit for your organization. Therefore download it now.
-
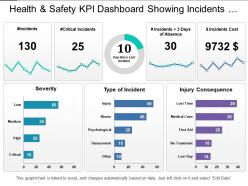 Health and safety kpi dashboard showing incidents severity and consequences
Presenting the health and safety PPT slide. This PPT slide is fully editable and is designed by professionals looking for a professional presentation. You can edit the objects in the slide like font size and font color easily. This presentation slide is fully compatible with Google Slide and can be saved in JPG or PDF file format easily. Click on the download button below.
-
 Contact center software market industry overview ppt guidelines
This slide shows some of the global market trends of Contact Center Software Market Industry worldwide. The slide shows the global Contact Center Software Market growth rate CAGR, fastest growing market and largest market, trends that drive market growth, major industry players etc. Present the topic in a bit more detail with this Contact Center Software Market Industry Overview Ppt Guidelines. Use it as a tool for discussion and navigation on Contact Center Software Market Industry Overview. This template is free to edit as deemed fit for your organization. Therefore download it now.
-
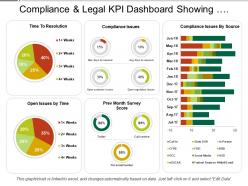 Compliance and legal kpi dashboard showing compliance issues and resolution time
Presenting this set of slides with name - Compliance And Legal Kpi Dashboard Showing Compliance Issues And Resolution Time. This is a three stage process. The stages in this process are Compliance And Legal, Legal Governance, Risk Management.
-
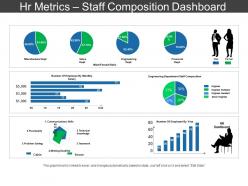 Hr metrics staff composition dashboard sample ppt files
Presenting HR Metrics Staff Composition Dashboard Sample PPT Files which is completely editable. You can open and save your presentation in various formats like PDF, JPG, and PNG. Freely access this template in both 4:3 and 16:9 aspect ratio. Change the color, font, font size, and font type of the slides as per your requirements. This template is adaptable with Google Slides which makes it easily accessible at once.


