Charts, Graphs PowerPoint Designs, Presentation Charts Designs & PPT Graphics
- Sub Categories
-
- Arrows and Targets
- Bullet and Text Slides
- Charts and Graphs
- Circular Cycle Diagrams
- Concepts and Shapes
- Custom Flat Designs
- Dashboards and Measuring
- Flow Process
- Funnels
- Gears
- Growth
- Harvey Balls
- Idea Innovation and Light Bulbs
- Leadership
- Linear Process Diagrams
- Magnifying Glass
- Misc Other Graphics
- Opportunity and Handshake
- Organization Charts
- Puzzles
- Pyramids
- Roadmaps and Timelines
- Silhouettes
- Steps
- Strategic Planning Analysis
- SWOT Analysis
- Tables and Matrix
- Teamwork
- Technology and Communication
- Venn Diagrams
- Visuals and Illustrations
-
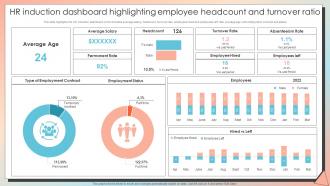 New Employee Induction HR Induction Dashboard Highlighting Employee
This slide highlights the HR induction dashboard which includes average salary, headcount, turnover rate, employees hired and employees left rate, average age with employment contract and status.Present the topic in a bit more detail with this New Employee Induction HR Induction Dashboard Highlighting Employee. Use it as a tool for discussion and navigation on Permanent Rate, Absenteeism Rate, Turnover Rate. This template is free to edit as deemed fit for your organization. Therefore download it now.
-
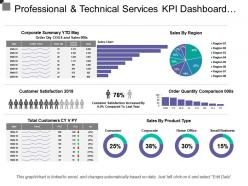 Professional and technical services kpi dashboard showing sales by region
Presenting this set of slides with name - Professional And Technical Services Kpi Dashboard Showing Sales By Region. This is a three stage process. The stages in this process are Professional And Technical Services, Services Management, Technical Management.
-
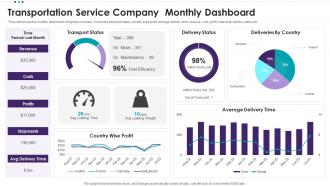 Transportation Service Company Monthly Dashboard
This slide shows the monthly dashboard of logistics company. It includes transport status, country wise profit, average delivery time, revenue, cost, profit, shipment, delivery status etc. Presenting our well structured Transportation Service Company Monthly Dashboard. The topics discussed in this slide are Transport Status, Delivery Status, Deliveries By Country, Average Delivery Time, Country Wise Profit. This is an instantly available PowerPoint presentation that can be edited conveniently. Download it right away and captivate your audience.
-
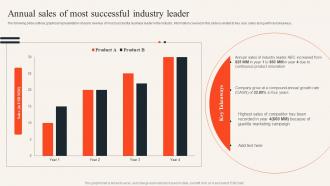 Annual Sales Of Most Successful Industry Leader Uncovering Consumer Trends Through Market Research Mkt Ss
The following slide outlines graphical representation of yearly revenue of most successful business leader in the industry. Information covered in this slide is related to four year sales along with key takeaways. Deliver an outstanding presentation on the topic using this Annual Sales Of Most Successful Industry Leader Uncovering Consumer Trends Through Market Research Mkt Ss. Dispense information and present a thorough explanation of Successful, Product, Innovation using the slides given. This template can be altered and personalized to fit your needs. It is also available for immediate download. So grab it now.
-
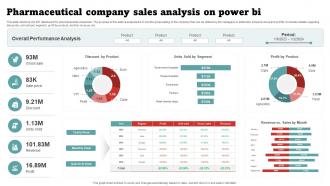 Pharmaceutical Company Sales Analysis On Power BI
This slide mentions the KPI dashboard for pharmaceutical companies. The purpose of this slide is analysis the 6 months gross selling of the company that can be utilized by the managers to determine actual revenue and profits. It includes details regarding discounts, unit sold per segment, profit by product, monthly revenue, etc.Presenting our well structured Pharmaceutical Company Sales Analysis On Power BI. The topics discussed in this slide are Discount Product, Overall Performance Analysis, Profit Product. This is an instantly available PowerPoint presentation that can be edited conveniently. Download it right away and captivate your audience.
-
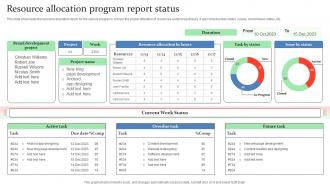 Resource Allocation Program Report Status
This slide showcases the resource allocation report for the various programs to track the proper utilization of resources under project tasks. It also inlcudes task status, issues, current week status, etc. Introducing our Resource Allocation Program Report Status set of slides. The topics discussed in these slides are Brand Development Project, Current Week Status. This is an immediately available PowerPoint presentation that can be conveniently customized. Download it and convince your audience.
-
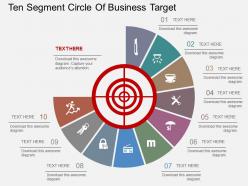 Hz ten segment circle of business target flat powerpoint design
Presenting hz ten segment circle of business target flat powerpoint design. This Power Point template diagram has been crafted with graphic of ten segment circle diagram. This PPT diagram contains the concept of business target achievement. Use this PPT diagram for business and marketing related presentations.
-
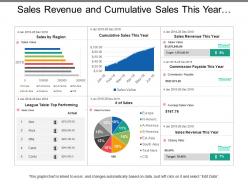 Sales revenue and cumulative sales this year dashboards
Presenting this set of slides with name - Sales Revenue And Cumulative Sales This Year Dashboards. Completely amendable presentation design as some elements are editable. Ease to personalize the slide with your company name, logo and even tag line. PowerPoint slide can be downloaded easily and transform into JPG and PDF format. More designs can be accessed with different nodes and stages. PPT diagram can be projected in standard and widescreen view. Great use of colors and innovatively designed. PPT template is compatible with Google slides.
-
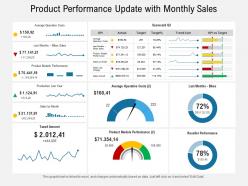 Product performance update with monthly sales
Presenting this set of slides with name Product Performance Update With Monthly Sales. The topics discussed in these slides are Costs, Sales, Performance. This is a completely editable PowerPoint presentation and is available for immediate download. Download now and impress your audience.
-
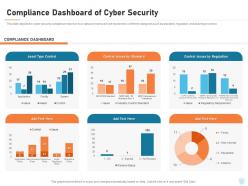 Cyber security it compliance dashboard Snapshot of cyber security ppt powerpoint show gallery
This slide depicts the cyber security compliance report on how data and hardware are monitored in different categories such as standard, regulation, and asset type control. Deliver an outstanding presentation on the topic using this Cyber Security IT Compliance Dashboard Snapshot Of Cyber Security Ppt Powerpoint Show Gallery. Dispense information and present a thorough explanation of Asset Type Control, Control Issues By Standard, Control Issues By Regulation using the slides given. This template can be altered and personalized to fit your needs. It is also available for immediate download. So grab it now.
-
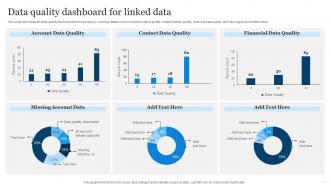 Linked Open Data Data Quality Dashboard For Linked Data Ppt Powerpoint Presentation Slides Tips
This slide describes the data quality dashboard for linked data by covering details of account information quality, contact details quality, financial data quality, and missing account information. Present the topic in a bit more detail with this Linked Open Data Data Quality Dashboard For Linked Data Ppt Powerpoint Presentation Slides Tips. Use it as a tool for discussion and navigation on Account Data Quality, Contact Data Quality, Financial Data Quality. This template is free to edit as deemed fit for your organization. Therefore download it now.
-
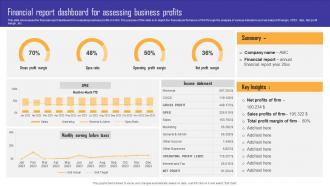 Financial Report Dashboard For Assessing Business Profits
This slide showcases the financial report dashboard for evaluating business profits of a firm. The purpose of this slide is to depict the financial performance of firm through the analysis of various indicators such as total profit margin, OPEX ratio, Net profit margin, etc. Introducing our Financial Report Dashboard For Assessing Business Profits set of slides. The topics discussed in these slides are Financial, Dashboard, Business. This is an immediately available PowerPoint presentation that can be conveniently customized. Download it and convince your audience.
-
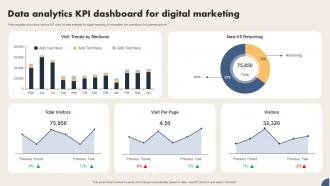 Data Analytics Kpi Dashboard For Digital Marketing
Following slide shows the various KPI used for data analysis for digital marketing to streamline the operations for business growth Introducing our Data Analytics Kpi Dashboard For Digital Marketing set of slides. The topics discussed in these slides are Visit Trends By Mediums, New Vs Returning This is an immediately available PowerPoint presentation that can be conveniently customized. Download it and convince your audience.
-
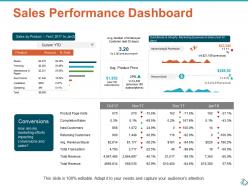 Sales performance dashboard ppt show infographic template
Presenting this set of slides with name - Sales Performance Dashboard Ppt Show Infographic Template. This is a four stage process. The stages in this process are Business, Planning, Strategy, Marketing, Management.
-
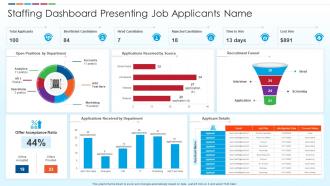 Staffing Dashboard Presenting Job Applicants Name
Introducing our Staffing Dashboard Presenting Job Applicants Name set of slides. The topics discussed in these slides are Recruitment Funnel, Source, Applications. This is an immediately available PowerPoint presentation that can be conveniently customized. Download it and convince your audience.
-
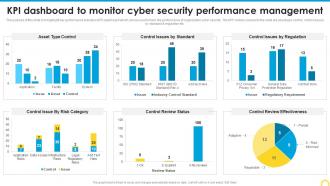 Kpi Dashboard To Monitor Cyber Building A Security Awareness Program
The purpose of this slide is to highlight key performance indicator KPI dashboard which can be used to track the performance of organization cyber security. The KPI metrics covered in the slide are asset type control, control issues by standard and regulation etc. Deliver an outstanding presentation on the topic using this KPI Dashboard To Monitor Cyber Building A Security Awareness Program. Dispense information and present a thorough explanation of Control Review Effectiveness, Performance Management using the slides given. This template can be altered and personalized to fit your needs. It is also available for immediate download. So grab it now.
-
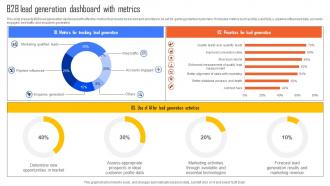 B2B Lead Generation Dashboard With Metrics
This slide presents B2B lead generation dashboard with effective metrics that should be tracked and priorities to be set for gaining potential customers. It includes metrics such as MQLs and SQLs, pipeline influenced data, accounts engaged, web traffic and enquiries generated. Introducing our B2B Lead Generation Dashboard With Metrics set of slides. The topics discussed in these slides are Metrics For Tracking, Lead Generation, Priorities For Lead Generation. This is an immediately available PowerPoint presentation that can be conveniently customized. Download it and convince your audience.
-
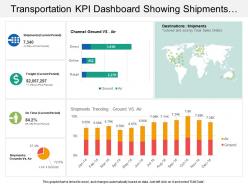 Transportation kpi dashboard snapshot showing shipments ground vs air channel
Presenting our transportation KPI dashboard snapshot showing shipments ground vs. air channel PPT slide. This layout is compatible with Google slides and data can be updated with excel linked file. This template is Excel linked just right click to input your information. Images do no blur out even when they are projected on large screen.PPT template can be utilized by sales and marketing teams and business managers. Instantly downloadable slide and supports formats like JPEG and PDF.
-
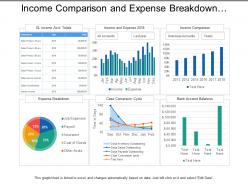 Income comparison and expense breakdown utilities dashboard
Presenting this set of slides with name - Income Comparison And Expense Breakdown Utilities Dashboard. This is a six stage process. The stages in this process are Utilities, Use, Advantage.
-
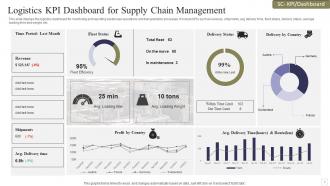 Logistics KPI Dashboard Snapshot For Supply Chain Management
This slide displays the logistics dashboard for monitoring and reporting warehouse operations and transportation processes. It include KPIs such as revenue, shipments, avg delivery time, fleet status, delivery status, average loading time and weight, etc. Presenting our well structured Logistics KPI Dashboard Snapshot For Supply Chain Management. The topics discussed in this slide are Logistics KPI Dashboard, Supply Chain Management, Revenue. This is an instantly available PowerPoint presentation that can be edited conveniently. Download it right away and captivate your audience.
-
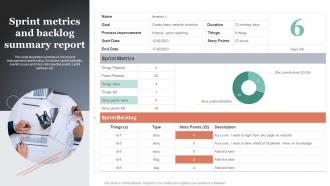 Sprint Metrics And Backlog Summary Report
This slide illustrates summary of Jira project management sprint testing. It includes sprint highlights, overall issues and risks, retrospective points, sprint spillover, etc. Introducing our Sprint Metrics And Backlog Summary Report set of slides. The topics discussed in these slides are Sprint Metrics, Summary Report. This is an immediately available PowerPoint presentation that can be conveniently customized. Download it and convince your audience.
-
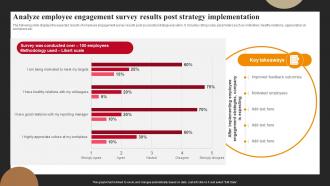 Analyze Employee Engagement Survey Results Post Successful Employee Engagement Action Planning
The following slide displays the expected results of employee engagement survey results post successful strategy execution. It includes rating scale, parameters such as motivation, healthy relations, appreciation at workplace etc. Present the topic in a bit more detail with this Analyze Employee Engagement Survey Results Post Successful Employee Engagement Action Planning. Use it as a tool for discussion and navigation on Strategy, Implementation, Engagement. This template is free to edit as deemed fit for your organization. Therefore download it now.
-
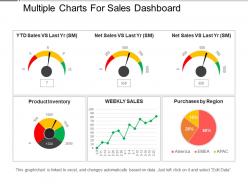 Multiple charts for sales dashboard snapshot presentation pictures
Presenting multiple charts for sales dashboard PPT image. Incredibly amicable PPT design entirely useful for Sales professionals and experts. Comprehensive and convenient PPT Image with ductile dummy data options with an alternative to add company name, design, or symbol. Consonant with all available graphic softwares and Google Slides. Totally accessible into other file configurations like PDF or JPG. Features as background images, styles, texts, and other characteristics are fully editable. Expeditious downloading process.
-
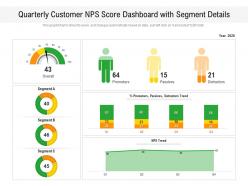 Quarterly customer nps score dashboard with segment details
Presenting this set of slides with name Quarterly Customer NPS Score Dashboard With Segment Details. The topics discussed in these slides are Quarterly Customer NPS Score Dashboard With Segment Details. This is a completely editable PowerPoint presentation and is available for immediate download. Download now and impress your audience.
-
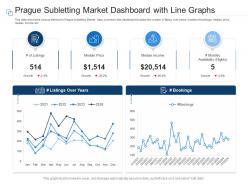 Prague subletting market dashboard with line graphs powerpoint template
This slide shows the various Metrics for Prague Subletting Market. Data covered in this dashboard includes the number of listing over years, number of bookings, median price, median income etc. This is a Prague Subletting Market Dashboard With Line Graphs Powerpoint Template drafted with a diverse set of graphics, that can be reformulated and edited as per your needs and requirements. Just download it in your system and make use of it in PowerPoint or Google Slides, depending upon your presentation preferences.
-
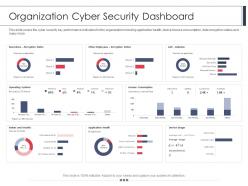 Employee security awareness training program organization cyber security dashboard ppt layout
This slide covers the cyber security key performance indicators for the organization including application health, device license consumption, data encryption status and many more. Deliver an outstanding presentation on the topic using this Employee Security Awareness Training Program Organization Cyber Security Dashboard Ppt Layout. Dispense information and present a thorough explanation of Operating Systems, Makes And Models, Application Health, Device Usage, Average Usage using the slides given. This template can be altered and personalized to fit your needs. It is also available for immediate download. So grab it now.
-
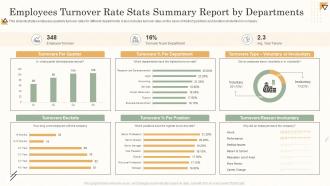 Employees Turnover Rate Stats Summary Report By Departments
This slide illustrates employees quarterly turnover rates for different departments. It also includes turnover rates on the basis of distinct positions and duration of retention in company. Presenting our well structured Employees Turnover Rate Stats Summary Report By Departments. The topics discussed in this slide are Employees Turnover, Rate Stats Summary, Report By Departments. This is an instantly available PowerPoint presentation that can be edited conveniently. Download it right away and captivate your audience.
-
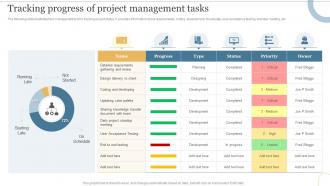 Tracking Progress Of Project Management Tasks Deploying Cloud To Manage
The following slide illustrates task management tool for tracking project status. It provides information about requirements, coding, development, knowledge, user acceptance testing, standup meeting, etc.Deliver an outstanding presentation on the topic using this Tracking Progress Of Project Management Tasks Deploying Cloud To Manage. Dispense information and present a thorough explanation of Detailed Requirements, Acceptance Testing, Development using the slides given. This template can be altered and personalized to fit your needs. It is also available for immediate download. So grab it now.
-
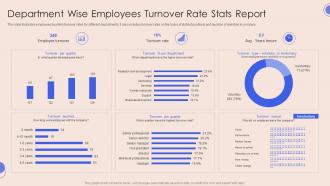 Department Wise Employees Turnover Rate Stats Report
This slide illustrates employees quarterly turnover rates for different departments. It also includes turnover rates on the basis of distinct positions and duration of retention in company. Presenting our well structured Department Wise Employees Turnover Rate Stats Report. The topics discussed in this slide are Turnover Per Quarter, Turnover Buckets, Turnover Reason. This is an instantly available PowerPoint presentation that can be edited conveniently. Download it right away and captivate your audience.
-
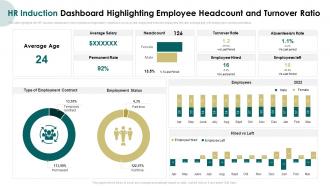 HR Induction Dashboard Highlighting Induction Program For New Employees
This slide highlights the HR induction dashboard which includes average salary, headcount, turnover rate, employees hired and employees left rate, average age with employment contract and status. Present the topic in a bit more detail with this HR Induction Dashboard Highlighting Induction Program For New Employees. Use it as a tool for discussion and navigation on Average Salary, Turnover Rate, Absenteeism Rate. This template is free to edit as deemed fit for your organization. Therefore download it now.
-
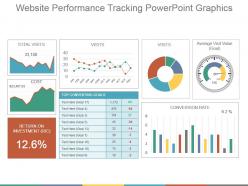 Website performance tracking powerpoint graphics
Presenting website performance tracking powerpoint graphics. This is a website performance tracking powerpoint graphics. This is a three stage process. The stages in this process are total visits, conversion rate, return on investment, average visit value.
-
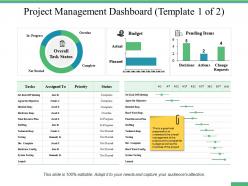 Project management dashboard snapshot ppt professional example introduction
Presenting this set of slides with name - Project Management Dashboard Snapshot Ppt Professional Example Introduction. This is a three stage process. The stages in this process are Percentage, Product, Management, Marketing, Business.
-
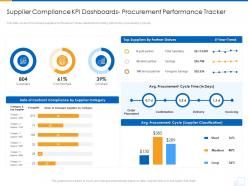 Supplier compliance kpi dashboards snapshot procurement performance tracker supplier strategy
This slide covers Procurement suppliers Performance Tracker dashboard Snapshot including metrics like procurement cycle etc. Present the topic in a bit more detail with this Supplier Compliance Kpi Dashboards Procurement Performance Tracker Supplier Strategy. Use it as a tool for discussion and navigation on Supplier Compliance Kpi Dashboards Procurement Performance Tracker. This template is free to edit as deemed fit for your organization. Therefore download it now.
-
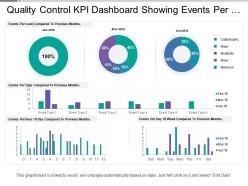 Quality control kpi dashboard showing events per hour and day
Presenting this set of slides with name - Quality Control Kpi Dashboard Showing Events Per Hour And Day. This is a four stage process. The stages in this process are Quality Management, Quality Control, Quality Assurance.
-
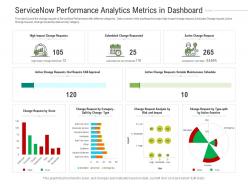 Servicenow performance analytics metrics in dashboard powerpoint template
This slide Covers the change request of ServiceNow Performance with different categories . Data covered in this dashboard includes-High Impact change request, Schedules Change request, Active Change request, Change request by state and by category. This is Servicenow Performance Analytics Metrics In Dashboard Powerpoint Template with high quality vector based graphics, that can be edited as per your business needs. You can also reproduce this slide in various formats, be it PNG, JPG, etc. This slide also comes with an additional feature of portrayal on standard and widescreen aspect ratios, thus retaining its high quality.
-
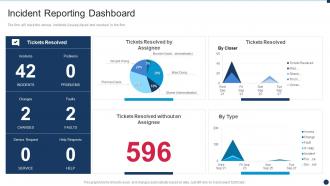 Incident Reporting Dashboard Snapshot Vulnerability Administration At Workplace
The firm will track the various incidents issues faced and resolved in the firm. Deliver an outstanding presentation on the topic using this Incident Reporting Dashboard Snapshot Vulnerability Administration At Workplace. Dispense information and present a thorough explanation of Incident Reporting Dashboard using the slides given. This template can be altered and personalized to fit your needs. It is also available for immediate download. So grab it now.
-
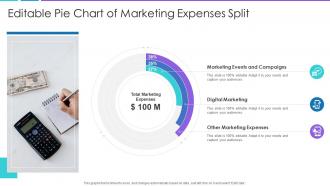 Editable Pie Chart Of Marketing Expenses Split
Introducing our Editable Pie Chart Of Marketing Expenses Split set of slides. The topics discussed in these slides are Marketing Events And Campaigns, Digital Marketing, Other Marketing Expenses. This is an immediately available PowerPoint presentation that can be conveniently customized. Download it and convince your audience.
-
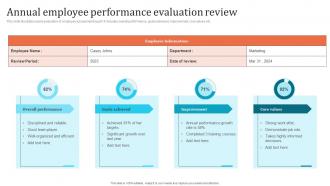 Annual Employee Performance Evaluation Review
This slide illustrates yearly evaluation of employee assessment report. It includes overall performance, goals achieved, improvement, core values etc. Presenting our well structured Annual Employee Performance Evaluation Review. The topics discussed in this slide are Goals Achieved, Core Values. This is an instantly available PowerPoint presentation that can be edited conveniently. Download it right away and captivate your audience.
-
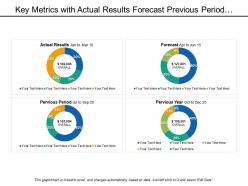 Key metrics with actual results forecast previous period and year
Presenting this set of slides with name - Key Metrics With Actual Results Forecast Previous Period And Year. This is a four stage process. The stages in this process are Key Metrics, Key Performance Indicator, Kpi.
-
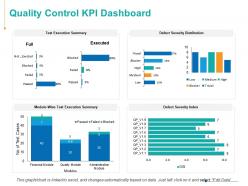 Quality control kpi dashboard ppt powerpoint presentation inspiration example
Presenting this set of slides with name - Quality Control KPI Dashboard Ppt Powerpoint Presentation Inspiration Example. This is a six stage process. The stages in this process are Finance, Analysis, Business, Investment, Marketing.
-
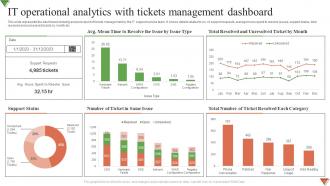 IT Operational Analytics With Tickets Management Dashboard
This slide represents the dashboard showing analysis report of tickets management by the IT support service team. It shows details related to no. of support requests, average hours spent to resolve issues, support status, total resolved and unresolved tickets by month etc. Introducing our IT Operational Analytics With Tickets Management Dashboard set of slides. The topics discussed in these slides are Resolve Issue, Ticket Resolved, Support Status. This is an immediately available PowerPoint presentation that can be conveniently customized. Download it and convince your audience.
-
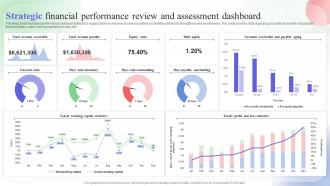 Strategic Financial Performance Review And Assessment Dashboard
Following slide illustrates performance dashboard utilized by organizations to improve business position by identifying financial strengthens and weaknesses. This slide provides data regarding accounts receivable and payable, financial ratios, yearly working capital summary, etc. Introducing our Strategic Financial Performance Review And Assessment Dashboard set of slides. The topics discussed in these slides are Equity Ratio, Debt Equity, Current Ratio. This is an immediately available PowerPoint presentation that can be conveniently customized. Download it and convince your audience.
-
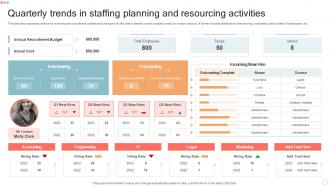 Quarterly Trends In Staffing Planning And Resourcing Activities
This slide showcases key metrics for reviewing new recruitment updates and changes over the year to identify current company needs for human resource. It further includes details about interviewing, on boarding, total number of employees, etc.Introducing our Quarterly Trends In Staffing Planning And Resourcing Activities set of slides. The topics discussed in these slides are Annual Recruitment Budget, Actual Cost, Total Employees. This is an immediately available PowerPoint presentation that can be conveniently customized. Download it and convince your audience.
-
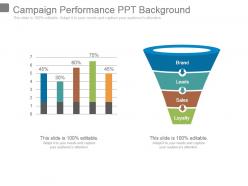 Campaign performance ppt background
Presenting campaign performance ppt background. This is a campaign performance ppt background. This is a two stage process. The stages in this process are brand, leads, sales, loyalty.
-
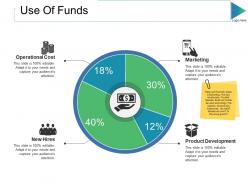 Use of funds ppt slides clipart
Presenting this set of slides with name - Use Of Funds Ppt Slides Clipart. This is a four stage process. The stages in this process are Operational Cost, New Hires, Product Development, Marketing, Business.
-
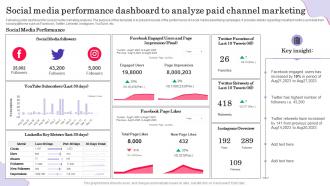 Social Media Performance Dashboard To Analyze Paid Channel Marketing
Following slide dashboard for social media marketing analysis. The purpose of this template is to present visuals of the performance of social media advertising campaigns. It provides details regarding important metrics and data from social platforms such as Facebook, Twitter, LinkedIn, Instagram, YouTube, etc. Introducing our Social Media Performance Dashboard To Analyze Paid Channel Marketing set of slides. The topics discussed in these slides are Social Media Followers, Linkedin Key Metrics. This is an immediately available PowerPoint presentation that can be conveniently customized. Download it and convince your audience.
-
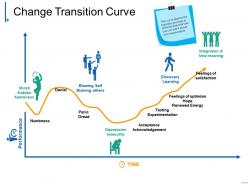 Change transition curve powerpoint slide templates
Presenting change transition curve powerpoint slide templates. This is a change transition curve powerpoint slide templates. This is a one stage process. The stages in this process are denial, panic dread, numbness, depression insecurity, performance.
-
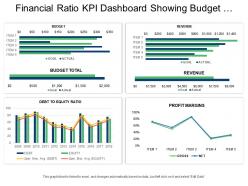 Financial ratio kpi dashboard snapshot showing budget revenue and profit margins
Presenting this set of slides with name - Financial Ratio Kpi Dashboard Snapshot Showing Budget Revenue And Profit Margins. This is a four stage process. The stages in this process are Accounting Ratio, Financial Statement, Financial Ratio.
-
 One page traditional vs future vulnerability management presentation report infographic ppt pdf document
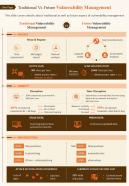
Here we present One Page Traditional Vs Future Vulnerability Management Presentation Report Infographic PPT PDF Document one pager PowerPoint template. Vulnerability means the inability of a group or an individual to cope up or withstand the impact of hostile environment. Vulnerability management thus helps in identifying, classifying, evaluating and mitigating the vulnerabilities in software. To assist you in mitigating the risks we have come up with risk assessment in vulnerability management PowerPoint slide design one pager. This vulnerability assessment PowerPoint template one pager covers details about risk assessment in vulnerability management with executive summary where you can present the aim of vulnerability scan. It gives you a column to jot down your findings and severity of vulnerability. Manage your network security using vulnerability management approach and safeguard data assets of your organization. The slide being completely customizable and readily available saves a lot of time of the presenter in explaining and showcasing the concepts. You can add or remove any element on this vulnerability scanner one pager template. Incorporate this amazingly curated PowerPoint template to deal with vulnerabilities and make sure that your organization focuses on efficient tactics. Grab this One Page Traditional Vs Future Vulnerability Management Presentation Report Infographic PPT PDF Document one pager template now.
-
 Diversity Management To Create Positive Statistics Of Existing Workplace Diversity Ppt Slides Layouts
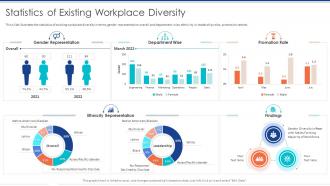
This slide illustrates the statistics of existing workplace diversity in terms gender representation overall and department wise, ethnicity in leadership roles, promotion rate etc. Deliver an outstanding presentation on the topic using this Diversity Management To Create Positive Statistics Of Existing Workplace Diversity Ppt Slides Layouts. Dispense information and present a thorough explanation of Gender Representation, Department Wise, Promotion Rate using the slides given. This template can be altered and personalized to fit your needs. It is also available for immediate download. So grab it now.
-
 Workforce Diversity Dashboard Based On Gender And Ethnicity Diversity Management To Create Positive
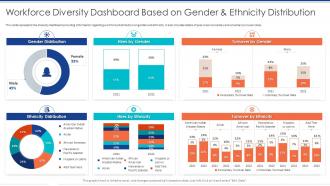
This slide represents the diversity dashboard providing information regarding work force distribution on gender and ethnicity. It also includes details of year wise involuntary and voluntary turnover rates. Deliver an outstanding presentation on the topic using this Workforce Diversity Dashboard Based On Gender And Ethnicity Diversity Management To Create Positive. Dispense information and present a thorough explanation of Workforce Diversity, Dashboard Based, Gender And Ethnicity Distribution using the slides given. This template can be altered and personalized to fit your needs. It is also available for immediate download. So grab it now.
-
 Executive summary powerpoint themes
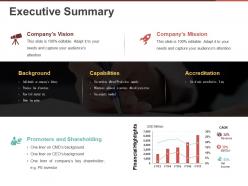
Presenting this set of slides with name - Executive Summary Powerpoint Themes. This is a three stage process. The stages in this process are Bar Chart, Finance, Marketing, Analysis, Strategy, Business.
-
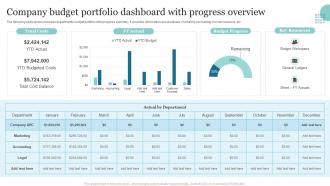 Company Budget Portfolio Dashboard With Progress Overview
The following slide shows business departments budget portfolio with progress summary. It provides information about actuals, marketing accounting, human resource, etc. Introducing our Company Budget Portfolio Dashboard With Progress Overview set of slides. The topics discussed in these slides are Total Costs, Budget Progress, Key Resources. This is an immediately available PowerPoint presentation that can be conveniently customized. Download it and convince your audience.
-
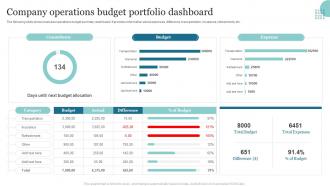 Company Operations Budget Portfolio Dashboard
The following slide shows business operations budget summary dashboard. It provides information about expenses, difference, transportation, insurance, refreshment, etc. Presenting our well structured Company Operations Budget Portfolio Dashboard. The topics discussed in this slide are Transportation, Refreshment, Insurance. This is an instantly available PowerPoint presentation that can be edited conveniently. Download it right away and captivate your audience.
-
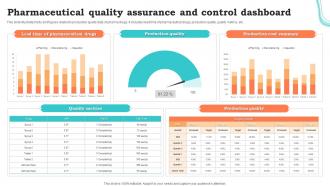 Pharmaceutical Assurance And Control Dashboard
This slide illustrates facts and figures related to production quality data of pharma drugs. It includes lead time of pharmaceutical drugs, production quality, quality metrics, etc. Presenting our well structured Pharmaceutical Assurance And Control Dashboard. The topics discussed in this slide are Pharmaceutical, Dashboard, Assurance. This is an instantly available PowerPoint presentation that can be edited conveniently. Download it right away and captivate your audience.
-
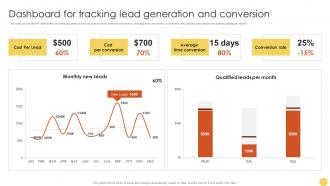 Dashboard For Tracking Lead Advanced Lead Generation Tactics Strategy SS V
This slide covers the KPI dashboard for analyzing metrics such as cost per lead, cost per conversion, average time conversion, conversion rate, monthly new leads, and qualified leads per month. Deliver an outstanding presentation on the topic using this Dashboard For Tracking Lead Advanced Lead Generation Tactics Strategy SS V. Dispense information and present a thorough explanation of Conversion, Average, Conversion using the slides given. This template can be altered and personalized to fit your needs. It is also available for immediate download. So grab it now.
-
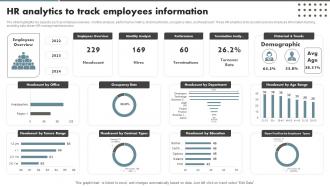 HR Analytics To Track Employees Information
The slide highlights key aspects such as employee overview, monthly analysis, performance metrics, historical trends, occupancy rates, and headcount. These HR analytics tools assist in precise employee information tracking, enabling data driven HR management decisions. Introducing our HR Analytics To Track Employees Information set of slides. The topics discussed in these slides are Headcount By Office, Headcount By Tenure Range, Headcount By Department. This is an immediately available PowerPoint presentation that can be conveniently customized. Download it and convince your audience.
-
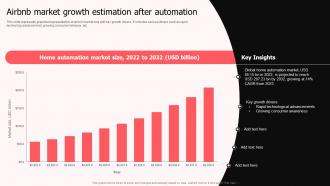 Airbnb Market Growth Estimation After Automation
This slide represents graphical representation of airbnb market size with key growth drivers. It includes various drivers such as rapid technology advancement, growing consumer behavior, etc. Introducing our Airbnb Market Growth Estimation After Automation set of slides. The topics discussed in these slides are Technological Advancements, Growing Consumer Awareness This is an immediately available PowerPoint presentation that can be conveniently customized. Download it and convince your audience.
-
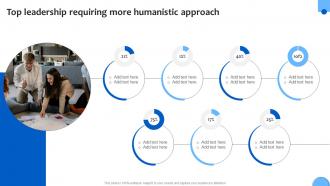 Top Leadership Requiring Analyzing And Adopting Strategic Leadership For Financial Strategy SS V
Present the topic in a bit more detail with this Top Leadership Requiring Analyzing And Adopting Strategic Leadership For Financial Strategy SS V. Use it as a tool for discussion and navigation on Top Leadership, Requiring More Humanistic Approach. This template is free to edit as deemed fit for your organization. Therefore download it now.
-
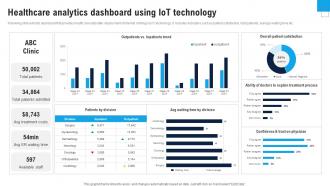 Healthcare Analytics Dashboard Enhance Healthcare Environment Using Smart Technology IoT SS V
Following slide exhibits dashboard that provides health care data after deployment of internet of things IoT technology. It includes indicators such as patient satisfaction, total patients, average waiting time etc. Deliver an outstanding presentation on the topic using this Healthcare Analytics Dashboard Enhance Healthcare Environment Using Smart Technology IoT SS V. Dispense information and present a thorough explanation of Inpatients Trend, Patient Satisfaction, Treatment Process using the slides given. This template can be altered and personalized to fit your needs. It is also available for immediate download. So grab it now.


