Charts, Graphs PowerPoint Designs, Presentation Charts Designs & PPT Graphics
- Sub Categories
-
- Arrows and Targets
- Bullet and Text Slides
- Charts and Graphs
- Circular Cycle Diagrams
- Concepts and Shapes
- Custom Flat Designs
- Dashboards and Measuring
- Flow Process
- Funnels
- Gears
- Growth
- Harvey Balls
- Idea Innovation and Light Bulbs
- Leadership
- Linear Process Diagrams
- Magnifying Glass
- Misc Other Graphics
- Opportunity and Handshake
- Organization Charts
- Puzzles
- Pyramids
- Roadmaps and Timelines
- Silhouettes
- Steps
- Strategic Planning Analysis
- SWOT Analysis
- Tables and Matrix
- Teamwork
- Technology and Communication
- Venn Diagrams
- Visuals and Illustrations
-
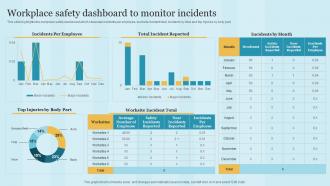 Workplace Safety Dashboard To Monitor Incidents Maintaining Health And Safety
This slide highlights the workplace safety dashboard which showcase incidents per employee, worksite incident total, incidents by total and top injuries by body part. Present the topic in a bit more detail with this Workplace Safety Dashboard To Monitor Incidents Maintaining Health And Safety. Use it as a tool for discussion and navigation on Total Incident Reported, Worksite Incident Total, monitor incidents. This template is free to edit as deemed fit for your organization. Therefore download it now.
-
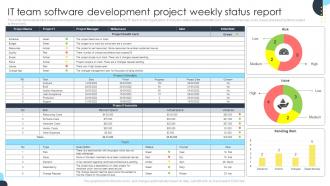 IT Team Software Development Project Weekly Status Report
This slide demonstrates the software development project status report prepared by the IT team of the organization. It includes details related to health card, schedule, financials, risks, issues and pending items related to the project. Introducing our IT Team Software Development Project Weekly Status Report set of slides. The topics discussed in these slides are Project Manager, Software Development, Weekly Status Report. This is an immediately available PowerPoint presentation that can be conveniently customized. Download it and convince your audience.
-
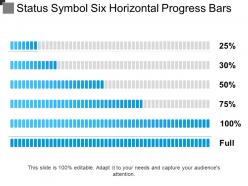 Status symbol six horizontal progress bars
Presenting status symbol six horizontal progress bars. This is a status symbol six horizontal progress bars. This is a six stage process. The stages in this process are status symbol, status icon.
-
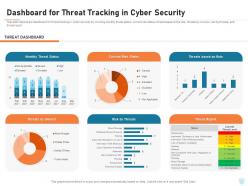 Cyber security it dashboard for threat tracking in cyber security ppt powerpoint tutorials
This slide depicts the dashboard for threat tracking in cyber security by covering monthly threat status, current risk status, threat-based on the role, threats by owners, risk by threats, and threat report. Present the topic in a bit more detail with this Cyber Security IT Dashboard For Threat Tracking In Cyber Security Ppt Powerpoint Tutorials. Use it as a tool for discussion and navigation on Monthly Threat Status, Threats By Owners, Risk By Threats, Current Risk Status, Threats Based On Role, Threat Report. This template is free to edit as deemed fit for your organization. Therefore download it now.
-
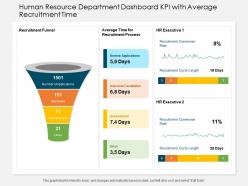 Human resource department dashboard kpi with average recruitment time
Presenting this set of slides with name Human Resource Department Dashboard KPI With Average Recruitment Time. The topics discussed in these slides are Recruitment Funnel, Recruitment Process, HR Executive, Interview Candidates, Review Applications. This is a completely editable PowerPoint presentation and is available for immediate download. Download now and impress your audience.
-
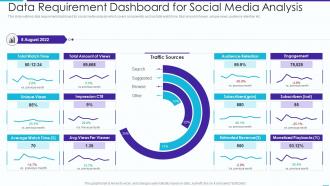 Data Requirement Dashboard Snapshot For Social Media Analysis
This slide outlines data requirement dashboard Snapshot for social media analysis which covers components such as total watch time, total amount of views, unique views, audience retention etc. Presenting our well-structured Data Requirement Dashboard For Social Media Analysis. The topics discussed in this slide are Requirement, Dashboard, Analysis. This is an instantly available PowerPoint presentation that can be edited conveniently. Download it right away and captivate your audience.
-
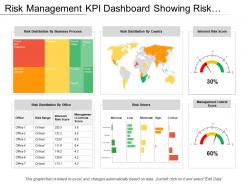 Risk Management Kpi Dashboard Showing Risk Distribution By Country Office
Presenting this set of slides with name - Risk Management Kpi Dashboard Showing Risk Distribution By Country Office And Business Process. This is a six stage process. The stages in this process are Risk Management, Risk Assessment, Project Risk.
-
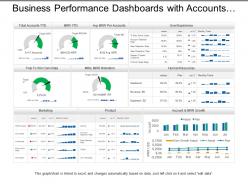 Business performance dashboards snapshot with accounts and mrr growth
Presenting, our business performance dashboards snapshot with accounts and mr growth PPT layout. High pixel resolution of the designs. Easy to edit and save using google slides. 100% modification of the slides granted. Apply your company name, replacing the official trademark in the slides. Valuable for the Marketing Professionals, business managers, and the directors. Includes extensive text spaces to include a title and can be easily projected to a widescreen.
-
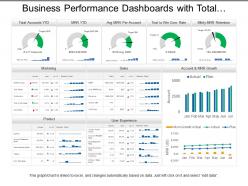 Business performance dashboards with total accounts marketing and product
Presenting, business performance dashboards with total accounts marketing and product PowerPoint template. High-resolution PPT slide to reflect on business performance. The content is accurate and ready to use. Modifiable framework, layout, and font type, font size, and color schemes. Can be quickly transformed into PDF and JPG format. Appealing graphs for illustration and captivating figures to illustrate the idea. Can be extended to widescreen without loss of quality. Compatible with Google Slides and widescreens.
-
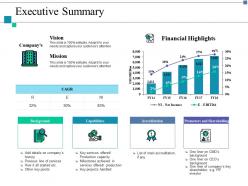 Executive summary accreditation ppt layouts example introduction
This is a four stage process. The stages in this process are Background, Capabilities, Accreditation, Vision, Mission.
-
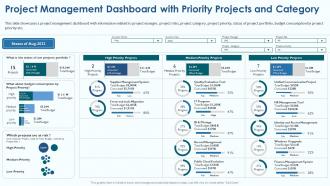 Project Management Dashboard With Priority Projects And Category Project Viability Assessment
This slide showcases a project management dashboard with information related to project manager, project risks, project category, project priority, status of project portfolio, budget consumption by project priority etc. Present the topic in a bit more detail with this Project Management Dashboard With Priority Projects And Category Project Viability Assessment. Use it as a tool for discussion and navigation on Project Management, Dashboard, Priority Projects, Category. This template is free to edit as deemed fit for your organization. Therefore download it now.
-
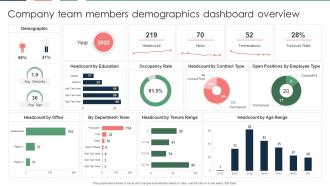 Company Team Members Demographics Dashboard Overview
Introducing our Company Team Members Demographics Dashboard Overview set of slides. The topics discussed in these slides are Company Team Members, Demographics, Dashboard Overview. This is an immediately available PowerPoint presentation that can be conveniently customized. Download it and convince your audience.
-
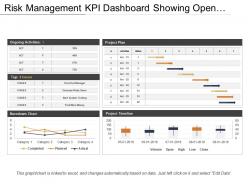 Project status kpi dashboard showing project plan and burndown chart
Presenting status KPI dashboard showing project plan and burndown chart PowerPoint slides. This layout is Compatible with Google slides. Easy to put in company logo, trademark or name; accommodate words to support the key points. Images do no blur out even when they are projected on large screen.PPT template can be utilized by sales and marketing teams and business managers. Instantly downloadable slide and supports formats like JPEG and PDF. Adjust colors, text and fonts as per your business requirements.
-
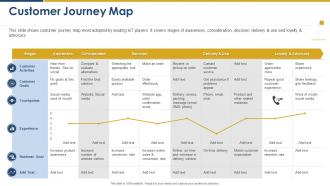 Market intelligence and strategy development customer journey map
This slide shows customer journey map most adopted by leading IoT players. It covers stages of awareness, consideration, decision, delivery and use and loyalty and advocacy Present the topic in a bit more detail with this Market Intelligence And Strategy Development Customer Journey Map. Use it as a tool for discussion and navigation on Customer Journey Map. This template is free to edit as deemed fit for your organization. Therefore download it now.
-
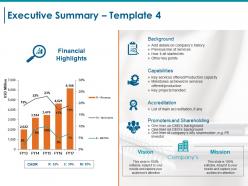 Executive summary ppt styles graphics pictures
Presenting this set of slides with name - Executive Summary Ppt Styles Graphics Pictures. This is a two stage process. The stages in this process are Background, Capabilities, Accreditation, Promoters And Shareholding, Cagr.
-
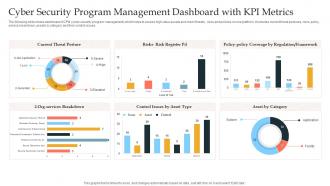 Cyber Security Program Management Dashboard With KPI Metrics
The following slide shows dashboard of CPM cyber security program management which helps to access high value assets and check threats, risks and policies on one platform. It includes current threat postures, risks, policy, service breakdown, assets by category and their control issues. Presenting our well-structured Cyber Security Program Management Dashboard With KPI Metrics. The topics discussed in this slide are Cyber Security, Program Management Dashboard, KPI Metrics. This is an instantly available PowerPoint presentation that can be edited conveniently. Download it right away and captivate your audience.
-
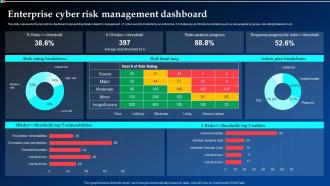 Enterprise Cyber Risk Management Dashboard Implementing Cyber Security Ppt Demonstration
This slide represents the key metrics dashboard representing details related to management of cyber security incidents by an enterprise. It includes key performance indicators such as risk analysis progress, risk rating breakdown etc. Deliver an outstanding presentation on the topic using this Enterprise Cyber Risk Management Dashboard Implementing Cyber Security Ppt Demonstration. Dispense information and present a thorough explanation of Enterprise Cyber, Risk Management, Dashboard using the slides given. This template can be altered and personalized to fit your needs. It is also available for immediate download. So grab it now.
-
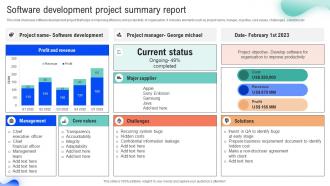 Software Development Project Summary Report
This slide showcase software development project that helps in improving efficiency and productivity of organization. It includes elements such as project name, manger, objective, core values, challenges, solutions etc. Introducing our Software Development Project Summary Report set of slides. The topics discussed in these slides are Software Development, Project Summary Report, Transparency, Accountability. This is an immediately available PowerPoint presentation that can be conveniently customized. Download it and convince your audience.
-
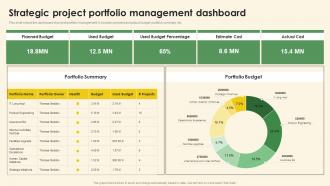 Strategic Project Portfolio Management Dashboard
This slide shows the dashboard of project portfolio management. It includes planned and actual budget, portfolio summary, etc. Introducing our Strategic Project Portfolio Management Dashboard set of slides. The topics discussed in these slides are Used Budget, Planned Budget, Estimate Cost, Actual Cost. This is an immediately available PowerPoint presentation that can be conveniently customized. Download it and convince your audience.
-
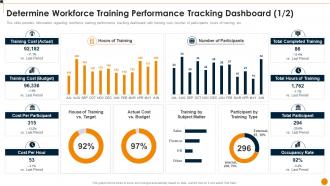 Determine Workforce Training Performance Workforce Training Playbook
This slide provides information regarding workforce training performance tracking dashboard with training cost, number of participants, hours of training, etc. Deliver an outstanding presentation on the topic using this Determine Workforce Training Performance Workforce Training Playbook. Dispense information and present a thorough explanation of Cost, Budget, Target using the slides given. This template can be altered and personalized to fit your needs. It is also available for immediate download. So grab it now.
-
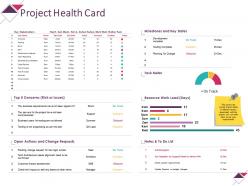 Project health card powerpoint slide information
Presenting this set of slides with name - Project Health Card Powerpoint Slide Information. This is a six stage process. The stages in this process are Task Meter, Resource Work Load, Open Actions And Change, Dashboard, Business.
-
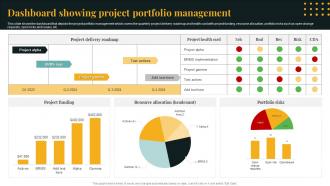 Dashboard Showing Project Portfolio Management
This slide shows the dashboard that depicts the project portfolio management which covers the quarterly project delivery roadmap and health card with project funding, resource allocation, portfolio risks such as open change requests, open risks and issues, etc. Presenting our well structured Dashboard Showing Project Portfolio Management. The topics discussed in this slide are Project Delivery Roadmap, Resource Allocation, Project Funding. This is an instantly available PowerPoint presentation that can be edited conveniently. Download it right away and captivate your audience.
-
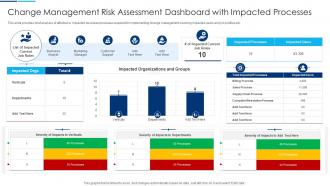 Change Management Risk Assessment Dashboard With Impacted Processes
This slide provides brief analysis of affected or impacted business processes required for implementing change management covering impacted users and job profiles etc. Presenting our well structured Change Management Risk Assessment Dashboard With Impacted Processes. The topics discussed in this slide are Change Management Risk Assessment Dashboard With Impacted Processes. This is an instantly available PowerPoint presentation that can be edited conveniently. Download it right away and captivate your audience.
-
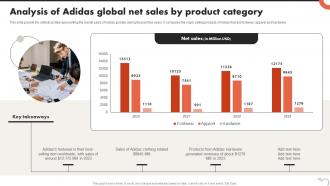 Analysis Of Adidas Global Net Sales By Product Category Critical Evaluation Of Adidas Strategy SS
This slide provide the statistical data representing the overall sales of Adidas globally during the past four years. It compares the major selling products of Adidas that are footwear, apparel and hardware. Present the topic in a bit more detail with this Analysis Of Adidas Global Net Sales By Product Category Critical Evaluation Of Adidas Strategy SS Use it as a tool for discussion and navigation on Analysis Of Adidas, Global Net Sales, Product Category This template is free to edit as deemed fit for your organization. Therefore download it now.
-
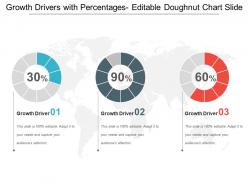 Growth drivers with percentages editable doughnut chart slide
Presenting a PPT template named Growth drivers with percentages editable doughnut chart slide. This template is professionally designed and is completely editable. The Font color, Font size, Font style, background color and color of the diagram can be altered as per your suitability. The text in the template can be rewritten and replaced with your desired content. The slide is totally compatible with Google slides and can be easily saved in JPG or PDF format. You can customize the template conveniently by changing the data in excel sheet, as this template is Excel-linked. Editable icons make the presentation more presentable. Download it now to make a hassle free presentation.
-
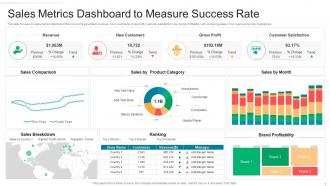 Sales metrics dashboard to measure success rate
Presenting our well structured Sales Metrics Dashboard To Measure Success Rate. The topics discussed in this slide are Revenue, Gross Profit, Customer Satisfaction. This is an instantly available PowerPoint presentation that can be edited conveniently. Download it right away and captivate your audience.
-
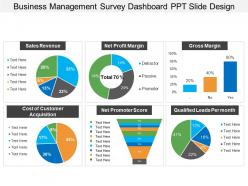 Business management survey dashboard snapshot ppt slide design
Presenting business management survey dashboard snapshot PPT slide design PowerPoint diagram which is 100% editable. This PPT template is data driven i.e. excel linked and is easy to customize and enables you to personalize it as per your own criteria. The presentation slide is fully compatible with Google slides, multiple format and software options. In case of any assistance, kindly take instructions from our presentation design services and it is easy to download in a very short span of time. The images, layouts, designs are of high quality and ensures quality in widescreen.
-
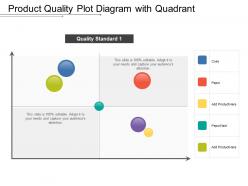 Product quality plot diagram with quadrant
Presenting this set of slides with name - Product Quality Plot Diagram With Quadrant. This is a three stage process. The stages in this process are Scatter Plot, Probability Plots, Plot Diagram.
-
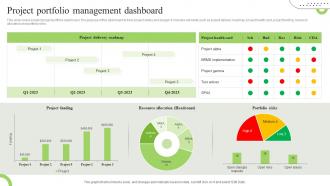 Project Portfolio Management Dashboard
This slide covers product project portfolio dashboard. The purpose of this dashboard to track project status and budget. It includes elements such as project delivery roadmap, project health card, project funding, resource allocation and portfolio risks. Presenting our well structured Project Portfolio Management Dashboard. The topics discussed in this slide are Project, Delivery, Portfolio Risks. This is an instantly available PowerPoint presentation that can be edited conveniently. Download it right away and captivate your audience.
-
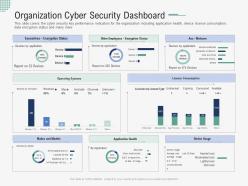 Organization cyber security dashboard implementing security awareness program ppt clipart
This slide covers the cyber security key performance indicators for the organization including application health, device license consumption, data encryption status and many more. Present the topic in a bit more detail with this Organization Cyber Security Dashboard Implementing Security Awareness Program Ppt Clipart. Use it as a tool for discussion and navigation on Organization Cyber Security Dashboard. This template is free to edit as deemed fit for your organization. Therefore download it now.
-
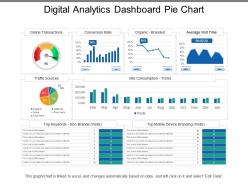 Digital analytics dashboard pie chart
Presenting this set of slides with name - Digital Analytics Dashboard Pie Chart. This is a five stage process. The stages in this process are Digital Analytics, Digital Dashboard, Digital Kpis.
-
 Business kpi dashboard showing marketing spend and return on investment
Presenting this set of slides with name - Business Kpi Dashboard Showing Marketing Spend And Return On Investment. This is a three stage process. The stages in this process are Business Dashboard, Business Kpi, Business Performance.
-
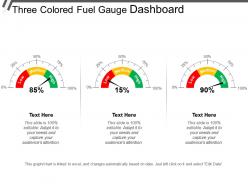 Three colored fuel gauge dashboard
Presenting this set of slides with name - Three Colored Fuel Gauge Dashboard. This is a three stage process. The stages in this process are Fuel Gauge, Gas Gauge, Fuel Containers.
-
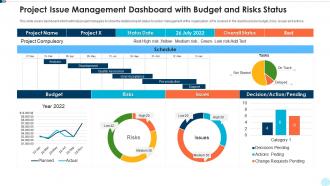 Project issue management dashboard with budget and risks status
Presenting our well structured Project Issue Management Dashboard With Budget And Risks Status. The topics discussed in this slide are MSP Framework For Risk And Issue Management. This is an instantly available PowerPoint presentation that can be edited conveniently. Download it right away and captivate your audience.
-
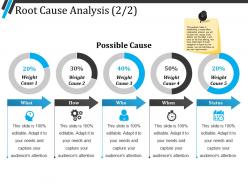 Root cause analysis ppt summary
Presenting Root Cause Analysis PPT Summary which is designed professionally for your convenience. You can change the color, fonts, font size, and font types of the template as per the requirements. The slide is readily available in both 4:3 and 16:9 aspect ratio. It is adaptable with Google Slides which makes it accessible at once. Can be converted into formats like PDF, JPG, and PNG.
-
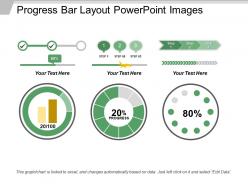 Progress bar layout powerpoint images
You can download this PPT completely free of cost. You just have to edit the data in a pre-designed format and present it. You can insert fonts and icons to this ready-made slide. All these slides are fully compatible with Google Slides. This presentation can be downloaded in JPG and PDF formats. It can be viewed in the 16:9 ratio widescreen size and the ratio of 4:3 standard screen size.
-
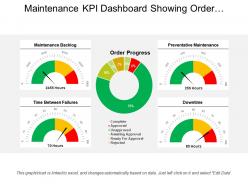 Maintenance kpi dashboard showing order progress and backlog
Presenting our maintenance KPI dashboard showing order progress and backlog. This PPT slide offers you plenty of space to put in titles and sub titles. High resolution-based presentation layout, does not change the image even after resizing. This presentation icon is data driven and template can be downloaded via excel file to incorporate data. Quick downloading speed and simple editing options in color text and fonts.PPT icons can easily be changed into JPEG and PDF applications.
-
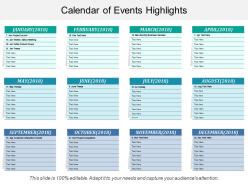 Calendar of events highlights
Presenting this set of slides with name - Calendar Of Events Highlights. This is a one stage process. The stages in this process are Burn Down Chart, Agile Software Development Chart, Run Chart.
-
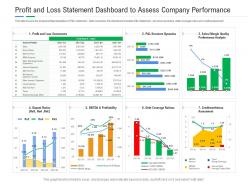 Profit and loss statement dashboard to assess company performance powerpoint template
This slide Covers the Graphical Representation of P and L statement. Data covered in this dashboard includes P and L Statement, structure dynamics, debt coverage ratios and credit assessment. This is a Profit And Loss Statement Dashboard To Assess Company Performance Powerpoint Template drafted with a diverse set of graphics, that can be reformulated and edited as per your needs and requirements. Just download it in your system and make use of it in PowerPoint or Google Slides, depending upon your presentation preferences.
-
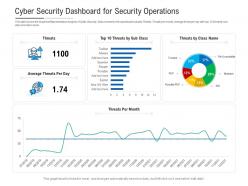 Cyber security dashboard snapshot for security operations powerpoint template
This slide Covers the Graphical Representation Analysis of Cyber Security. Data covered in this dashboard snapshot includes Threats, Threats per month, Average threat per day with top 10 threat by sub class and class name. This is a Cyber Security Dashboard Snapshot For Security Operations Powerpoint Template drafted with a diverse set of graphics, that can be reformulated and edited as per your needs and requirements. Just download it in your system and make use of it in PowerPoint or Google Slides, depending upon your presentation preferences.
-
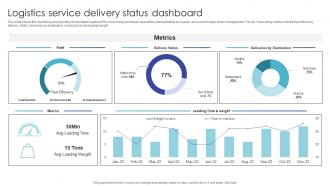 Logistics Service Delivery Status Dashboard
This slide shows the monitoring and reporting of important logistics KPIs concerning warehouse operations, transportation processes, and overall supply chain management. The key measuring metrics include fleet efficiency, delivery status, deliveries by destination, loading time and loading weight. Introducing our Logistics Service Delivery Status Dashboard set of slides. The topics discussed in these slides are Delivery Status, Deliveries By Destination, Loading Time. This is an immediately available PowerPoint presentation that can be conveniently customized. Download it and convince your audience.
-
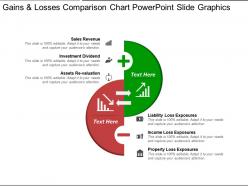 Gains and losses comparison chart powerpoint slide graphics
SlideTeam presents to all of you this 100% adjustable gains and losses comparison chart PowerPoint slide graphics. The PowerPoint presentation is totally editable, which makes it totally user-friendly. The fully customizable and user-friendly slides let you make a number of changes to the slides. The font color, font size, and font style are also alterable. Following simple instructions given in the sample slides, you can make the required changes. The PPT template can be viewed in standard size display ratio of 4:3 or widescreen display ratio of 16:9.
-
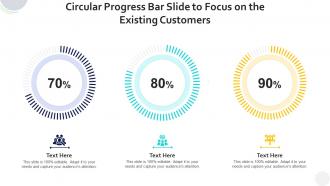 Circular progress bar slide to focus on the existing customers infographic template
Deploy our Circular Progress Bar Slide To Focus On The Existing Customers Infographic Template to present high quality presentations. It is designed in PowerPoint and is available for immediate download in standard and widescreen sizes. Not only this, but this layout is also 100 percent editable, giving you full control over its applications.
-
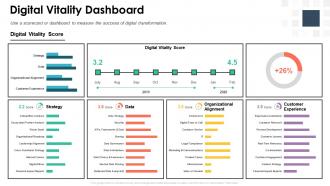 Building digital strategy roadmap for digital transformation digital vitality dashboard
Use a scorecard or dashboard to measure the success of digital transformation. Present the topic in a bit more detail with this Building Digital Strategy Roadmap For Digital Transformation Digital Vitality Dashboard. Use it as a tool for discussion and navigation on Strategy, Organizational Alignment, Customer Experience. This template is free to edit as deemed fit for your organization. Therefore download it now.
-
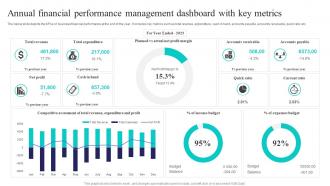 Annual Financial Performance Management Dashboard With Key Metrics
The below slide depicts the KPAs of business financial performance at the end of the year. It includes key metrics such as total revenue, expenditure, cash in hand, accounts payable, accounts receivable, quick ratio etc. Introducing our Annual Financial Performance Management Dashboard With Key Metrics set of slides. The topics discussed in these slides are Annual Financial, Performance Management, Dashboard, Key Metrics. This is an immediately available PowerPoint presentation that can be conveniently customized. Download it and convince your audience.
-
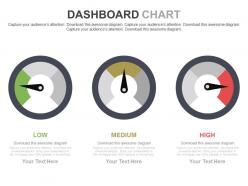 Three Meters Dashboard Charts For Analysis Powerpoint Slides
These designs create a never-ending connection between the presentation and the audience. For the Delivery of the Organisational objective these patterns act as a perfect medium. They are entirely editable. They can be viewed on big screens for more clarity and better vision. As an outcome the audience experience top notch quality presentations.
-
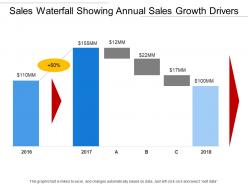 Sales waterfall showing annual sales growth drivers
Presenting the Sales Waterfall Showing Annual Sales Growth Drivers PowerPoint presentation slide. You can edit this template in PowerPoint and use it in Google slides also. The PPT layout is totally editable. You can add relevant content in the text holders provided. The image has a high resolution so that it does not blur on being enlarged. The slide is available in both standard and wide screen formats. So, click, edit and present.
-
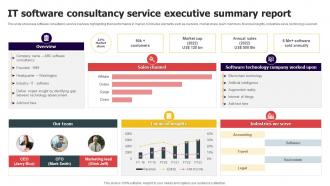 It Software Consultancy Service Executive Summary Report
This slide showcase software consultancy service overview highlighting their performance in market. It includes elements such as overview, market share, team members, financial insights, industries serve, technology used etc. Introducing our It Software Consultancy Service Executive Summary Report set of slides. The topics discussed in these slides are Overview, Sales Channel, Our Team. This is an immediately available PowerPoint presentation that can be conveniently customized. Download it and convince your audience.
-
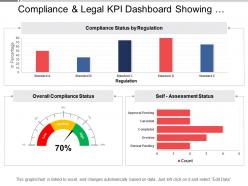 Compliance and legal kpi dashboard showing overall compliance status
Presenting this set of slides with name - Compliance And Legal Kpi Dashboard Showing Overall Compliance Status. This is a three stage process. The stages in this process are Compliance And Legal, Legal Governance, Risk Management.
-
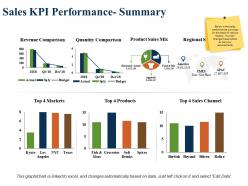 Sales kpi performance summary revenue comparison product sales mix
Presenting this set of slides with name - Sales Kpi Performance Summary Revenue Comparison Product Sales Mix. This is a three stage process. The stages in this process are Revenue Comparison, Quantity Comparison, Product Sales Mix, Regional Sales Mix, Top Sales Channel.
-
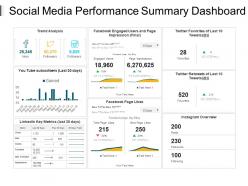 Social media performance summary dashboard presentation pictures
Presenting Social Media Performance Summary Dashboard Presentation Pictures PPT slide. This presentation design has been professionally designed, is fully editable in PowerPoint and is compatible with Google slides as well. You can customize the font type, font size, colors of the diagram, background color and add the company logo. High quality graphs, charts, tables and icons ensure that there is no deteriorating in quality on enlarging their size. Fast download at click of a button.
-
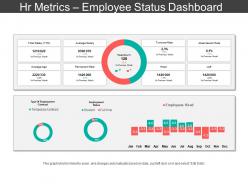 Hr metrics employee status dashboard snapshot ppt slide templates
Presenting HR Metrics Employee Status Dashboard Snapshot PPT Slide Templates which is designed professionally for your convenience. Change the color, font, font size, and font type of the slides as per your requirements. The template is compatible with Google Slides which makes it easily accessible at once. Open and save your presentation in various formats like PDF, JPG, and PNG. Freely access your template in both 4:3 and 16:9 aspect ratio.
-
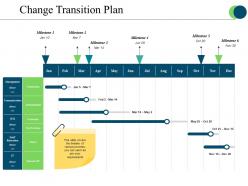 Change transition plan powerpoint templates
Presenting change transition plan powerpoint templates. This is a change transition plan powerpoint templates. This is a six stage process. The stages in this process are milestone, management, owner, preparation, announcement.
-
 Marketing kpi dashboard showing visits traffic sources and bounce rate
Presenting this set of slides with name - Marketing Kpi Dashboard Showing Visits Traffic Sources And Bounce Rate. This is a three stage process. The stages in this process are Marketing, Branding, Promoting.
-
 One page risk assessment in vulnerability management presentation report infographic ppt pdf document
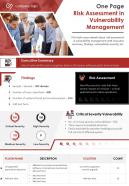
Here we present One Page Risk Assessment In Vulnerability Management Presentation Report Infographic PPT PDF Document one pager PowerPoint template. Vulnerability means the inability of a group or an individual to cope up or withstand the impact of hostile environment. Vulnerability management thus helps in identifying, classifying, evaluating and mitigating the vulnerabilities in software. To assist you in mitigating the risks we have come up with risk assessment in vulnerability management PowerPoint slide design one pager. This vulnerability assessment PowerPoint template one pager covers details about risk assessment in vulnerability management with executive summary where you can present the aim of vulnerability scan. It gives you a column to jot down your findings and severity of vulnerability. Manage your network security using vulnerability management approach and safeguard data assets of your organization. The slide being completely customizable and readily available saves a lot of time of the presenter in explaining and showcasing the concepts. You can add or remove any element on this vulnerability scanner one pager template. Incorporate this amazingly curated PowerPoint template to deal with vulnerabilities and make sure that your organization focuses on efficient tactics. Grab this One Page Risk Assessment In Vulnerability Management Presentation Report Infographic PPT PDF Document one pager template now.
-
 Cybersecurity awareness training organization cyber security dashboard ppt model graphics
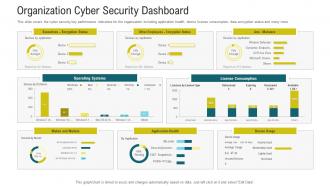
This slide covers the cyber security key performance indicators for the organization including application health, device license consumption, data encryption status and many more. Deliver an outstanding presentation on the topic using this Cybersecurity Awareness Training Organization Cyber Security Dashboard Ppt Model Graphics. Dispense information and present a thorough explanation of Executives, License Consumption, Operating Systems using the slides given. This template can be altered and personalized to fit your needs. It is also available for immediate download. So grab it now.
-
 Employee Safety Key Performance Indicator Dashboard With Case Incident Rate
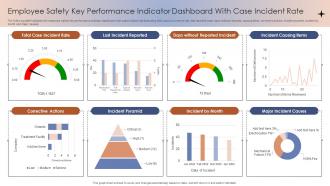
The following slide highlights the employee safety key performance indicator dashboard with case incident rate illustrating total case occurrence rate, last reported case, days without reported, causing items, corrective actions, incident pyramid, incident by month and major causes Presenting our well-structured Employee Safety Key Performance Indicator Dashboard With Case Incident Rate. The topics discussed in this slide are Major Incident Causes, Incident Pyramid, Corrective Actions. This is an instantly available PowerPoint presentation that can be edited conveniently. Download it right away and captivate your audience.
-
 Monthly project accomplishment business report
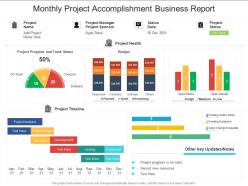
Introducing our Monthly Project Accomplishment Business Report set of slides. The topics discussed in these slides are Project Progress, Project Timeline, Project Analysis. This is an immediately available PowerPoint presentation that can be conveniently customized. Download it and convince your audience.
-
 Multiple Business Idea Generation Ppt Graphics Icons
We are proud to present our multiple business idea generation ppt graphics icons. This power point template diagram has been crafted with graphic of gears and one man. This PPT diagram contains the concept of idea generation. Use this PPT diagram for business presentations.
-
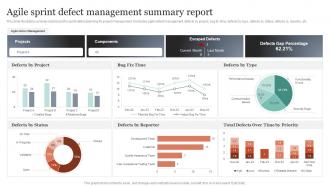 Agile Sprint Defect Management Summary Report
This slide illustrates summary dashboard for sprint defect planning for project management. It includes agile defect management, defects by project, bug fix time, defects by type, defects by status, defects by reporter, etc. Introducing our Agile Sprint Defect Management Summary Report set of slides. The topics discussed in these slides are Defects By Project, Defects By Status, Projects. This is an immediately available PowerPoint presentation that can be conveniently customized. Download it and convince your audience.


