Finance PowerPoint Templates, Presentation Slide Diagrams & PPT Graphics
- Sub Categories
-
- 30 60 90 Day Plan
- Advertising
- Agile Development
- Aims and Objectives
- Arrows
- Before and After
- Blockchain Bitcoin
- Boxes
- Business
- Calender
- Case Study
- Celebrations
- Certificates
- Challenges Opportunities
- Channel Distribution
- Children
- Communication
- Competitive Landscape
- Computer
- Concepts
- Construction Management
- Corporate
- Crowdfunding
- Current State Future State
- Custom PowerPoint Diagrams
- Digital Transformation
- Dos and Donts
- Economics
- Education
- Environment
- Events
- Festival
- Finance
- Financials
- Food
- Game
- Gap Analysis
- Generic
- Geographical
- Health
- Heatmaps
- Holidays
- Icons
- Input Process Output
- Internet
- Key Messages
- Key Wins
- Ladder
- Leadership
- Lists
- Lucky Draw
- Management
- Marketing
- Measuring
- Medical
- Music
- News
- Next Steps
- People Process Technology
- Pillars
- Planning
- Post-it-Notes
- Problem Statement
- Process
- Proposal Management
- Pros and Cons
- Puzzle
- Puzzles
- Recruitment Strategy
- Religion
- Research and Development
- Risk Mitigation Strategies
- Roadmap
- Selling
- Shapes
- Short Term Long Term
- Social
- Stairs
- Start Stop Continue
- Strategy
- Symbol
- Technology
- Thesis Defense Dissertation
- Timelines
- Traffic
- Transition Plan
- Transportation
- Vehicles
- Venture Capital Funding
- Warning
- Winners
- Word Cloud
-
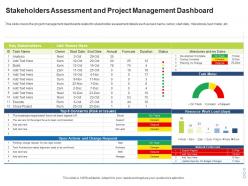 Stakeholders assessment and project management dashboard stakeholder assessment and mapping ppt model
This slide covers the project management dashboards related to stakeholder assessment details such as task name, owner, start date, milestones, task meter, etc. Present the topic in a bit more detail with this Stakeholders Assessment And Project Management Dashboard Stakeholder Assessment And Mapping Ppt Model. Use it as a tool for discussion and navigation on Stakeholders Assessment And Project Management Dashboard. This template is free to edit as deemed fit for your organization. Therefore download it now.
-
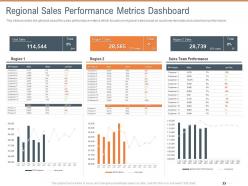 Regional Sales Performance Metrics Dashboard Territorial Marketing Planning Ppt Icons
This slide provides the glimpse about the sales performance metrics which focuses on regional sales based on customer demands and sales team performance. Deliver an outstanding presentation on the topic using this Regional Sales Performance Metrics Dashboard Territorial Marketing Planning Ppt Icons. Dispense information and present a thorough explanation of Regional Sales Performance Metrics Dashboard using the slides given. This template can be altered and personalized to fit your needs. It is also available for immediate download. So grab it now.
-
 Supplier Compliance Data Dashboard Slide For Consumer Preferences Infographic Template
This is a single slide titled Supplier Compliance Data Dashboard Slide For Consumer Preferences Infographic Template. It is crafted using high-quality vector-based visuals that are 100 percent editable and available for immediate download in standard and widescreen aspect ratios.
-
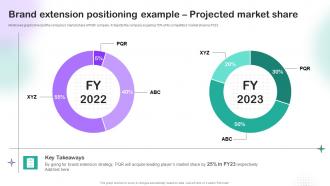 Brand Extension Positioning Example Projected Market Share
Mentioned graphs forecast the companys market share of PQR company. It depicts the company acquiring 15 parcent of its competitors market share by FY23. Deliver an outstanding presentation on the topic using this Brand Extension Positioning Example Projected Market Share. Dispense information and present a thorough explanation of Brand Extension, Positioning Example, Projected Market Share using the slides given. This template can be altered and personalized to fit your needs. It is also available for immediate download. So grab it now.
-
 B2B Digital Marketing Strategy Demographic Segmentation Ppt Topics
Use these data driven charts and diagrams to describe your target customer in detail for better insights. Deliver an outstanding presentation on the topic using this B2B Digital Marketing Strategy Demographic Segmentation Ppt Topics. Dispense information and present a thorough explanation of Psychographic Segmentation, Behaviours, Activities using the slides given. This template can be altered and personalized to fit your needs. It is also available for immediate download. So grab it now.
-
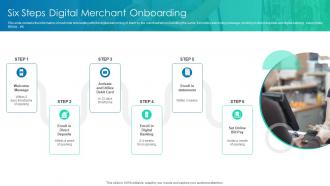 Six Steps Digital Merchant Onboarding
This slide contains the information of customer onboarding with the digital welcoming of them by the merchant who is handling the same. It includes welcoming message, enrolling in direct deposits and digital banking, setup online bill pay, etc. Presenting our set of slides with Six Steps Digital Merchant Onboarding. This exhibits information on six stages of the process. This is an easy to edit and innovatively designed PowerPoint template. So download immediately and highlight information on Welcome Message, Enroll Statements, Set Online, Bill Pay.
-
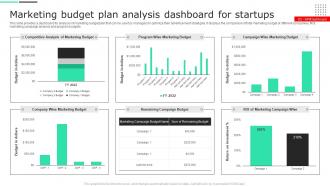 Marketing Budget Plan Analysis Dashboard For Startups
This slide provides a dashboard for analysis of marketing budget plan that can be used by managers to optimize their advertisement strategies. It displays the comparison of total marketing budget of different companies, ROI, marketing campaign analysis and program budgets. Introducing our Marketing Budget Plan Analysis Dashboard For Startups set of slides. The topics discussed in these slides are Campaign Budget, Marketing Budget, Competitive Analysis. This is an immediately available PowerPoint presentation that can be conveniently customized. Download it and convince your audience.
-
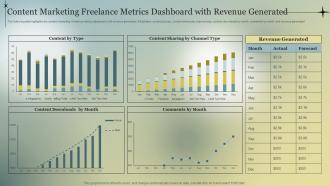 Content Marketing Freelance Metrics Dashboard With Revenue Generated
The following slide highlights the content marketing freelance metrics dashboard with revenue generated. It illustrates content by type, content sharing by channel type, content downloads by month, comments by month and revenue generated Introducing our Content Marketing Freelance Metrics Dashboard With Revenue Generated set of slides. The topics discussed in these slides are Content Marketing Freelance, Metrics Dashboard, Revenue Generated. This is an immediately available PowerPoint presentation that can be conveniently customized. Download it and convince your audience.
-
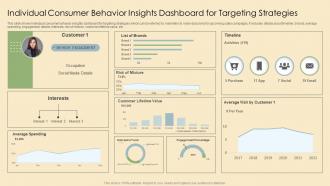 Individual Consumer Behavior Insights Dashboard For Targeting Strategies
This slide shows individual consumer behavior insights dashboard for targeting strategies which can be referred by marketers to make decisions for upcoming sales campaigns. It includes details about timeline, brands, average spending, engagement, details, interests, risk of mixture, customer lifetime value, etc. Introducing our Individual Consumer Behavior Insights Dashboard For Targeting Strategies set of slides. The topics discussed in these slides are Individual Consumer Behavior Insights, Dashboard For Targeting Strategies. This is an immediately available PowerPoint presentation that can be conveniently customized. Download it and convince your audience.
-
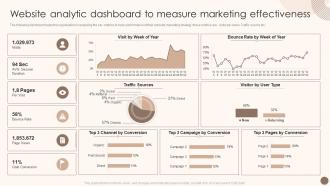 Utilizing Marketing Strategy To Optimize Website Analytic Dashboard To Measure Marketing
The following dashboard helps the organization in analyzing the key metrics to track performance of their website marketing strategy, these metrics are visits per week. Traffic source etc. Present the topic in a bit more detail with this Utilizing Marketing Strategy To Optimize Website Analytic Dashboard To Measure Marketing. Use it as a tool for discussion and navigation on Bounce Rate, Traffic Sources, Goal Conversion. This template is free to edit as deemed fit for your organization. Therefore download it now.
-
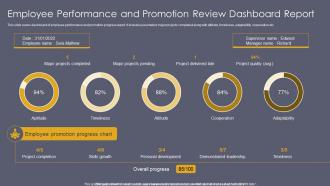 Employee Performance And Promotion Review Dashboard Report
This slide covers dashboard of employee performance and promotion progress report. It includes parameters major projects completed along with attitude, timeliness, adaptability, cooperation etc. Presenting our well structured Employee Performance And Promotion Review Dashboard Report. The topics discussed in this slide are Employee Performance, Promotion Review Dashboard Report. This is an instantly available PowerPoint presentation that can be edited conveniently. Download it right away and captivate your audience.
-
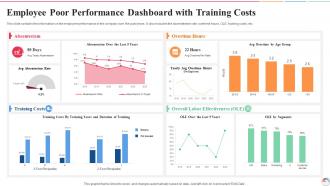 Employee Poor Performance Dashboard With Training Costs
This slide contains the information on the employee performance in the company over the past years. It also includes the absenteeism rate, overtime hours, OLE, training costs, etc. Presenting our well-structured Employee Poor Performance Dashboard With Training Costs. The topics discussed in this slide are Employee Poor Performance, Dashboard, Training Costs. This is an instantly available PowerPoint presentation that can be edited conveniently. Download it right away and captivate your audience.
-
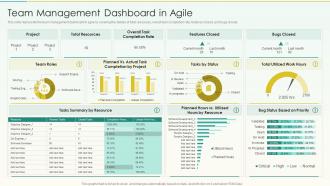 Team Management Dashboard In Agile Agile Scrum Methodology Ppt Mockup
This slide represents the team management dashboard in agile by covering the details of total resources, overall task completion rate, features closed, and bugs closed. Deliver an outstanding presentation on the topic using this Team Management Dashboard In Agile Agile Scrum Methodology Ppt Mockup. Dispense information and present a thorough explanation of Total Resources, Completion Rate, Features Closed using the slides given. This template can be altered and personalized to fit your needs. It is also available for immediate download. So grab it now.
-
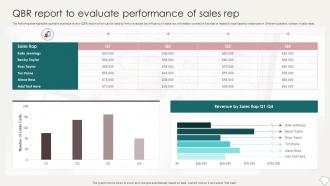 QBR Report To Evaluate Performance Of Sales Rep
The following slide highlights quarterly business review QBR report which can be used by firm to evaluate the efficiency of sales rep. information covered in this slide is related to total sales by employees in different quarters, number of calls made. Introducing our QBR Report To Evaluate Performance Of Sales Rep set of slides. The topics discussed in these slides are QBR Report, Evaluate Performance, Sales Rep. This is an immediately available PowerPoint presentation that can be conveniently customized. Download it and convince your audience.
-
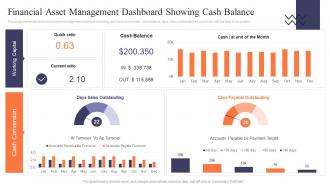 Financial Asset Management Dashboard Showing Cash Balance
This slide represents the financial asset management dashboard showing quick and current ratio, cash balance, days sales outstanding and payables with the help of bar graphs. Introducing our Financial Asset Management Dashboard Showing Cash Balance set of slides. The topics discussed in these slides are Cash Balance, Cash Conversion, Working Capital. This is an immediately available PowerPoint presentation that can be conveniently customized. Download it and convince your audience.
-
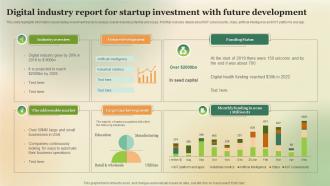 Digital Industry Report For Startup Investment With Future Development
This slide highlights information about startup investment trends to analyze overall industry potential and scope. It further includes details about IIOT cybersecurity, chips, artificial intelligence and IIOT platforms and app. Introducing our Digital Industry Report For Startup Investment With Future Development set of slides. The topics discussed in these slides are Industry Overview, Future Development, Funding Status. This is an immediately available PowerPoint presentation that can be conveniently customized. Download it and convince your audience.
-
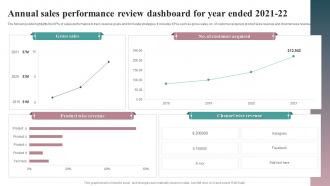 Annual Sales Performance Review Dashboard For Year Ended 2021 22
The following slide highlights the KPIs of sales performance to track revenue goals and formulate strategies. It includes KPAs such as gross sales, no. of customer acquired, product wise revenue and channel wise revenue. Introducing our Annual Sales Performance Review Dashboard For Year Ended 2021 22 set of slides. The topics discussed in these slides are Gross Sales, Product Wise Revenue, Channel Wise Revenue. This is an immediately available PowerPoint presentation that can be conveniently customized. Download it and convince your audience.
-
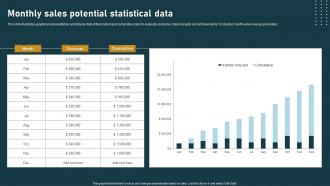 Monthly Sales Potential Statistical Data
This slide illustrates graphical representation and tabular data of forecasted and cumulative sales to evaluate companys future targets and achievements. It includes month-wise revenue generation. Introducing our Monthly Sales Potential Statistical Data set of slides. The topics discussed in these slides are Monthly Sales, Potential, Statistical Data. This is an immediately available PowerPoint presentation that can be conveniently customized. Download it and convince your audience.
-
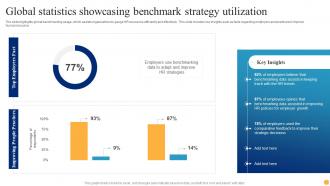 Global Statistics Showcasing Benchmark Strategy Utilization
The slide highlights global benchmarking usage, which assists organizations to gauge HR resources efficiently and effectively. This slide includes key insights such as facts regarding employers and practices to improve. Presenting our well structured Global Statistics Showcasing Benchmark Strategy Utilization. The topics discussed in this slide are Global Statistics, Showcasing Benchmark, Strategy Utilization. This is an instantly available PowerPoint presentation that can be edited conveniently. Download it right away and captivate your audience.
-
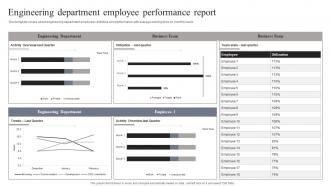 Engineering Department Employee Performance Report
This template covers about engineering department employees activities and performance with average working time on monthly basis. Presenting our well structured Engineering Department Employee Performance Report. The topics discussed in this slide are Engineering Department, Business Team, Employee Performance Report. This is an instantly available PowerPoint presentation that can be edited conveniently. Download it right away and captivate your audience.
-
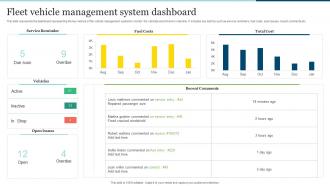 Fleet Vehicle Management System Dashboard
This slide represents the dashboard representing the key metrics of the vehicle management system to monitor the vehicles and drivers in real time. It includes key metrics such as service reminders, fuel costs, open issues, recent comments etc. Presenting our well structured Fleet Vehicle Management System Dashboard. The topics discussed in this slide are Service Reminder, Fuel Costs, Total Cost, Recent Comments. This is an instantly available PowerPoint presentation that can be edited conveniently. Download it right away and captivate your audience.
-
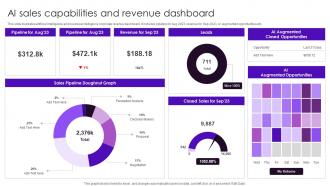 AI Sales Capabilities And Revenue Dashboard
This slide illustrates artificial intelligence and business intelligence corporate revenue dashboard. It includes pipeline for Aug 2023, revenue for Sep 2023, AI augmented opportunities etc. Introducing our AI Sales Capabilities And Revenue Dashboard set of slides. The topics discussed in these slides are Sales Pipeline, Revenue, Closed Sales, Augmented Opportunities. This is an immediately available PowerPoint presentation that can be conveniently customized. Download it and convince your audience.
-
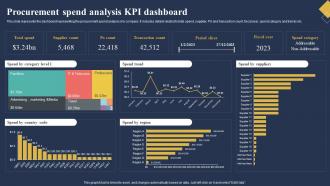 Procurement Spend Analysis KPI Dashboard
This slide represents the dashboard representing the procurement spend analysis of a company. It includes details related to total spend, supplier, PO and transaction count, fiscal year, spend category and trends etc. Introducing our Procurement Spend Analysis KPI Dashboard set of slides. The topics discussed in these slides are Transaction Count, Period Slicer, Spend Category. This is an immediately available PowerPoint presentation that can be conveniently customized. Download it and convince your audience.
-
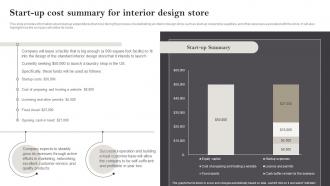 Interior Design Business Plan Start Up Cost Summary For Interior Design Store BP SS
This slide provides information about start-up expenditures that incur during the process of establishing an interior design store, such as start-up ownership, legalities, and other expenses associated with the store. It will also highlight how the company will utilize its funds. Present the topic in a bit more detail with this Interior Design Business Plan Start Up Cost Summary For Interior Design Store BP SS. Use it as a tool for discussion and navigation on Startup Cost Summary, Interior Design Store, Legalities, Marketing, Networking. This template is free to edit as deemed fit for your organization. Therefore download it now.
-
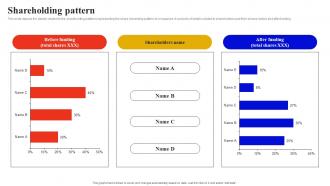 Shareholding Pattern Social Audio Networking Site Investor Funding Elevator Pitch Deck
This slide depicts the details related to the shareholding patterns representing the share ownership pattern of companies. It consists of details related to shareholders and their shares before and after funding Deliver an outstanding presentation on the topic using this Shareholding Pattern Social Audio Networking Site Investor Funding Elevator Pitch Deck. Dispense information and present a thorough explanation of Pattern, Representing, Companies using the slides given. This template can be altered and personalized to fit your needs. It is also available for immediate download. So grab it now.
-
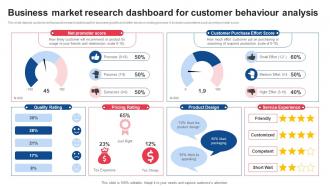 Business Market Research Dashboard For Customer Behaviour Analysis
This slide depicts customer behavioural research dashboard for business growth and better decision making process. It includes parameters such as net promoter score. Introducing our Business Market Research Dashboard For Customer Behaviour Analysis set of slides. The topics discussed in these slides are Net Promoter Score, Pricing Rating. This is an immediately available PowerPoint presentation that can be conveniently customized. Download it and convince your audience.
-
 110 pieces 11x10 rectangular jigsaw puzzle matrix powerpoint templates 0812
This template is skillfully designed and is completely editable to suit all the needs and requirements of the user. The color of the font, its size, style, and all other elements can be customized according to the user's desire The text in the PPT placeholder can be replaced with the desired information making this template highly flexible and adaptable as well. This template is also compatible with various Microsoft versions and formats like Google Slides, JPG, PDF, etc so the user will face no issue in saving it in the format of his choice.
-
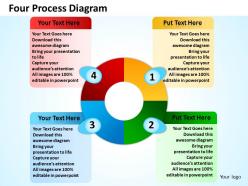 Four process diagram powerpoint templates graphics slides 0712
Market changes can be defined in this diagram in more relevant way.
-
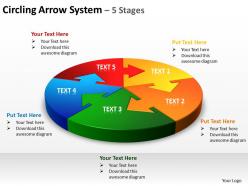 Circling arrow system 5 stages powerpoint diagrams presentation slides graphics 0912
Arrows Indicates the way to growth. Use these diagrams for improved controls to drive your business towards the right direction
-
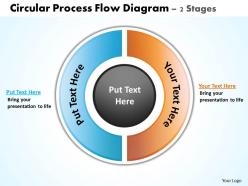 Circular process flow diagram 2 stages powerpoint diagrams presentation slides graphics 0912
Use this graphics to show functional areas will be held accountable for achieving performance metrics established for that area.
-
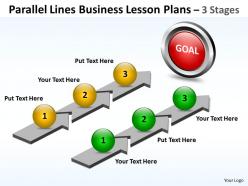 Business Powerpoint Templates Parallel Lines Lesson Plans Sales Ppt Slides
Use this PowerPoint Diagram to explain the parallel Processes occurring in Business. It signifies alongside, coextending, coextensive, coordinate, equidistant, extending equally, in the same direction, lateral, laterally, never meeting, running alongside.
-
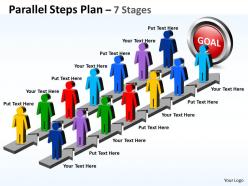 Business Powerpoint Templates Succession Planning Steps Sales Ppt Slides
This Business PowerPoint Diagram Shows the Parallel steps which individually consists of seven stages to achieve the goal. Use this graphic design to represent a continuing sequence of stages, tasks, or events and emphasize the connection between all components.
-
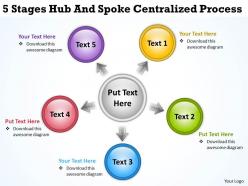 Business flow charts examples 5 stages hub and spoke centralized process powerpoint slides
We are proud to present our business flow charts examples 5 stages hub and spoke centralized process powerpoint slides. This diagram slideshows 5 stages of hub and spoke network. It expands from a central hub concentrically. This diagram is used in economic geography. Our PPT images are so perfectly designed that it reveals the very basis of our PPT diagrams are an effective tool to make your clients understand.
-
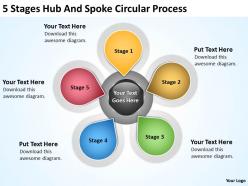 Business flow charts examples 5 stages hub and spoke circualr process powerpoint slides
We are proud to present our business flow charts examples 5 stages hub and spoke circualr process powerpoint slides. This diagram shows five factors to attain success which are placed in a circular manner with a hub in center. Project them to your colleagues in your own immaculate way. Transmit to them your belief in the profitability of your plans.
-
 Business flow charts examples 6 stages cause and effect diagram powerpoint slides
We are proud to present our business flow charts examples 6 stages cause and effect diagram powerpoint slides. Business PowerPoint diagram is suitable for displaying contexts, relations and individual steps of a concept or consecutive items. This diagram demonstrates to your audience how the best and most refined ideas pass through.
-
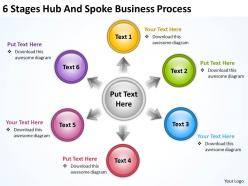 Business process model diagram 6 stages hub and spoke powerpoint slides
We are proud to present our business process model diagram 6 stages hub and spoke powerpoint slides. The above PowerPoint diagram contains an image of multicolored circular chart with six spokes and a hub in center. Use this diagram to focus attention on important spoken points.
-
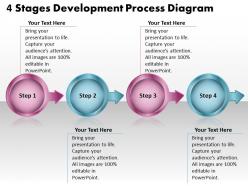 4 stages development process diagram flowchart free powerpoint templates
We are proud to present our 4 stages development process diagram flowchart free powerpoint templates. This development process chart-is an excellent tool for clearly displaying process flows across organizational boundaries and identifying delays, repetitive steps, excessive control points, specialized tasks, and potential points of process failure.
-
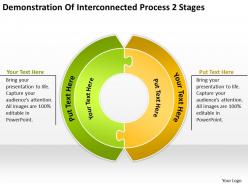 Diagram of the business cycle demonstration interconnected process 2 stages powerpoint templates
We are proud to present our diagram of the business cycle demonstration interconnected process 2 stages powerpoint templates. This slide helps you to give your team an overview of your capability and insight into the minute details of the overall picture highlighting the interdependence at every operational level.
-
 How to draw business process diagram 6 blocks of structured data powerpoint slides
We are proud to present our how to draw business process diagram 6 blocks of structured data powerpoint slides. The above PowerPoint diagram displays an image of multicolored six blocks interconnected to each other. This diagram illustrates connections between various elements of business or educational or management processes, etc. Create captivating presentations to deliver comparative and weighted arguments.
-
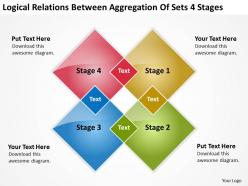 Business process flowchart logical relations between aggregation of sets 4 stages powerpoint slides
We are proud to present our business process flowchart logical relations between aggregation of sets 4 stages powerpoint slides. The above PowerPoint template displays a stunning image of Venn diagram. This diagram analyzes variety and dependence of factors. Use this diagram for statistics, business processes, process phases, business management, management methods and logical sequence. You can change color, size and orientation of any icon to your liking.
-
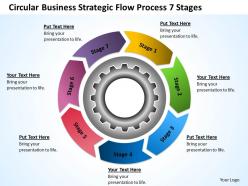 Business model diagram examples process 7 stages powerpoint templates ppt backgrounds for slides
We are proud to present our business model diagram examples process 7 stages powerpoint templates ppt backgrounds for slides. Develop competitive advantage with our above template. This Business diagram is a high level description of the information flows associated with a given activity.
-
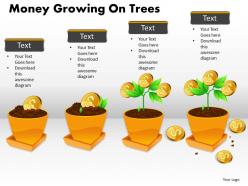 Money growing on trees ppt 5
This template is skillfully designed and is completely editable to suit all the needs and requirements of the user. The color of the font, its size, style, and all other elements can be customized according to the user's desire The text in the PPT placeholder can be replaced with the desired information making this template highly flexible and adaptable as well. This template is also compatible with various Microsoft versions and formats like Google Slides, JPG, PDF, etc so the user will face no issue in saving it in the format of his choice.
-
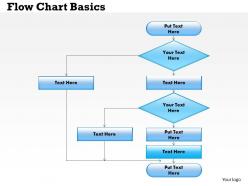 0514 flow chart basics powerpoint presentation
We are proud to present our 0514 flow chart basics powerpoint presentation. This basic flow chart diagram can be used to explain sequence of any process for business or sales. Use this template and enhance your vision of presentation. You can create memorable and attractive PowerPoint presentations with this professionally designed slide.
-
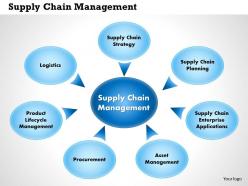 0514 supplier chain management powerpoint presentation
Graphics do not pixelate when opened on a wide screen display. Access to edit the content and the slide icons. Replace the images or icons with your own. Prompt downloading and saving allowed. Use theme colors to make it more attractive. Compatible with Google Slides and Microsoft Office. Valuable for the distributers, sales and marketing employees, employers and the financers.
-
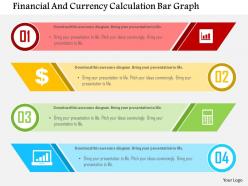 Financial and currency calculation bar graph flat powerpoint design
We are proud to present our financial and currency calculation bar graph flat powerpoint design. This power point template diagram has been crafted with graphic of bar graph. This PPT diagram contains the concept of financial and currency calculation. Use this PPT diagram for business and finance related presentations.
-
 Four house icons for real estate flat powerpoint design
We are proud to present our four house icons for real estate flat powerpoint design. Graphic of four house icons has been used to design this power point template diagram. This PPT diagram contains the concept of real estate growth. Use this PPt diagram for business and marketing related presentations.
-
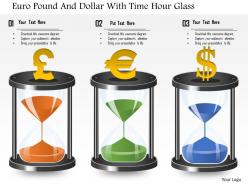 Euro pound and dollar with time hour glass powerpoint template
We are proud to present our euro pound and dollar with time hour glass powerpoint template. Graphic of euro, pound and dollar with hour glass has been used to craft this power point template diagram. This PPT diagram contains the concept of time management. Use this PPT diagram for business and management related presentations.
-
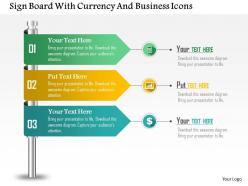 Sign board with currency and business icons powerpoint template
We are proud to present our sign board with currency and business icons powerpoint template. Concept of business growth been displayed in this power point template diagram. This PPT diagram contains the graphic of four text boxes signboard. Use this PPT diagram for business and finance related presentations.
-
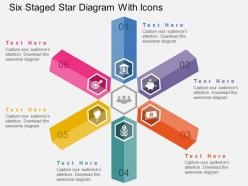 Qp six staged star diagram with icons flat powerpoint design
Presenting qp six staged star diagram with icons flat powerpoint design. Six staged star diagram with icons has been used to design this power point template diagram. This PPT diagram contains the concept of business process indication. Use this PPT diagram for business and marketing related presentations.
-
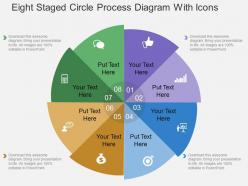 Ex eight staged circle process diagram with icons flat powerpoint design
Presenting ex eight staged circle process diagram with icons flat powerpoint design. Eight staged circle process diagram with icons has been used to craft this power point template diagram. This PPT diagram contains the concept of process flow indication. Use this PPT diagram for business and marketing related presentations.
-
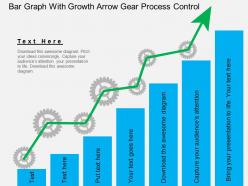 Ga bar graph with growth arrow gear process control flat powerpoint design
Presenting ga bar graph with growth arrow gear process control flat powerpoint design. This Power Point template diagram has been crafted with graphic of bar graph and growth arrow. This PPT diagram contains the concept of process control and growth indication. Use this PPT diagram and build a quality presentation.
-
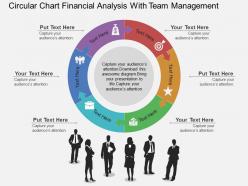 Qe circular chart financial analysis with team management flat powerpoint design
Presenting qe circular chart financial analysis with team management flat powerpoint design. This Point Point template diagram has been crafted with graphic of circular chart. This PPT diagram contains the concept of financial analysis and team management. This PPT diagram can be used for business and finance related presentations.
-
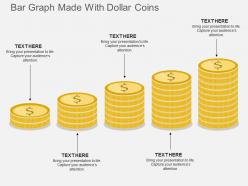 Ka bar graph made with dollar coins flat powerpoint design
Presenting ka bar graph made with dollar coins flat powerpoint design. This Power Point template diagram has been crafted with graphic of bar graph made with dollar coins diagram. This PPT diagram contains the concept of financial result analysis .Use this PPT diagram for business and finance related presentations.
-
 Business plan for event management powerpoint slide ideas
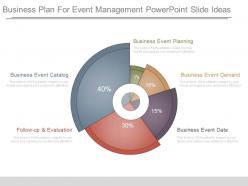
Presenting business plan for event management powerpoint slide ideas. This is a business plan for event management powerpoint slide ideas. This is a five stage process. The stages in this process are business event planning, business event demand, business event date, follow up and evaluation, business event catalog.
-
 Insurance claim process approach document verification approved rejected
Presenting this set of slides with name - Insurance Claim Process Approach Document Verification Approved Rejected. This is a seven stage process. The stages in this process are Insurance Claim Process, Insurance Claim Steps, Insurance Claim Procedure.
-
 Insurance claim process intimation document verification approved rejected
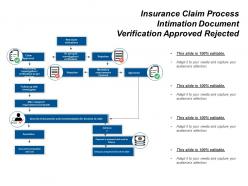
Presenting this set of slides with name - Insurance Claim Process Intimation Document Verification Approved Rejected. This is a four stage process. The stages in this process are Insurance Claim Process, Insurance Claim Steps, Insurance Claim Procedure.
-
 Working capital management and gross working capital
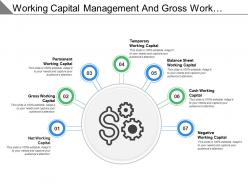
Presenting this set of slides with name - Working Capital Management And Gross Working Capital. This is a seven stage process. The stages in this process are Working Capital Management, Financial Capital, Companys Managerial Accounting.
-
 Investment slide icon showing dollar sign with gear
Presenting this set of slides with name - Investment Slide Icon Showing Dollar Sign With Gear. This is a four stage process. The stages in this process are Investment Slide, Mutual Funds, Funds To Buy.
-
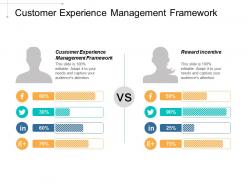 Customer experience management framework reward incentives effective management teams cpb
This is an editable two stages graphic that deals with topics like Customer Experience Management Framework, Reward Incentives, Effective Management Teams to help convey your message better graphically. This product is a premium product available for immediate download, and is 100 percent editable in Powerpoint. Download this now and use it in your presentations to impress your audience.
-
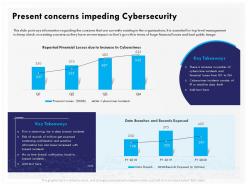 Present concerns impeding cybersecurity financial ppt gallery
This slide portrays information regarding the concerns that are currently existing in the organizations. It is essential for top level management to keep check on existing concerns as they have severe impact on firms growth in terms of huge financial losses and bad public image. Presenting this set of slides with name Present Concerns Impeding Cybersecurity Financial Ppt Gallery. The topics discussed in these slides are Present Concerns Impeding Cybersecurity. This is a completely editable PowerPoint presentation and is available for immediate download. Download now and impress your audience.


