

 Customer Reviews
As you introduce more products and services to the market, some of these will naturally turn out to be less profitable than others. This result is innate to any product catalog and all businesses expect it as well.
Finally, the company may have to stop promoting products that offer it a lower profit margin. Managers may even order a reduction in production or recommend that the item be dropped altogether.
Having taken this decision, it will seem like the time and money spent on Research and Development (R&D) for these products was a huge waste. The question then is how should a company minimize such wastage?
The answer is a BCG (Boston Consulting Group) matrix.
BCG Matrix: A Brief Introduction
The BCG matrix is a business tool that was developed in the early 1970s by Bruce Henderson. It is used to make decisions about which products or services to discontinue, which products or services to invest in, and how to allocate resources among them. It can be helpful for organizations that are trying to decide whether to focus on becoming a product company or a service company.
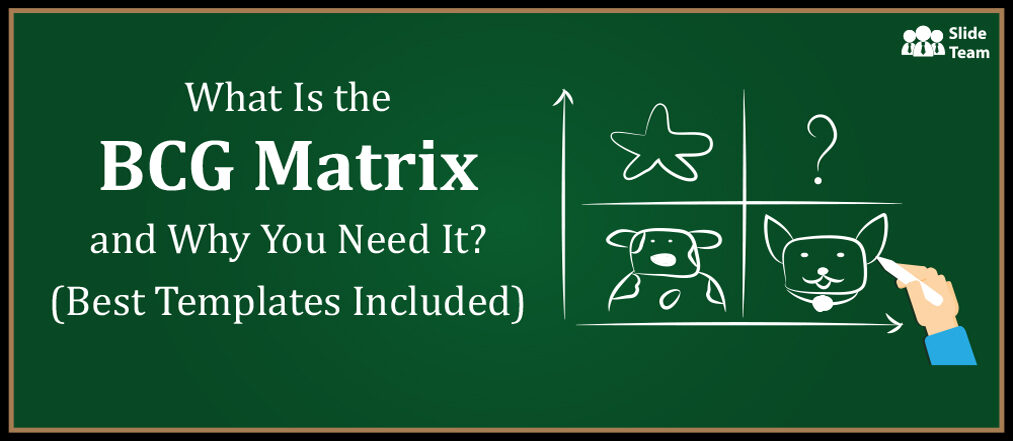
The matrix is divided into four quadrants, based on a company's market share and its growth rate.

A Typical BCG Matrix
The first quadrant is called "stars," and includes products with high market shares and high growth rates. These products are the most profitable and need to be invested in.
The second quadrant is called "cash cows." These products have high market shares but low growth rates. They are profitable, but not as much as the stars, so they should be milked for all they're worth.
The third quadrant is called "question marks." These are products with low market shares and high growth rates. They could be potential stars, or they could become cash cows. More research is needed to determine their fate.
The fourth quadrant is called "dogs." These are products with low market shares and low growth rates. They should be phased out or sold off.
The decision to start or stop investing in a product or service is not a laughing matter. The decision has to be based on empirical data than mere hunches or guesses.
It is crucial to have analyzed the data thoroughly. A BCG matrix requires this pertinent information and the right medium is needed to finally communicate the results with the relevant decision-makers. This medium is a PowerPoint presentation made with our BCG Matrix templates.
Editable BCG Matrix To Optimize Your R&D Efforts
When conducting BCG analysis, the aim is to be error-free. This can be hard if you also have to worry about the design and style of your PowerPoint presentation. A premade bcg matrix templates deck will take away this worry. Not just that, as the templates come with relevant charts, tables, graphics, etc, it will only make this decision-making process easier for the company.
We have chosen 10 accurately designed BCG Matrix templates that will quickly become integral to your operations. Let’s take a look!
Template 1: BCG Matrix Market Growth PPT Slide
This PPT design will help you illustrate your product or service's placement in the market and highlight its potential for growth. The slide plots each product on a matrix based on market share and market growth. With this PowerPoint layout, you can make informed decisions about where to focus your energy in order to maximize sales. So download it now.

Template 2: BCG Growth-Share Matrix Example PPT
This PowerPoint preset shows you how to best allocate your resources so that you can achieve maximum success. It will help you understand how to create a growth-share matrix for your own business. With its easy-to-use format and clear instructions, this PPT theme is a must-have for any business owner looking to improve their bottom line. So employ it now.

Template 3: BCG Matrix Model For Market Entry Analysis
This PPT deck offers examples of the BCG Matrix in action, along with helpful tips for using the tool. It is perfect for business owners and entrepreneurs who want to create a winning marketing strategy. You will also be able to add appropriate comments regarding interpretations from the output. So incorporate it now.

Template 4: BCG Competitive Positioning Chart PPT Slide
This creative Powerpoint set is a great tool for understanding and comparing the competitive positioning of various brands in the fast-moving consumer goods market. The chart plots various brands on two axes: market share and differentiation. It showcases the comparison in terms of market share, revenue, and more. So utilize it now.

Template 5: BCG Bubble Matrix Including Market Growth Rate
This PPT preset allows users to track the progress of their competitors and make adjustments to their own business plans accordingly. It tracks the brands on two axes namely, market growth rate and relative market share. This PowerPoint template will help you make the most informed investment decisions possible. So choose it now.

Template 6: BCG Product Portfolio Matrix PPT Slide
This PPT theme is perfect for businesses that wish to map their product offerings and understand their competitive landscape. This PowerPoint layout allows you to create a matrix that displays your products on the y-axis and your competitors on the x-axis. It will help you visualize and analyze your products like never before. So get it now.

Template 7: BCG Matrix Powerpoint Slide Background Designs
With this Powerpoint theme, you can add a fun and engaging element that will capture your audience's attention. It is perfect for illustrating the different stages of a product's life cycle and makes it easy to compare products and strategies. It will add impact and visual interest to any presentation while also illustrating important concepts and ideas. Download it now.

Template 8: Market Share BCG Matrix
This PPT theme visualizes and analyzes the product lines of a company. It can be used for brand marketing, product management, strategic management, and portfolio analysis. This PowerPoint preset is efficient and produces only those products that have a huge demand. So download it now.

Template 9: BCG Matrix Powerpoint Slide
This PowerPoint deck allows you to visualize the relative market share and potential of each product. With this PPT template, you can quickly assess the financial resources needed to sustain a product's growth. You can also use it to formulate a digital marketing strategy and assess your brand's investment in various channels. So incorporate it now.

Template 10: 4 Box BCG Market Growth Share Grid
This PPT layout is a great tool for assessing the growth potential of your products. It helps you identify opportunities and make strategic decisions about where to focus your resources. Some of these decisions are to hold, build, harvest, and divert with respect to the products and resources. So download it now.

Conclusion
Not all products or services will turn out to be a success with consumers. Some of the company's choices will turn out to be duds. That much is certain. But that can’t stop the business from making informed decisions about the future of what to produce and how much.
BCG matrix templates will help you and your colleagues make well-informed decisions. Use these PPT designs and let us know in the comments below how they helped in improving the decision-making process in your firm.
P.S: Check out this all-encompassing guide to the AIDA model to better understand and motivate consumer behavior.