DuPont Analysis is a technique used to assess a company’s overall profitability and financial health. In the method, the drivers of Return on Equity (RoE) are used to calculate a ratio, which provides us with information on the source of the bottom line (profits) and specific areas where improvement is needed.
The DuPont Analysis is also used to identify areas of a company’s business that may be underperforming, and to benchmark financial performance against competitors. This allows investors, too, to prioritize Key Performance Indicators (KPIs).
Raw financial data and the results of the DuPont Analysis need to be presented in a cogent way to stakeholders. A PowerPoint presentation is best, but tabulating the data and creating graphs from it can be a time-intensive task.
We present this PowerPoint deck with all the templates that you will need to provide a detailed, yet easy-on-the-eye presentation of DuPont Analysis for your shareholders. Each slide has the tools to explain a particular aspect of the DuPont Model, in order of presentation.
Slide 1: The Title - Know Me Better
Start on the right note and introduce the audience to what they have to look forward to. Beneath the title, add the number of slides to prime your audience, and help them indulge in a guesstimate on the duration of the presentation.
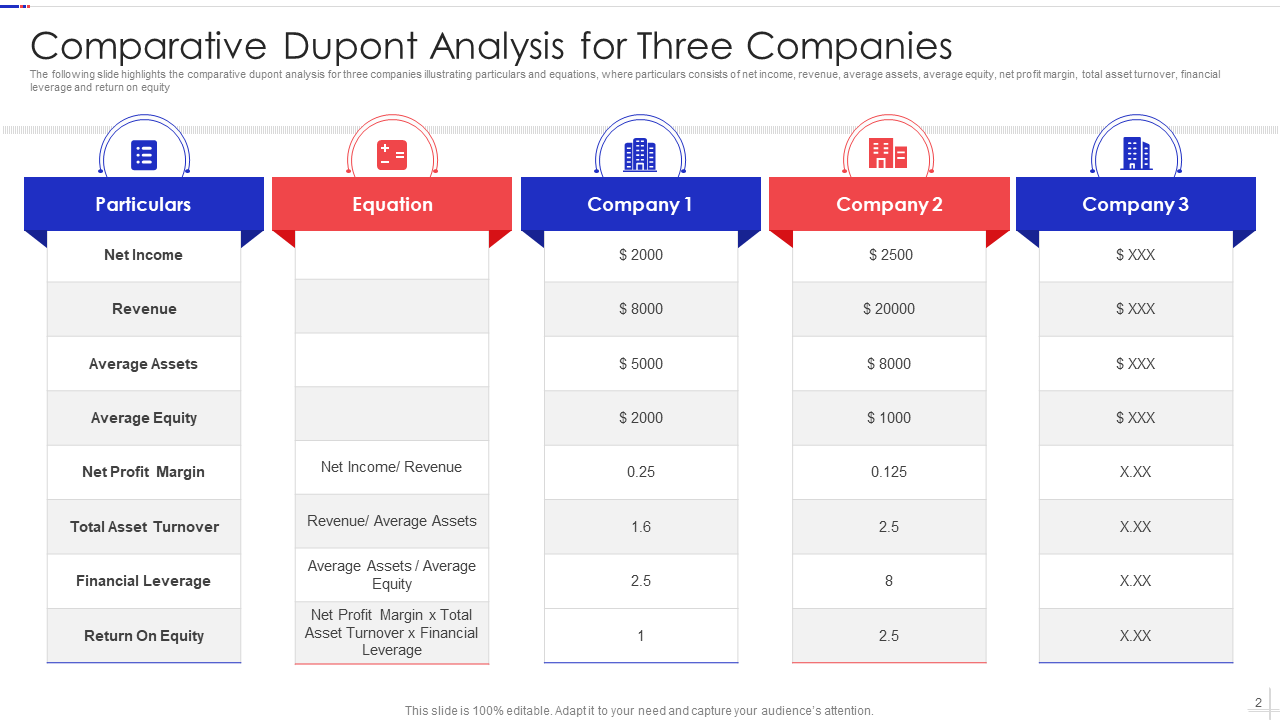
Slide 2: Comparative DuPont Analysis
This template is used to present the comparison between three companies in terms of net income, revenue, average assets, etc. The comparison vectors are divided into - specific equations and numbers.
Slide 3: Components of DuPont Model of Three Steps
This template is used to present the three essential parts of the DuPont analysis namely, Profit Margin, Total Asset Turnover, and financial leverage. The subcomponents of each are also on the slide.
Slide 4: Components of DuPont Model of Five Steps
This template allows you to showcase a five-step analysis. These steps include Tax Burden, Total Asset Turnover, Financial Leverage, Interest Burden, and Operating Margin. The definition and formulas for these steps are on the slide.
Slide 5: Comparative DuPont Analysis with RoE
Tabulate the financial indicators for five or more companies for a particular year using this design. Among the indicators is the Return on Assets, Return on Equity, Net Margin, and more.
Slide 6: Quarterly DuPont Analysis
Compare the results of the DuPont model on a quarterly basis with this table. Profit Margin, Asset Turnover, Equity Multiplier, and RoE are some factors considered.
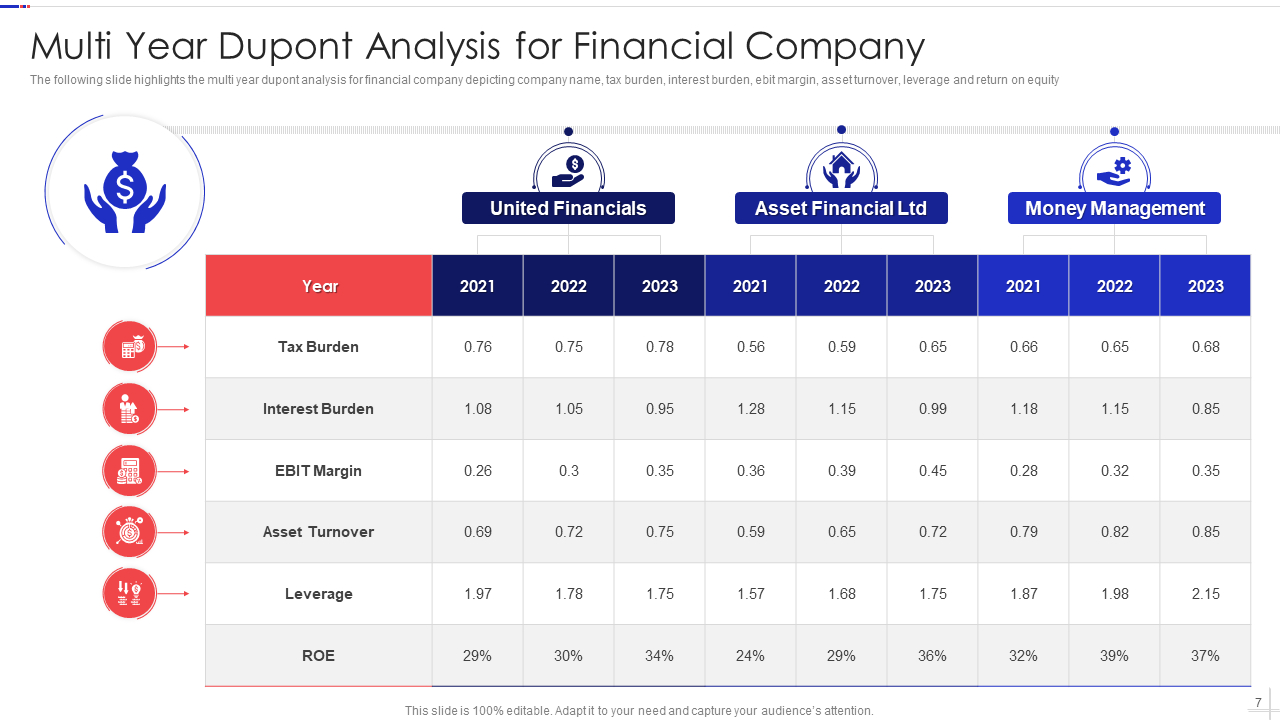
Slide 7: Multi-Year DuPont Analysis
Display the results of multi-company, multi-year DuPont Analysis with this PPT slide to showcase the RoE for each.
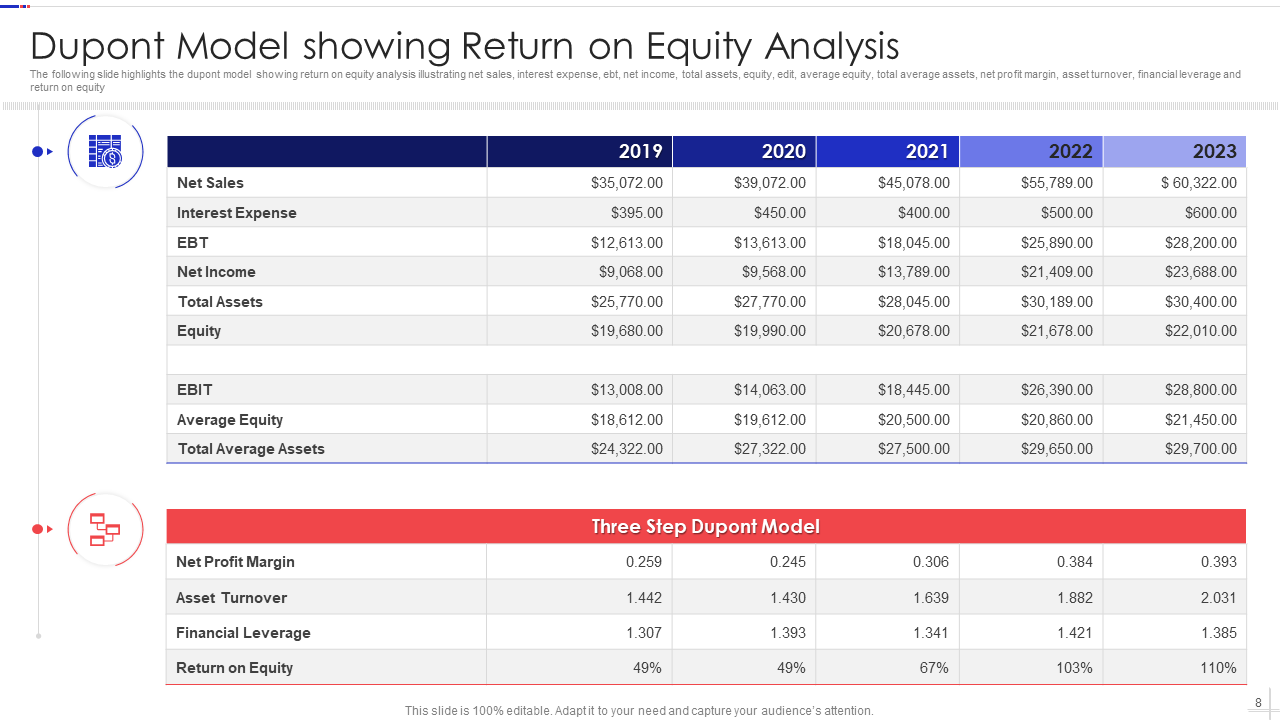
Slide 8: RoE Analysis
The template showcases tables to represent the results of a DuPont Model as applied to gain results for a number of years and a three-step analysis. The goal of both models is to discuss the RoE.
Slide 9: Time Series DuPont Analysis
Present the RoE for a series of consecutive years using this PPT theme.
Slide 10: Five-step DuPont Analysis for RoE Analysis
Similar to slide number eight, this template showcases two tables with the second one used to present a five-step DuPont Model.
Slide 11: Icon for DuPont Analysis
The PPT bundle of templates presented is editable, ensuring that you may mold and use the additional icons provided in this slide.
Slide 12: You Can Never Have Too Many Icons
Another slide to provide you with the icons you might need to make your presentation catchier. Again, each element within the slides is 100% editable. Earmarked space, based on best design practices, is also provided to add more content, which you may execute after adding more slides.
Slide 13: Curtain Call with a Thank You
There is no better way to end a presentation than appreciating members of the audience for their time. If time permits, please open the floor to questions.
DuPont Analysis: The What, the Why, and the How
DuPont analysis helps us get empirical evidence on a company’s overall financial health. The DuPont equation breaks down Return on Equity (RoE) into three component ratios:
The first component, Profit Margin, measures a company’s ability to generate profits from its sales.
The second component, Asset Turnover, measures a company’s efficiency in using its assets to generate sales.
The third component, Equity Multiplier, measures a company’s financial leverage.
How Do You Conduct a DuPont Analysis?
To conduct a DuPont analysis, you need to gather financial information on your company from its balance sheet, income statement, and cash flow statement. This information can be found in your company’s annual report or on its website.
Once you have this information, you will need to calculate the following ratios:
- Return on equity (RoE): This ratio measures how much profit a company generates for each dollar of shareholder equity. To calculate this number, you will need to divide a company’s net income by its shareholders’ equity.
- Return on assets (RoA): This ratio measures how much profit a company generates for each dollar of assets. For this, you have to divide a company's net income by its total assets.
- Asset turnover: This ratio measures how efficient a company is in using its assets to generate sales. To calculate asset turnover, you will need to divide a company’s sales by its total assets.
Once you have calculated these ratios, you will need to multiply them to get the DuPont formula:
RoE = RoA X Asset Turnover
This formula will give you a company's overall RoE.
Advantages of DuPont Analysis
- One of the main advantages of DuPont analysis is that it puts the spotlight on areas where a company may be underperforming.
For example, if a company has a low RoE, it may be due to a lack of profitability. By looking at the components of RoE, managers can pinpoint where the problem lies and take steps towards improvement.
- Another advantage of DuPont analysis is that it can be used to compare a company’s financial performance to that of its competitors.
For example, if a company has a higher RoE than its competitors, it may be because it is more efficient in its use of resources.
- Finally, DuPont analysis can be used to forecast a company’s future performance. By seeing RoE in this light, managers can identify trends and predict financial performance. This information can be helpful in making decisions about investment and other strategic decisions.
The DuPont Model is a powerful tool for financial analysis, but it has a few limitations. The model does not take into account a company’s tax obligations. Another limitation is that the model does not consider a company's growth prospects.
Despite this, however, the DuPont Model is a valuable tool for financial analysis and should be part of any investor’s due diligence process.
Applications of DuPont Analysis
A common use for DuPont Analysis is to help identify a company's key drivers of profitability. By looking at how different factors affect the RoE, businesses can get a better understanding of what is most important to their bottom line. This information can then be used to make decisions about pricing, product development, and marketing. Additionally, DuPont Analysis can be used to benchmark a company's performance against its competitors.
DuPont analysis can also be used for financial performance as more informed decisions are made on resource allocation. Additionally, DuPont analysis can be used to assess the impact of changes in business strategy. By looking at how different strategies affect the RoE, businesses can get a better understanding of which ones are likely to be more successful.
Finally, it can also be used to help educate employees on the financial health of a company. Managers can communicate their financial goals to employees and define their priority areas. This also ensures that the entire team, irrespective of departments, is pulling in the same direction.
With this information, you will be able to understand, educate, and leverage DuPont Analysis as a tool to define priorities and improve business performance.
PS: To access the tools to keep track of every penny going in and out of the business, check out our resourceful blog with templates included.


 Customer Reviews


![The Superfast Guide to Break-Even Analysis [PPT Templates Included] [Free PDF Attached]](https://www.slideteam.net/wp/wp-content/uploads/2022/06/1013x441no-button-1-493x215.gif)


