Please your audiences by enhancing info graphic bar charts with animation effects. Animation effects can go a long way in engaging audience’s interest towards your presentation. Showcase cluttered bar charts creatively with the right animation.
Animated info graphic bar chart is popular among business presentations. Work around with this bar chart and give life to your presentations.
Take a look at the below video:
Info graphic bar charts can be very well explained through animations without boring the audience.
Let us show you how to apply animation to a bar chart.
First and foremost, insert bar chart. Browse unlimited collection of professionally designed bar charts here.
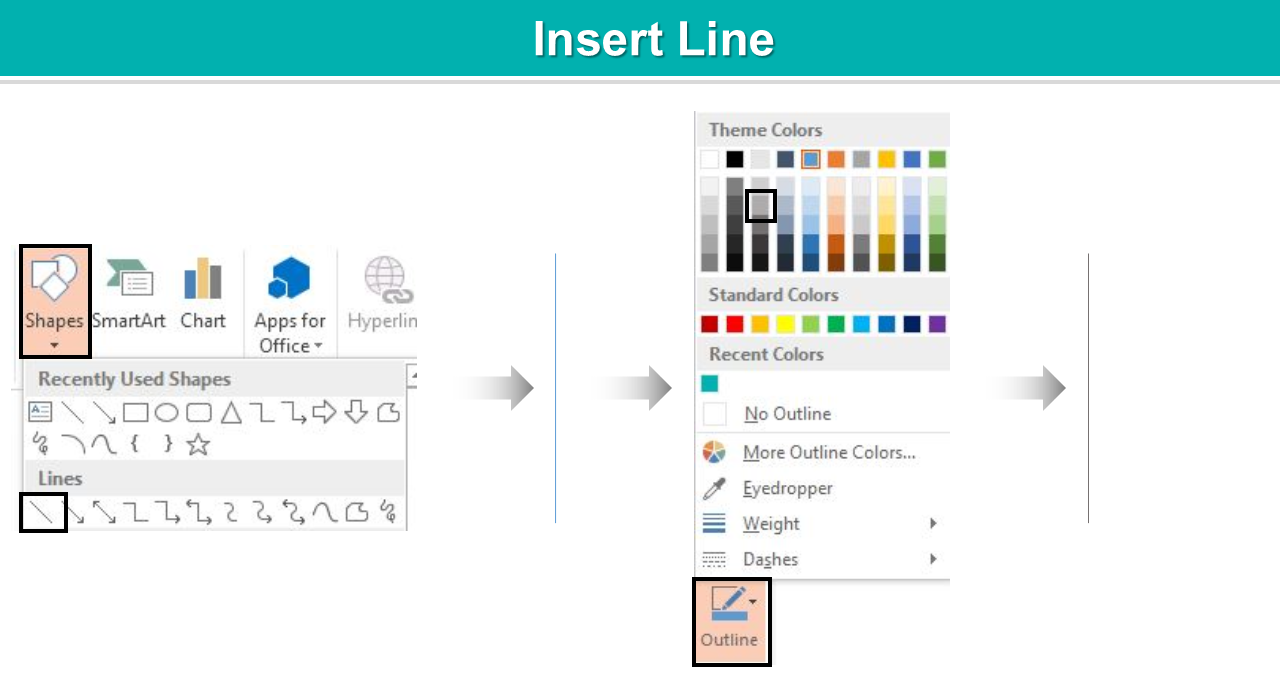
If you wish to create it then go to Shapes> Lines> Line. Right click the line> Outline> Choose Color.
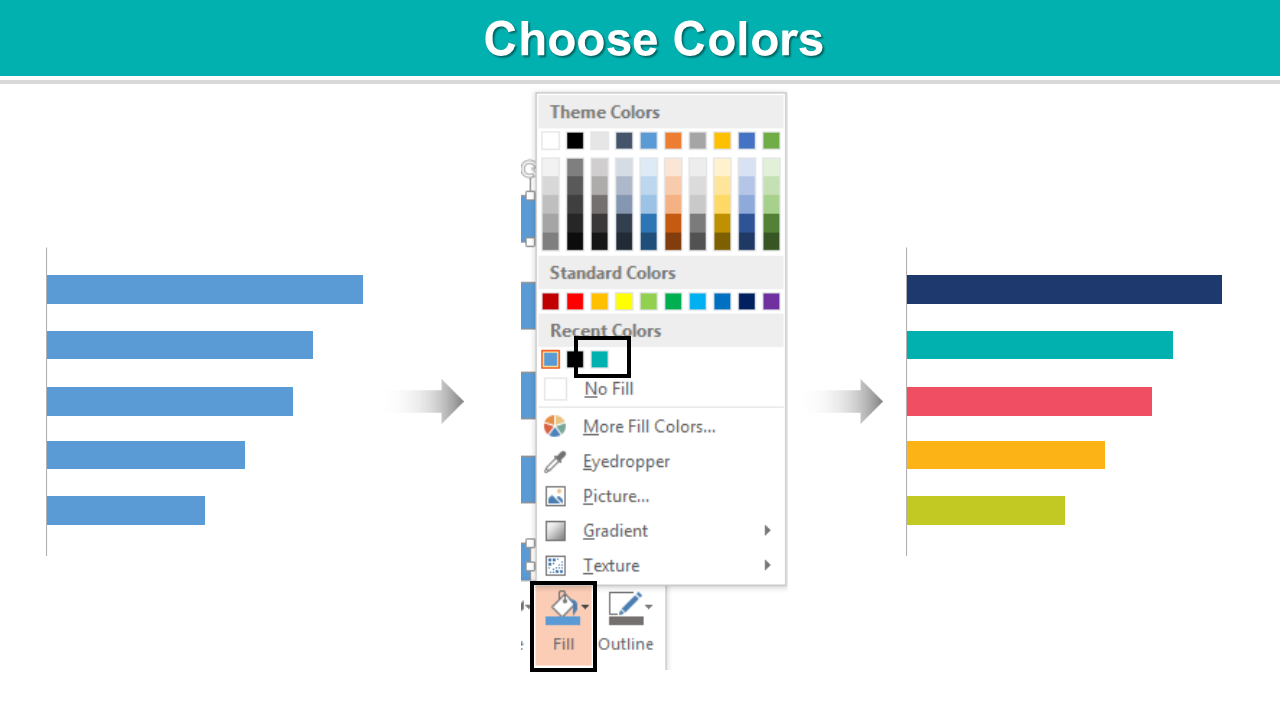
Choose Shapes> Rectangles> Rectangle. Insert 4 to 5 rectangular shapes to make a bar chart.
Right click the shapes> Fill> Choose Color.
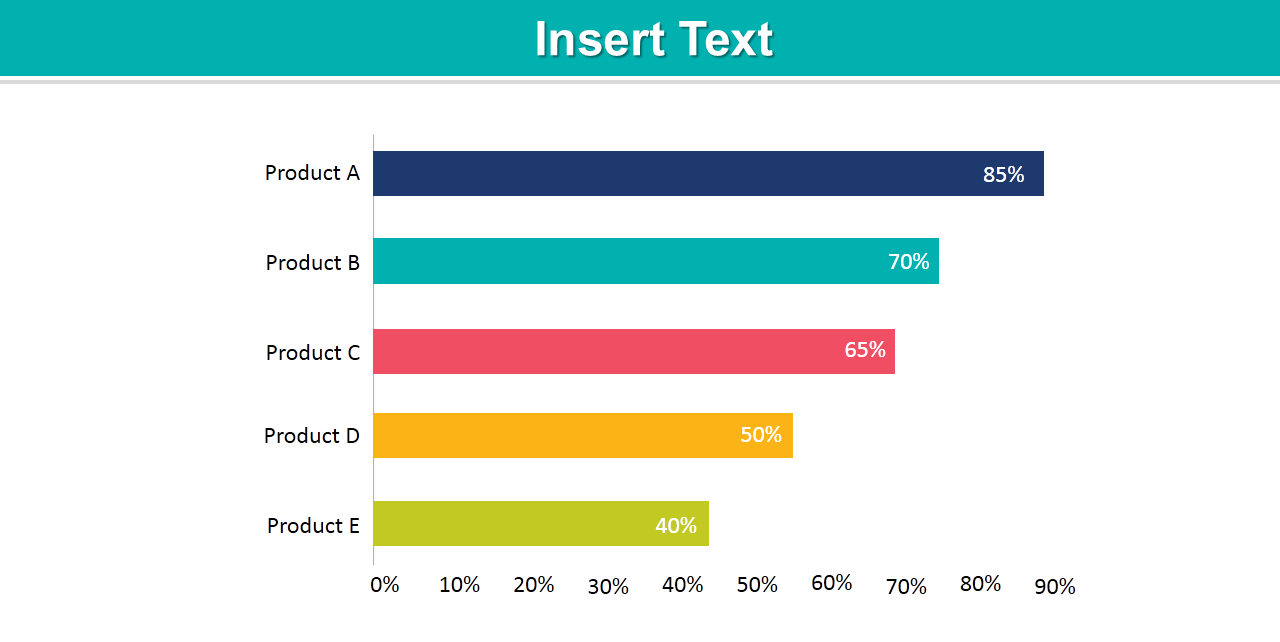
Put your text on the X and Y axis.
Let’s apply animation:
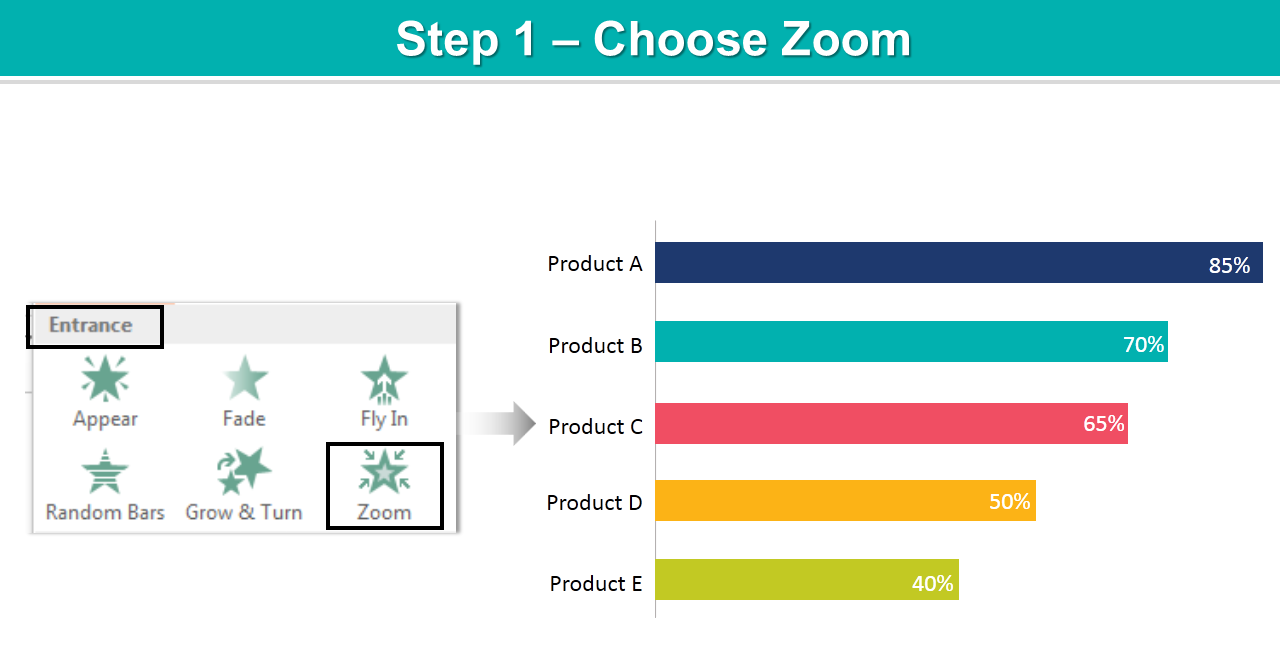
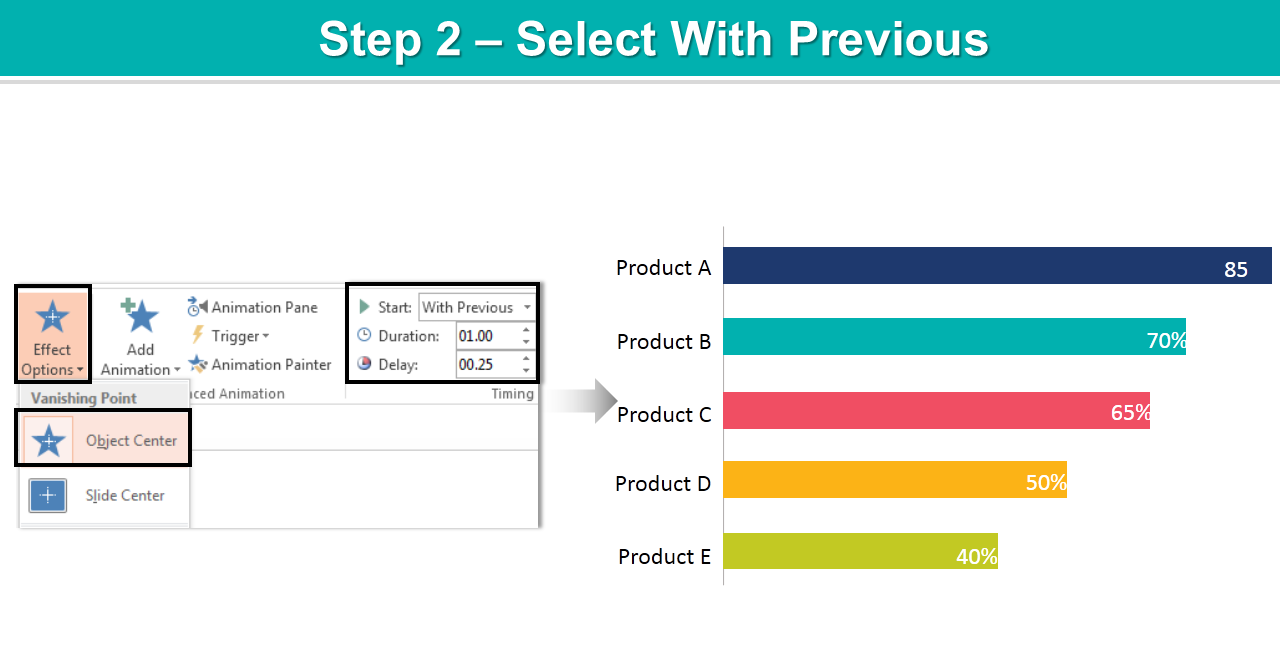
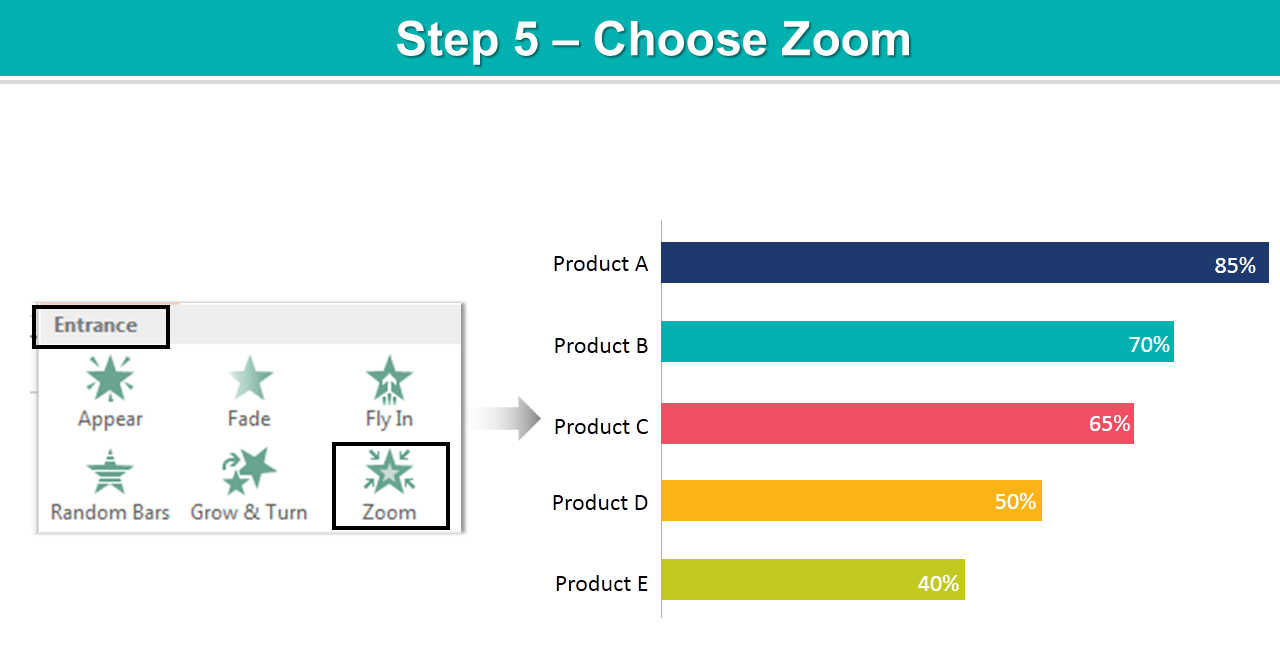
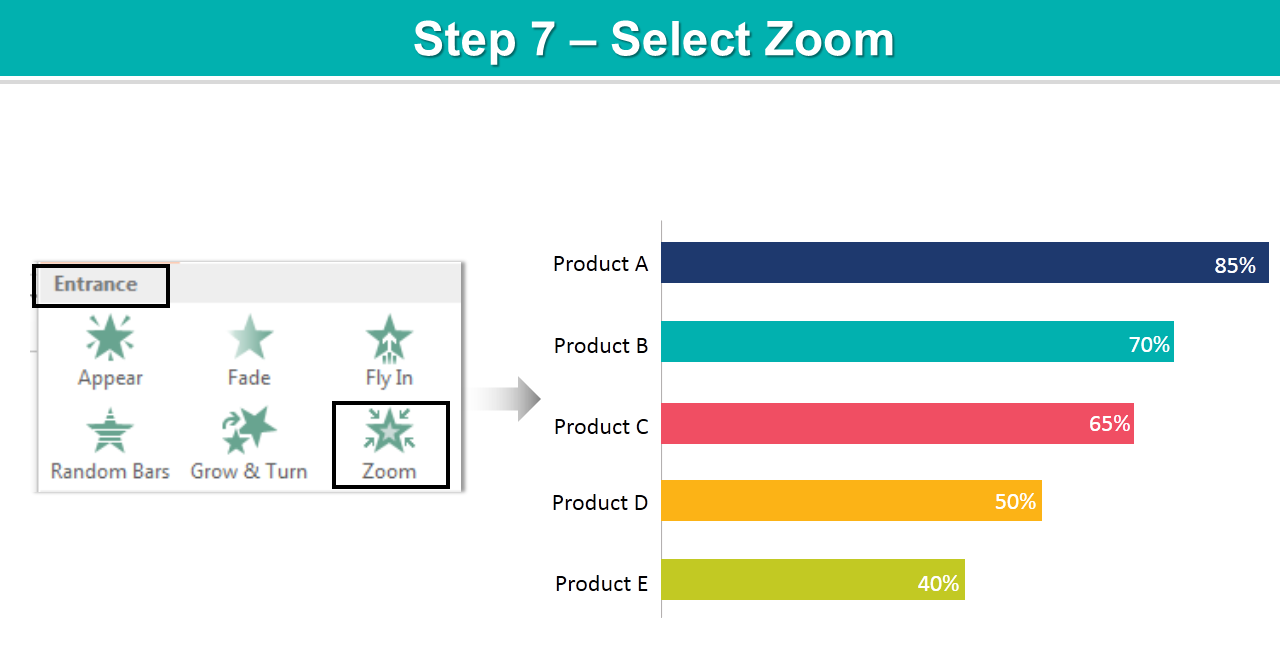
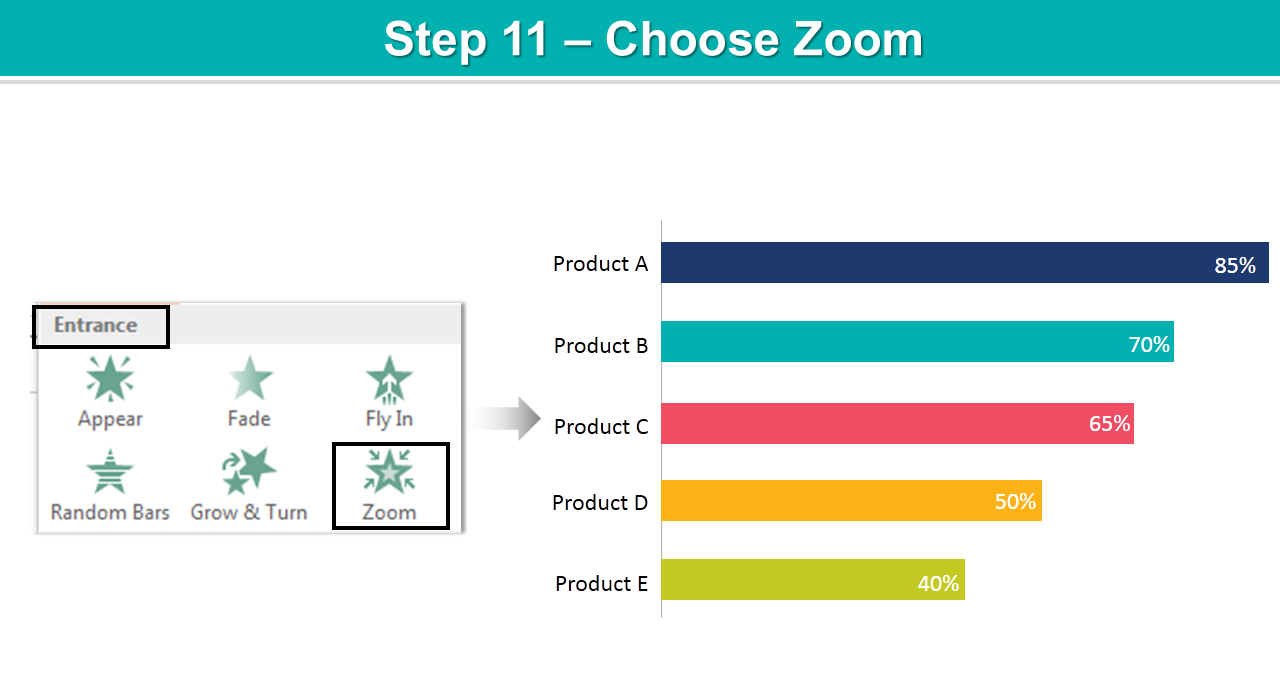
- Choose text box (product A)> Animation> Zoom.
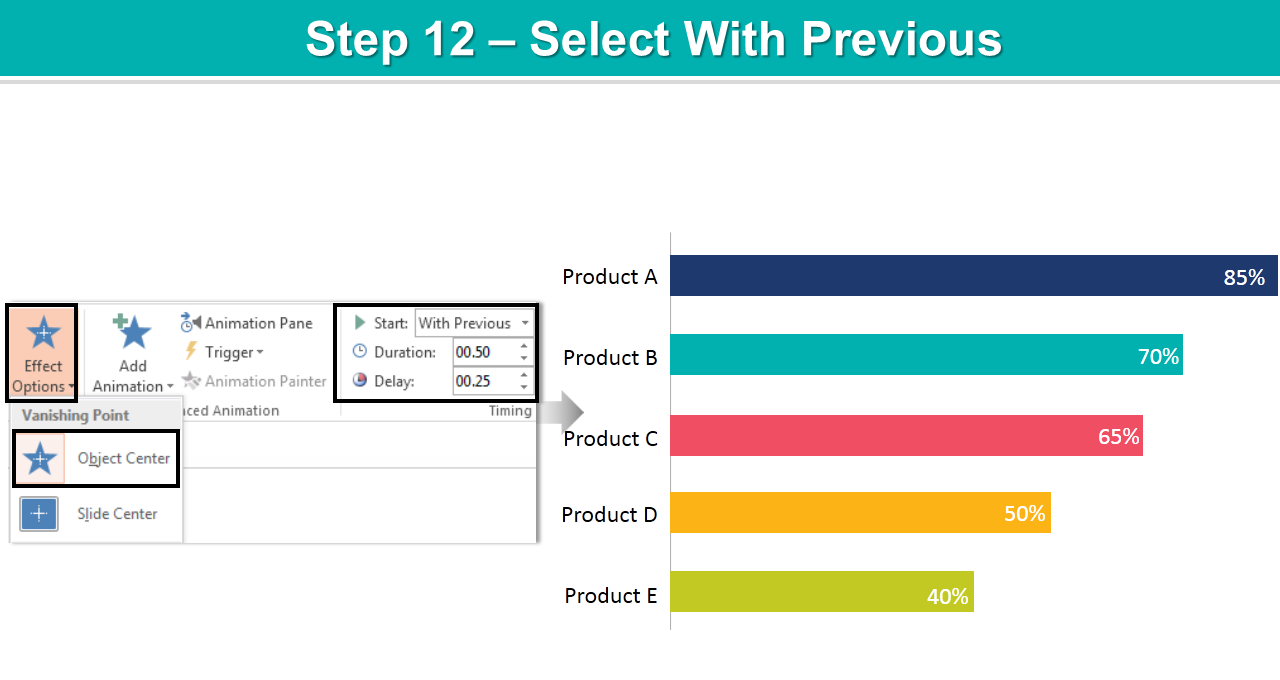
- Select Object Center>With Previous> Duration> 00> Delay> .25 sec.
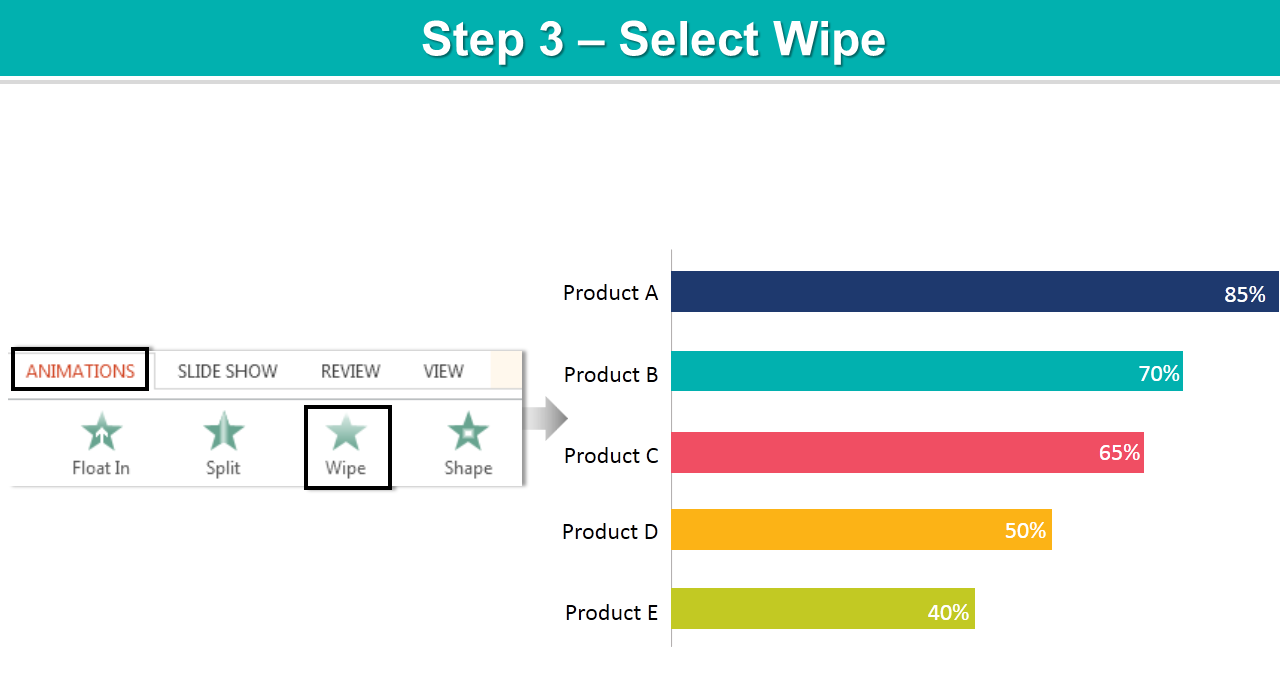
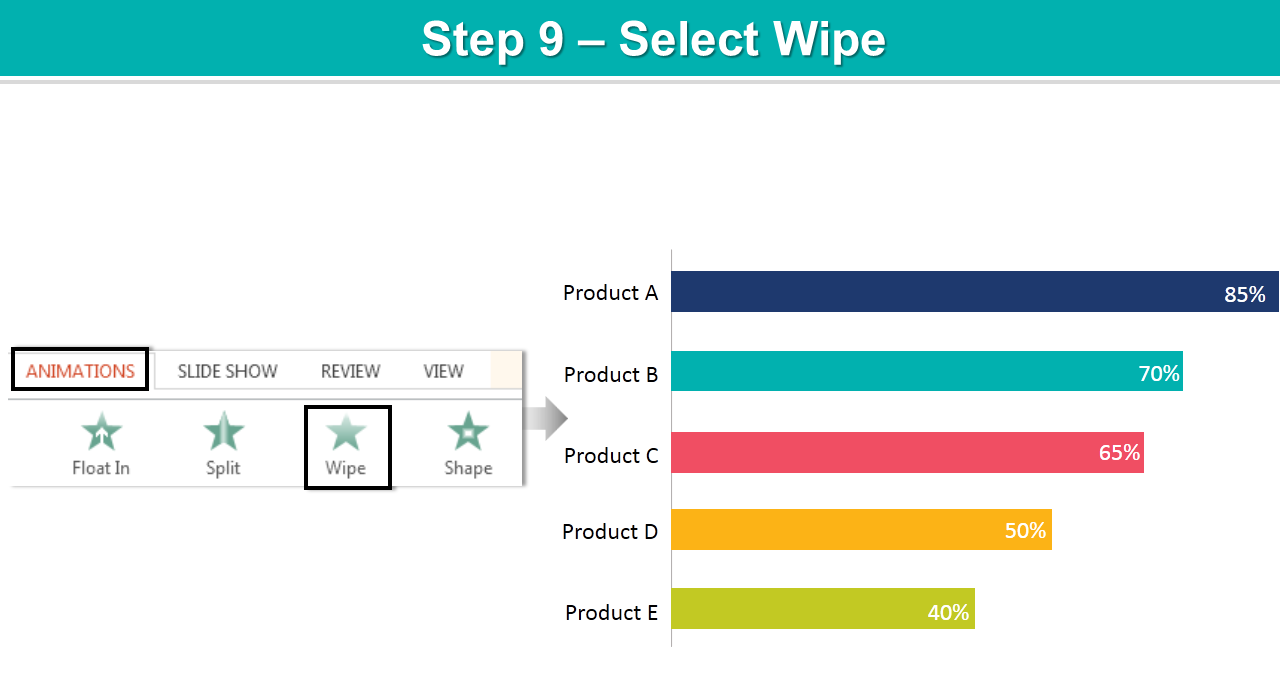
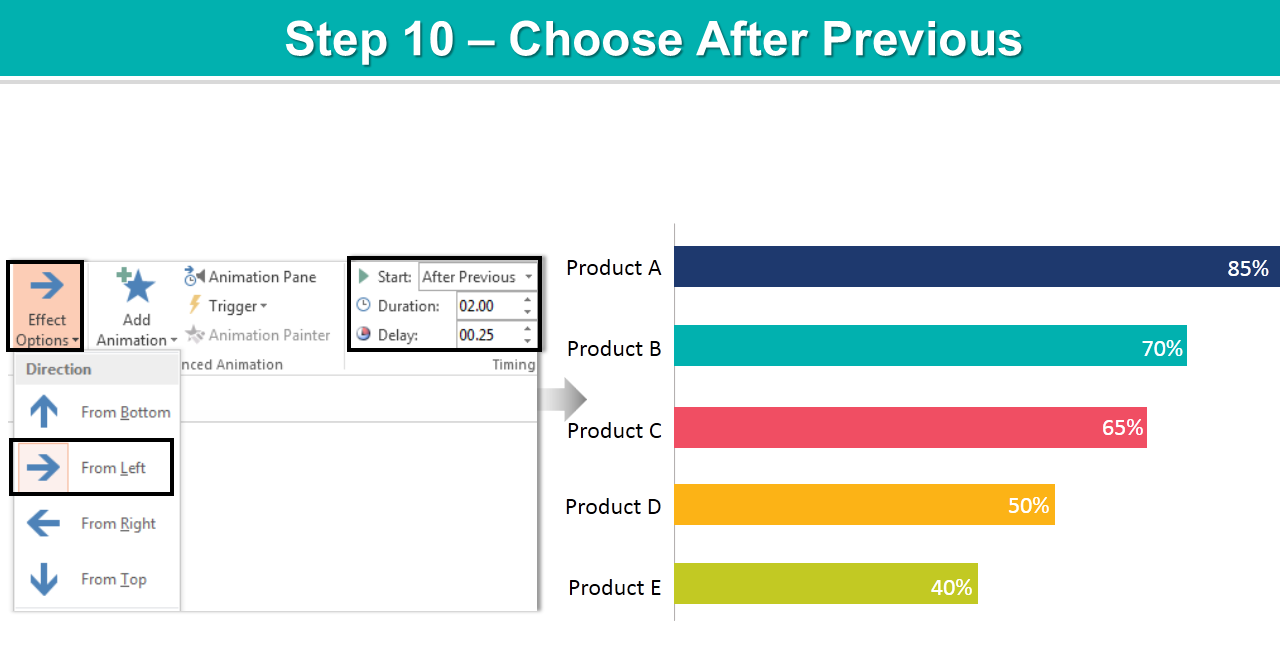
- Select rectangular shape> Animation> Wipe.
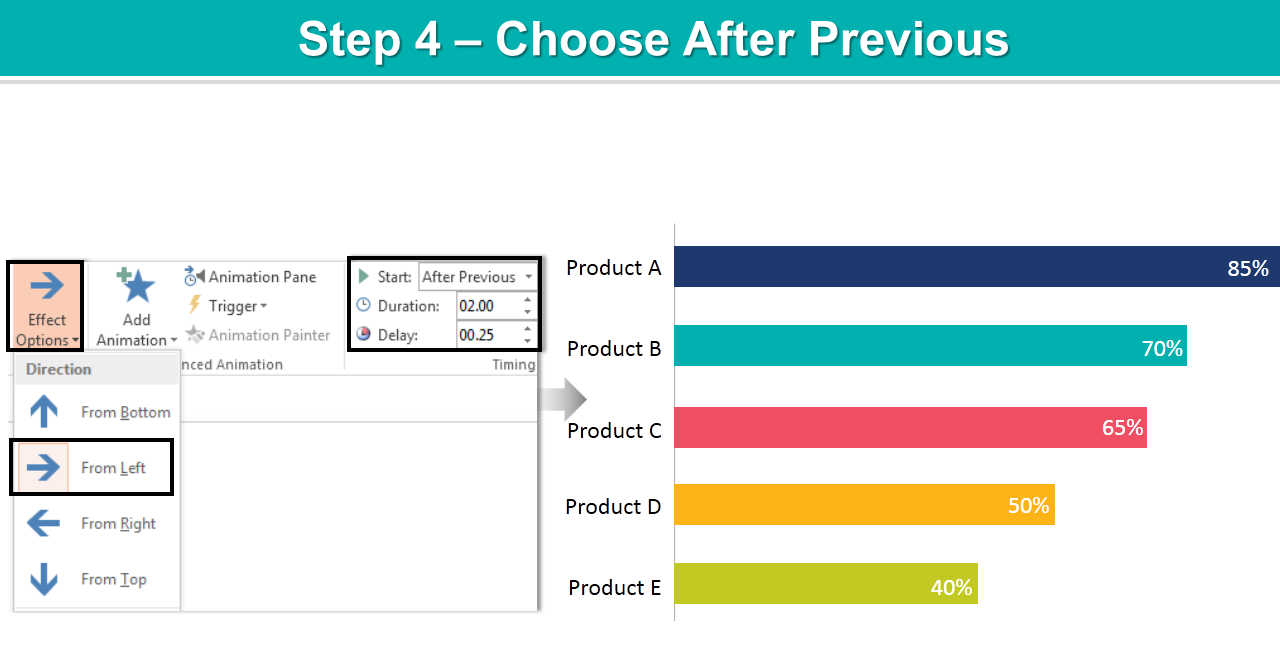
- Choose From Left> After Previous> Duration> 00> Delay> .25 sec.
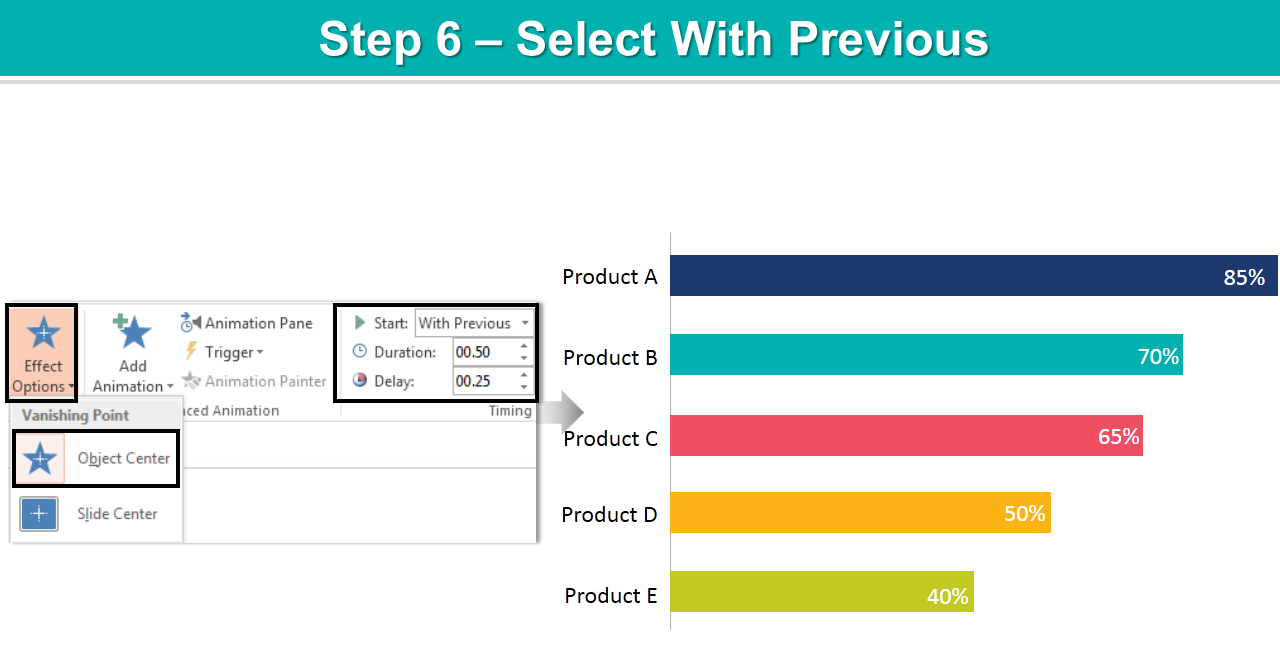
- Select text box again (85%) placed on the rectangular shape> Animation> Zoom.
- Choose Object Center> With Previous> Duration> .50> Delay> .25 sec.
- Choose text box (product B)> Animation> Zoom.
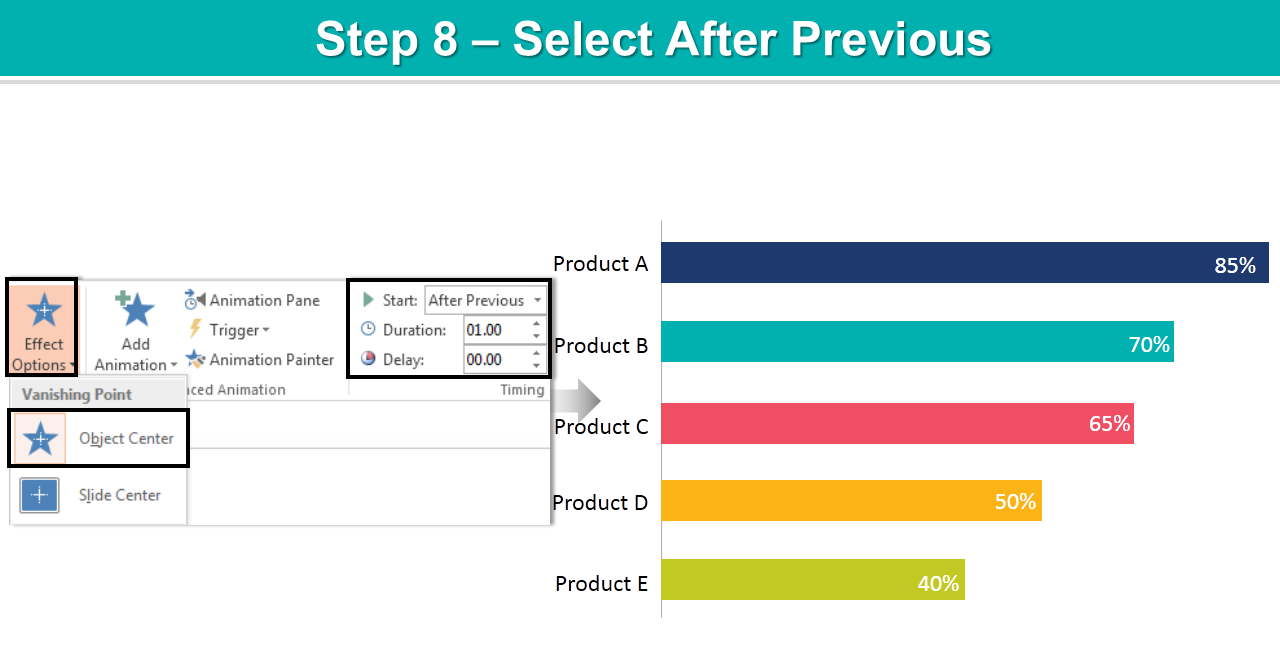
- Select Object Center> After Previous> Duration> 1.00.
- Select rectangular shape> Animation> Wipe.
- Choose From Left> After Previous> Duration> 2.00> Delay> .25 sec.
- Choose text box (70%) placed on the rectangular shape> Animation> Zoom.
- Select Object Center> With Previous> Duration> .50> Delay> .25 sec.
Repeat these steps with rest of the elements. And it’s done.
Below is a step by step video on applying animation to the bar chart.
Try this animation in your presentation and let us know if you have any questions or doubts.
Happy making presentations!


![Learn To Create Animated Info graphic Bar Chart In PowerPoint [Animation Tutorial #5]](https://www.slideteam.net/wp/wp-content/uploads/2018/05/Learn-To-Create-Animated-Bar-Chart-in-PowerPoint-1001x435.png)


 Customer Reviews

